 IEEE/ICACT20240067 Slide.14
[Big Slide]
[YouTube] Oral Presentation
| Virual Oral Presentation Slide by Slide |
|
IEEE/ICACT20240067 Slide.14
[Big Slide]
[YouTube] |
Oral Presentation |
|
|
|
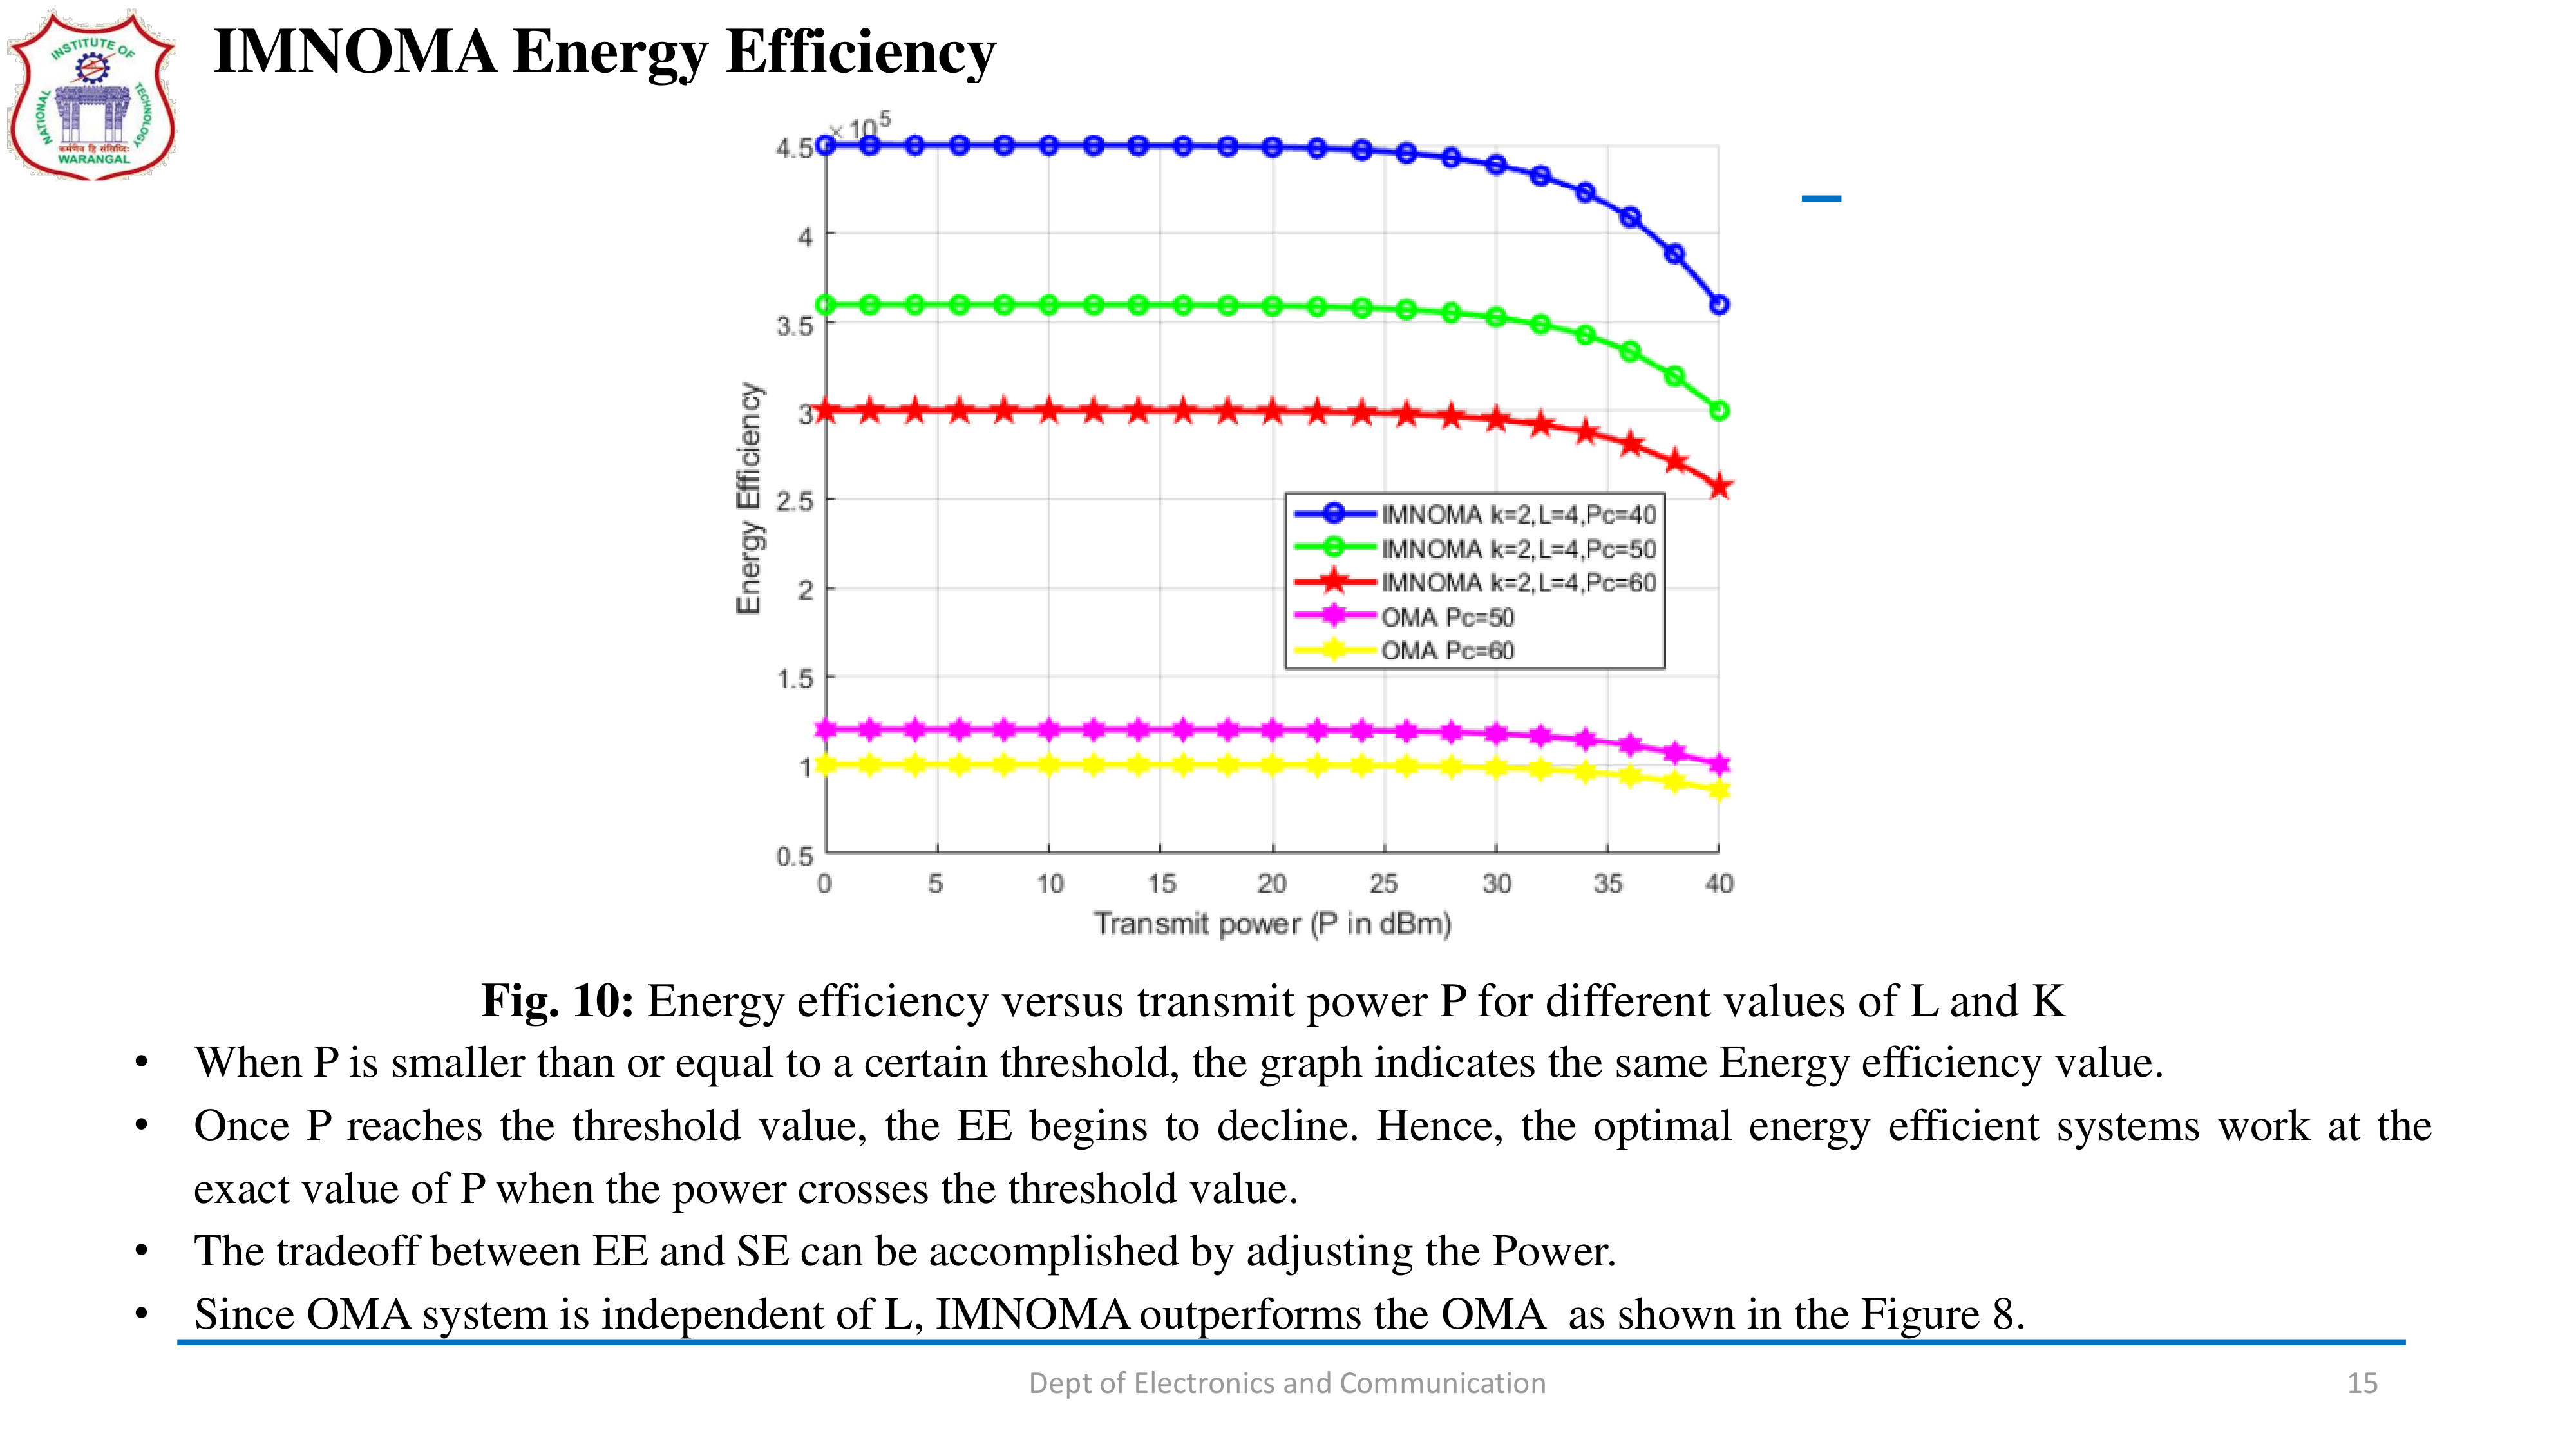
Fig. 10 represents the Energy efficiency versus transmit power P for different values of L and K. From the figure 8, we can observe that when P is smaller than or equal to a certain threshold, the graph indicates the same energy efficiency value. Once P reaches the threshold value, the EE begins to decline. Hence, the optimal energy efficient systems work at the exact value of P when the power crosses the threshold value. | |
| [Go to Next Slide] |