 IEEE/ICACT20240459 Slide.14
[Big Slide]
Oral Presentation
| Virual Oral Presentation Slide by Slide |
|
IEEE/ICACT20240459 Slide.14
[Big Slide]
| Oral Presentation |
|
|
|
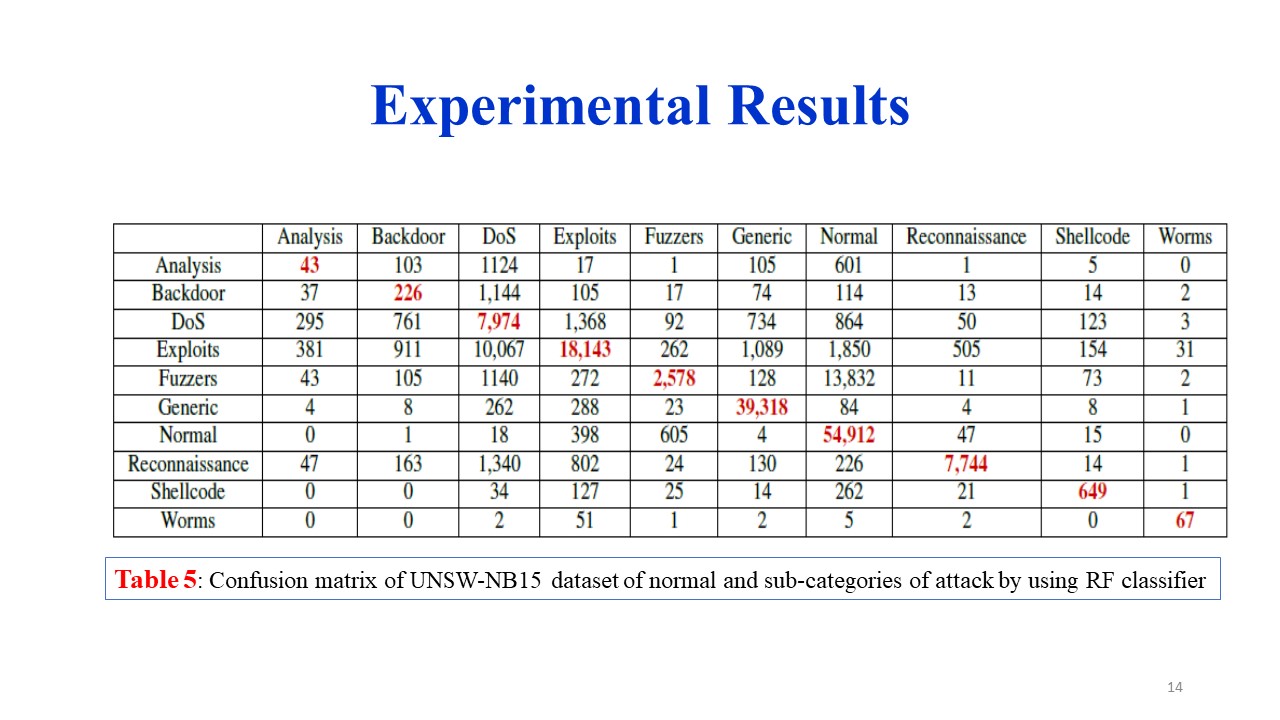
The confusion matrix you provided appears to be assessing the performance of a classification model on a dataset with different classes. Each row in the matrix represents the instances of a true class, and each column represents the instances predicted by the model. The numbers in the cells indicate the counts of instances falling into each combination of true class and predicted class. | |
| [Go to Next Slide] |