 |
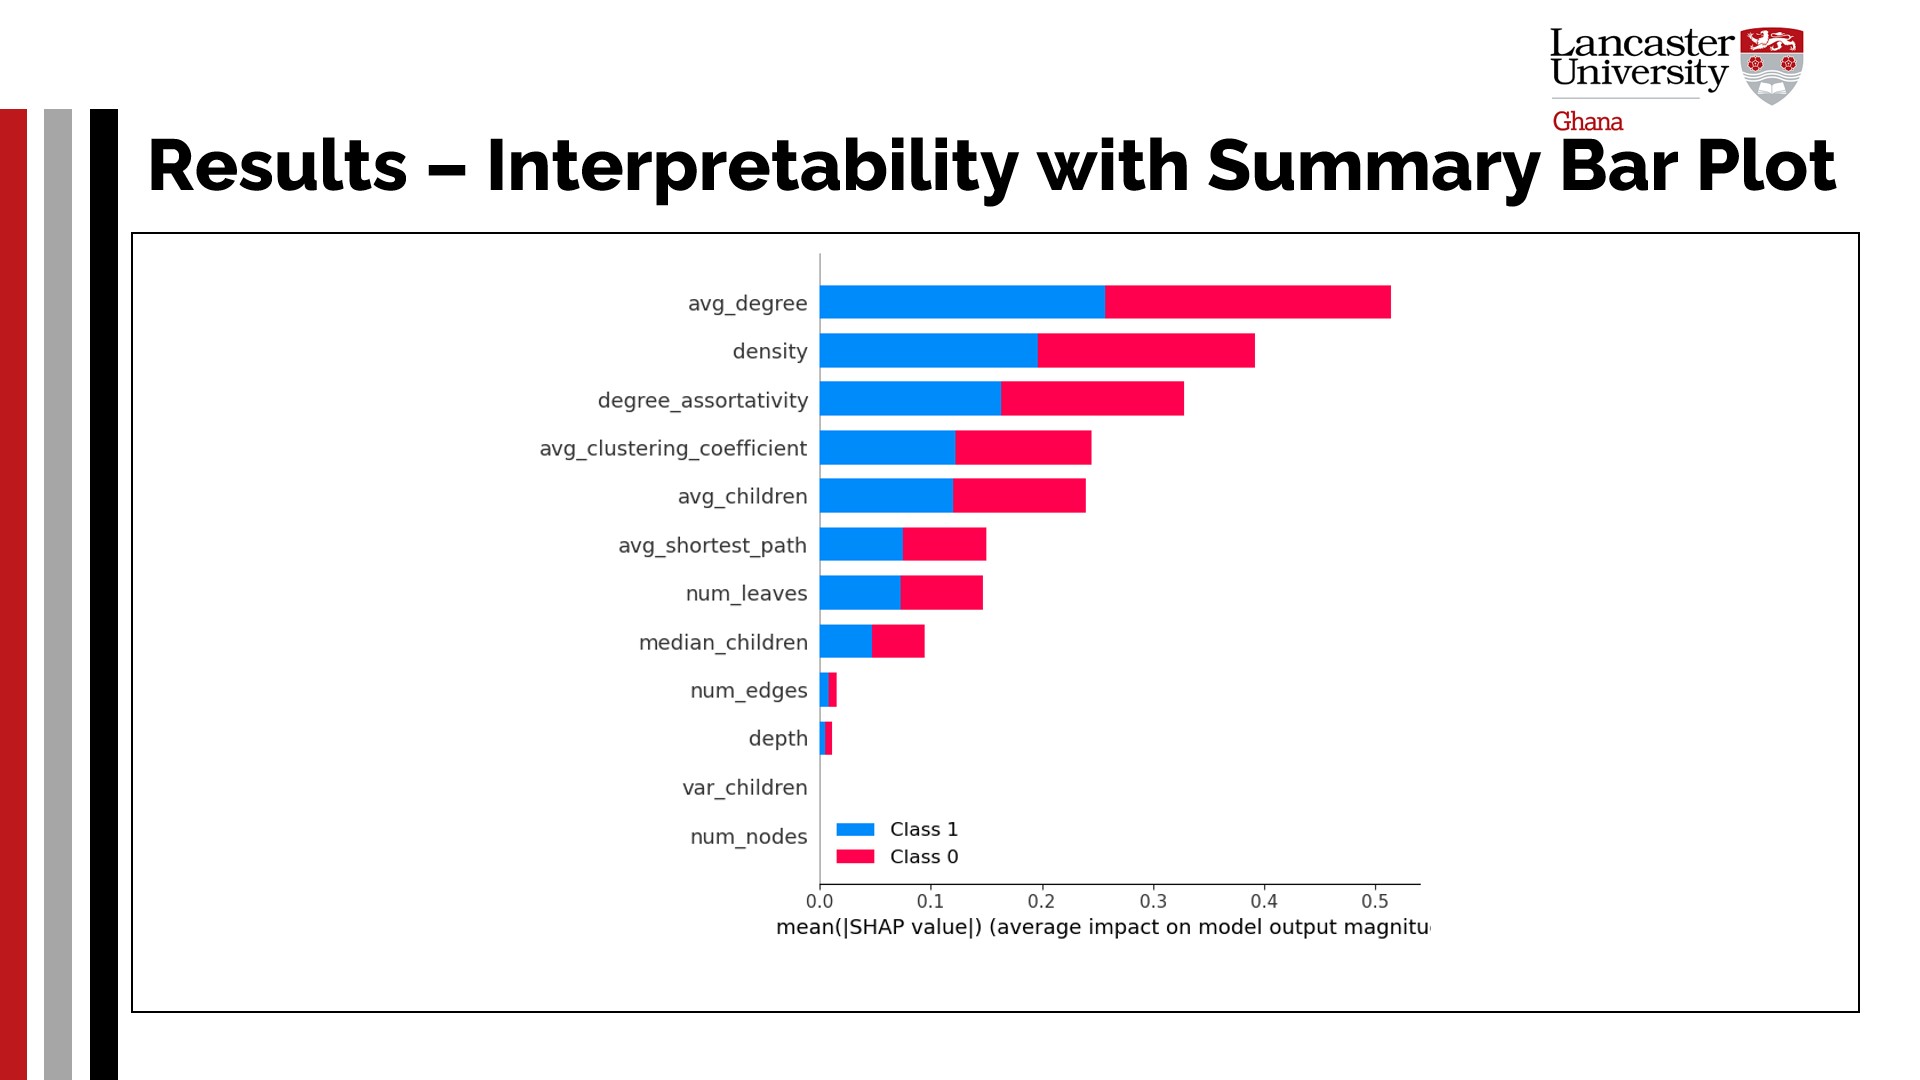
The figure presents a summary plot, where features are listed vertically, and the average magnitude of the SHAP values is plotted horizontally. These features are ranked in descending order of importance (which is defined by the mean SHAP values) in driving predictions. The blue and red bars represent the average SHAP values when classes 1 and 0 are predicted, respectively. It can be concluded that the first three factors from the top significantly influence the prediction of both classes, with avg_degree being the most crucial feature. According to the relative lengths of the bars, class 1 is significantly more affected by the avg_degree. At the same time, the other is somewhat more affected by the ˇ°densityˇ± variable, although it also has an impact on both class predictions. The degree_assortativity feature is influential in model predictions, but has a more balanced effect on both classes. Additionally, the avg_clustering_coefficient, avg_children, and avg_shortest_path provide a noticeable impact on predictions but are not as significant as the top-ranked features. The num_edges, depth, var_children, and num_nodes variables, however, make little to no contribution to the model decisions.
|
 IEEE/ICACT20260055 Slide.14
[Big Slide]