 |
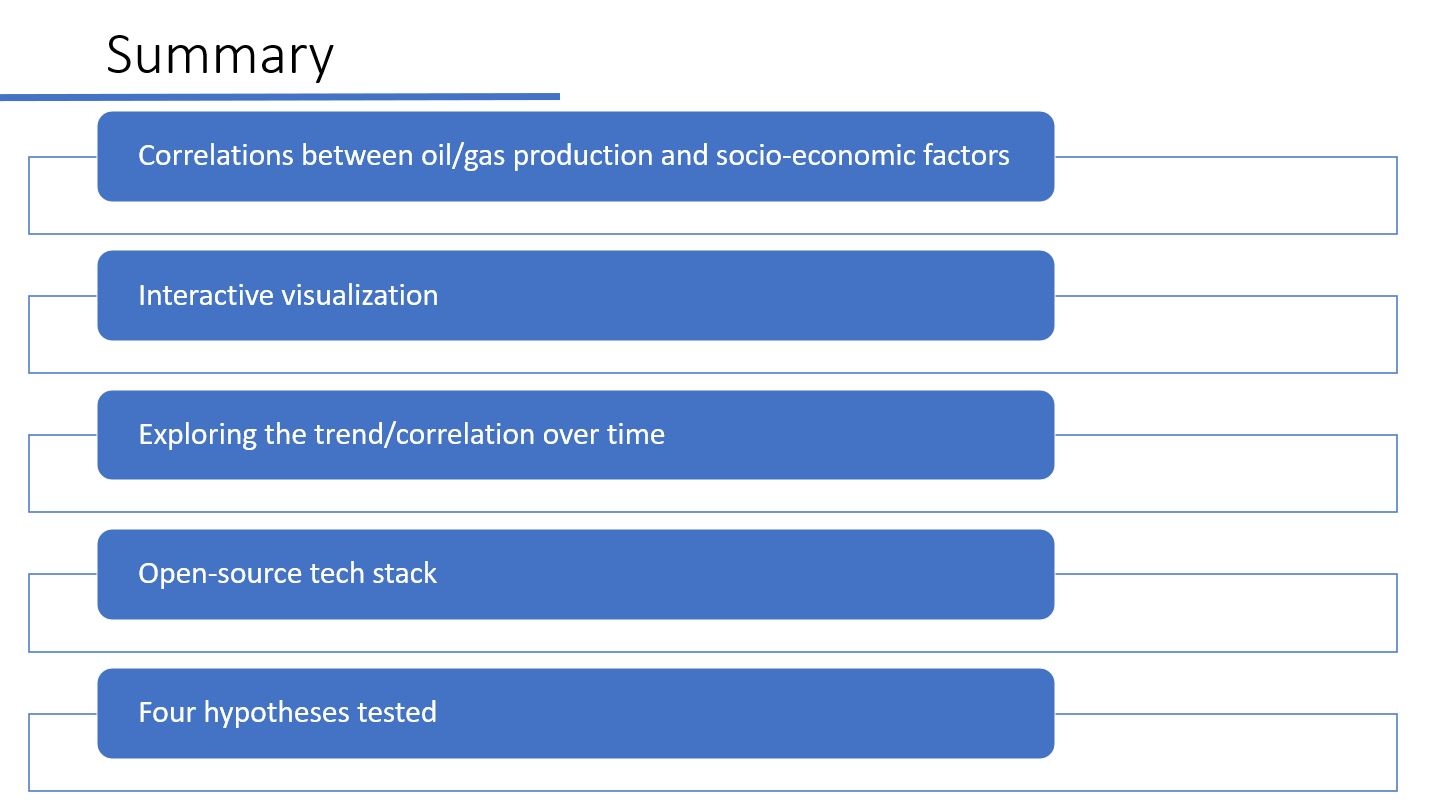
This study examined the correlations between oil/gas production information (production, location, and so on) and socio-economic factors with multiple datasets.
We set up an interactive visualization of oil/gas and all possible socio-economic factors in the same visualization interface.
We explored the trend and correlation over time (that is, performed time-series analysis) based on the oil/gas industry's historical data.
We generally utilized an open source tech stack for storage and visualization of oil/gas and socio-economics.
We adopted the methods of principal component analysis (PCA), linear regression, and random forest to examine the associations for the four hypotheses.
|
 IEEE/ICACT20210130 Slide.15
[Big Slide]