 IEEE/ICACT20210223 Slide.15
[Big Slide]
Oral Presentation
| Virual Oral Presentation Slide by Slide |
|
IEEE/ICACT20210223 Slide.15
[Big Slide]
| Oral Presentation |
|
|
|
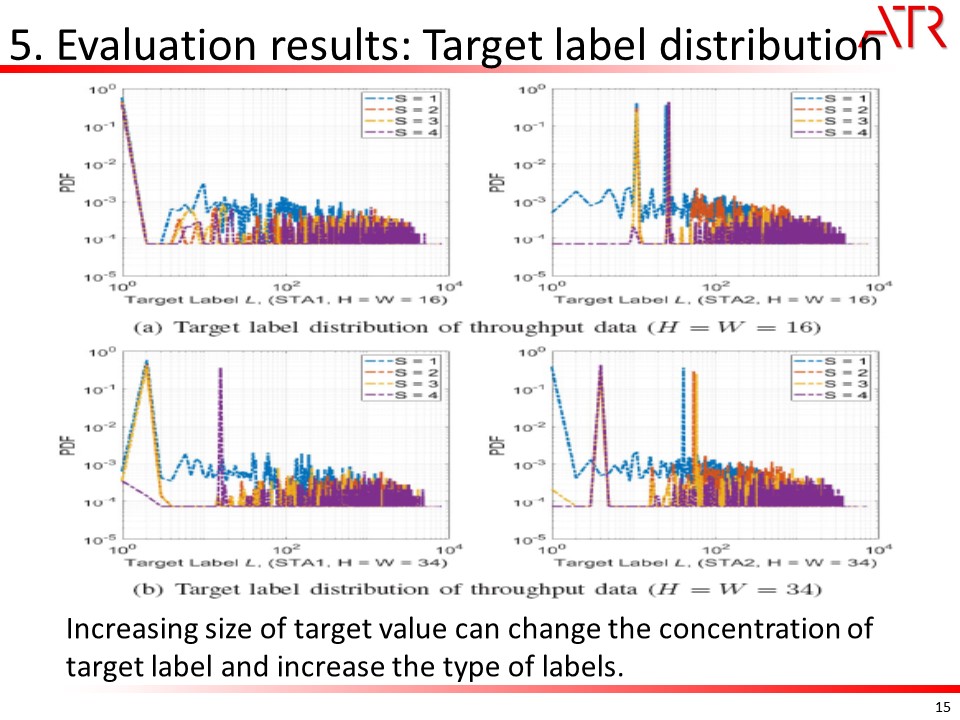
This figure shows the target label (L) distribution of throughput data of both STAs for different sizes of the input matrix. The size of target vector S is changed from 1 to 4. It is shown that the distribution of label after target vectorization is spread over a wider range as S is increased. More labels appear which makes the CNN have more options for its input. Therefore, it benefits the improvement of prediction accuracy. | |
| [Go to Next Slide] |