 IEEE/ICACT20220181 Slide.15
[Big Slide]
[YouTube] Oral Presentation
IEEE/ICACT20220181 Slide.15
[Big Slide]
[YouTube] Oral Presentation 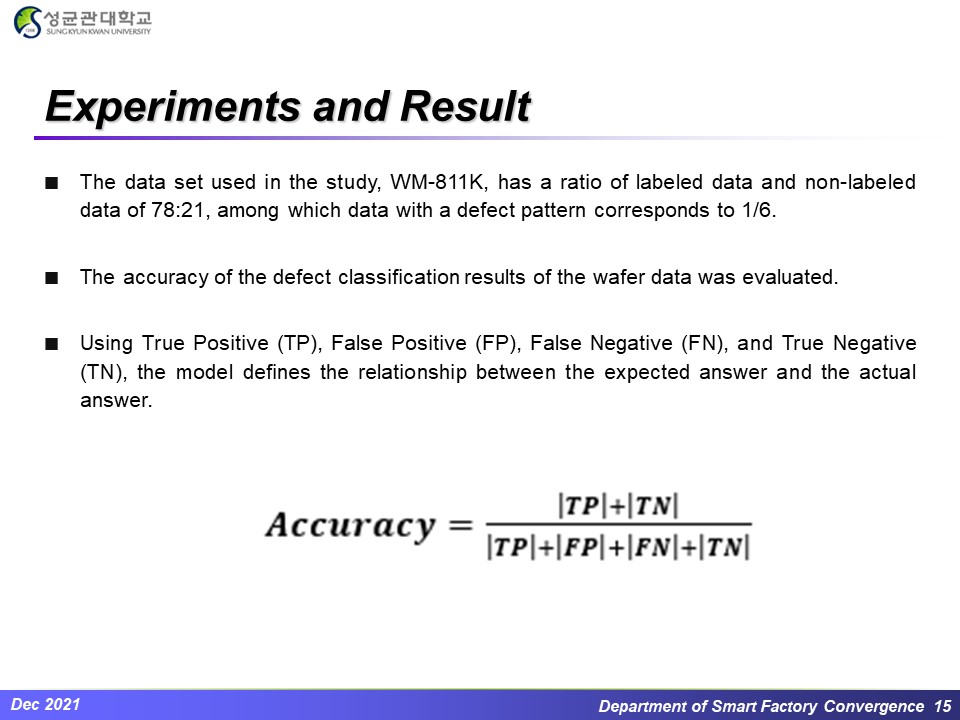
| Virual Oral Presentation Slide by Slide |
|
IEEE/ICACT20220181 Slide.15
[Big Slide]
[YouTube] |
Oral Presentation |
|
|
|
The data set used in the study, WM-811K, has a ratio of labeled data and non-labeled data of 78:21, among which data with a defect pattern corresponds to 1/6. The accuracy of the defect classification results of the wafer data was evaluated. Using True Positive (TP), False Positive (FP), False Negative (FN), and True Negative (TN), the model defines the relationship between the expected answer and the actual answer. | |
| [Go to Next Slide] |