 IEEE/ICACT20240312 Slide.15
[Big Slide]
Oral Presentation
| Virual Oral Presentation Slide by Slide |
|
IEEE/ICACT20240312 Slide.15
[Big Slide]
| Oral Presentation |
|
|
|
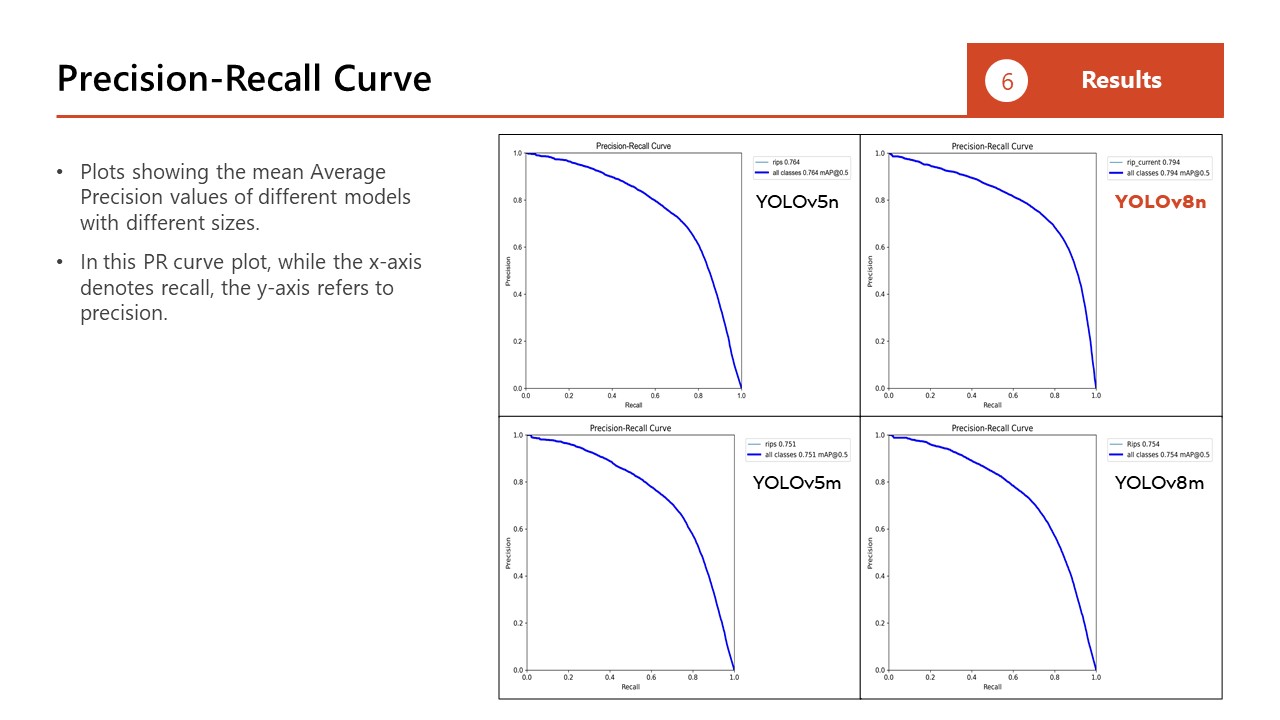
Plots showing the mean Average Precision values of different models with different sizes. In this Precision-Recall curve plot, while the x-axis denotes recall, the y-axis refers to precision. | |
| [Go to Next Slide] |