 IEEE/ICACT20250232 Slide.15
[Big Slide]
Oral Presentation
| Virual Oral Presentation Slide by Slide |
|
IEEE/ICACT20250232 Slide.15
[Big Slide]
| Oral Presentation |
|
|
|
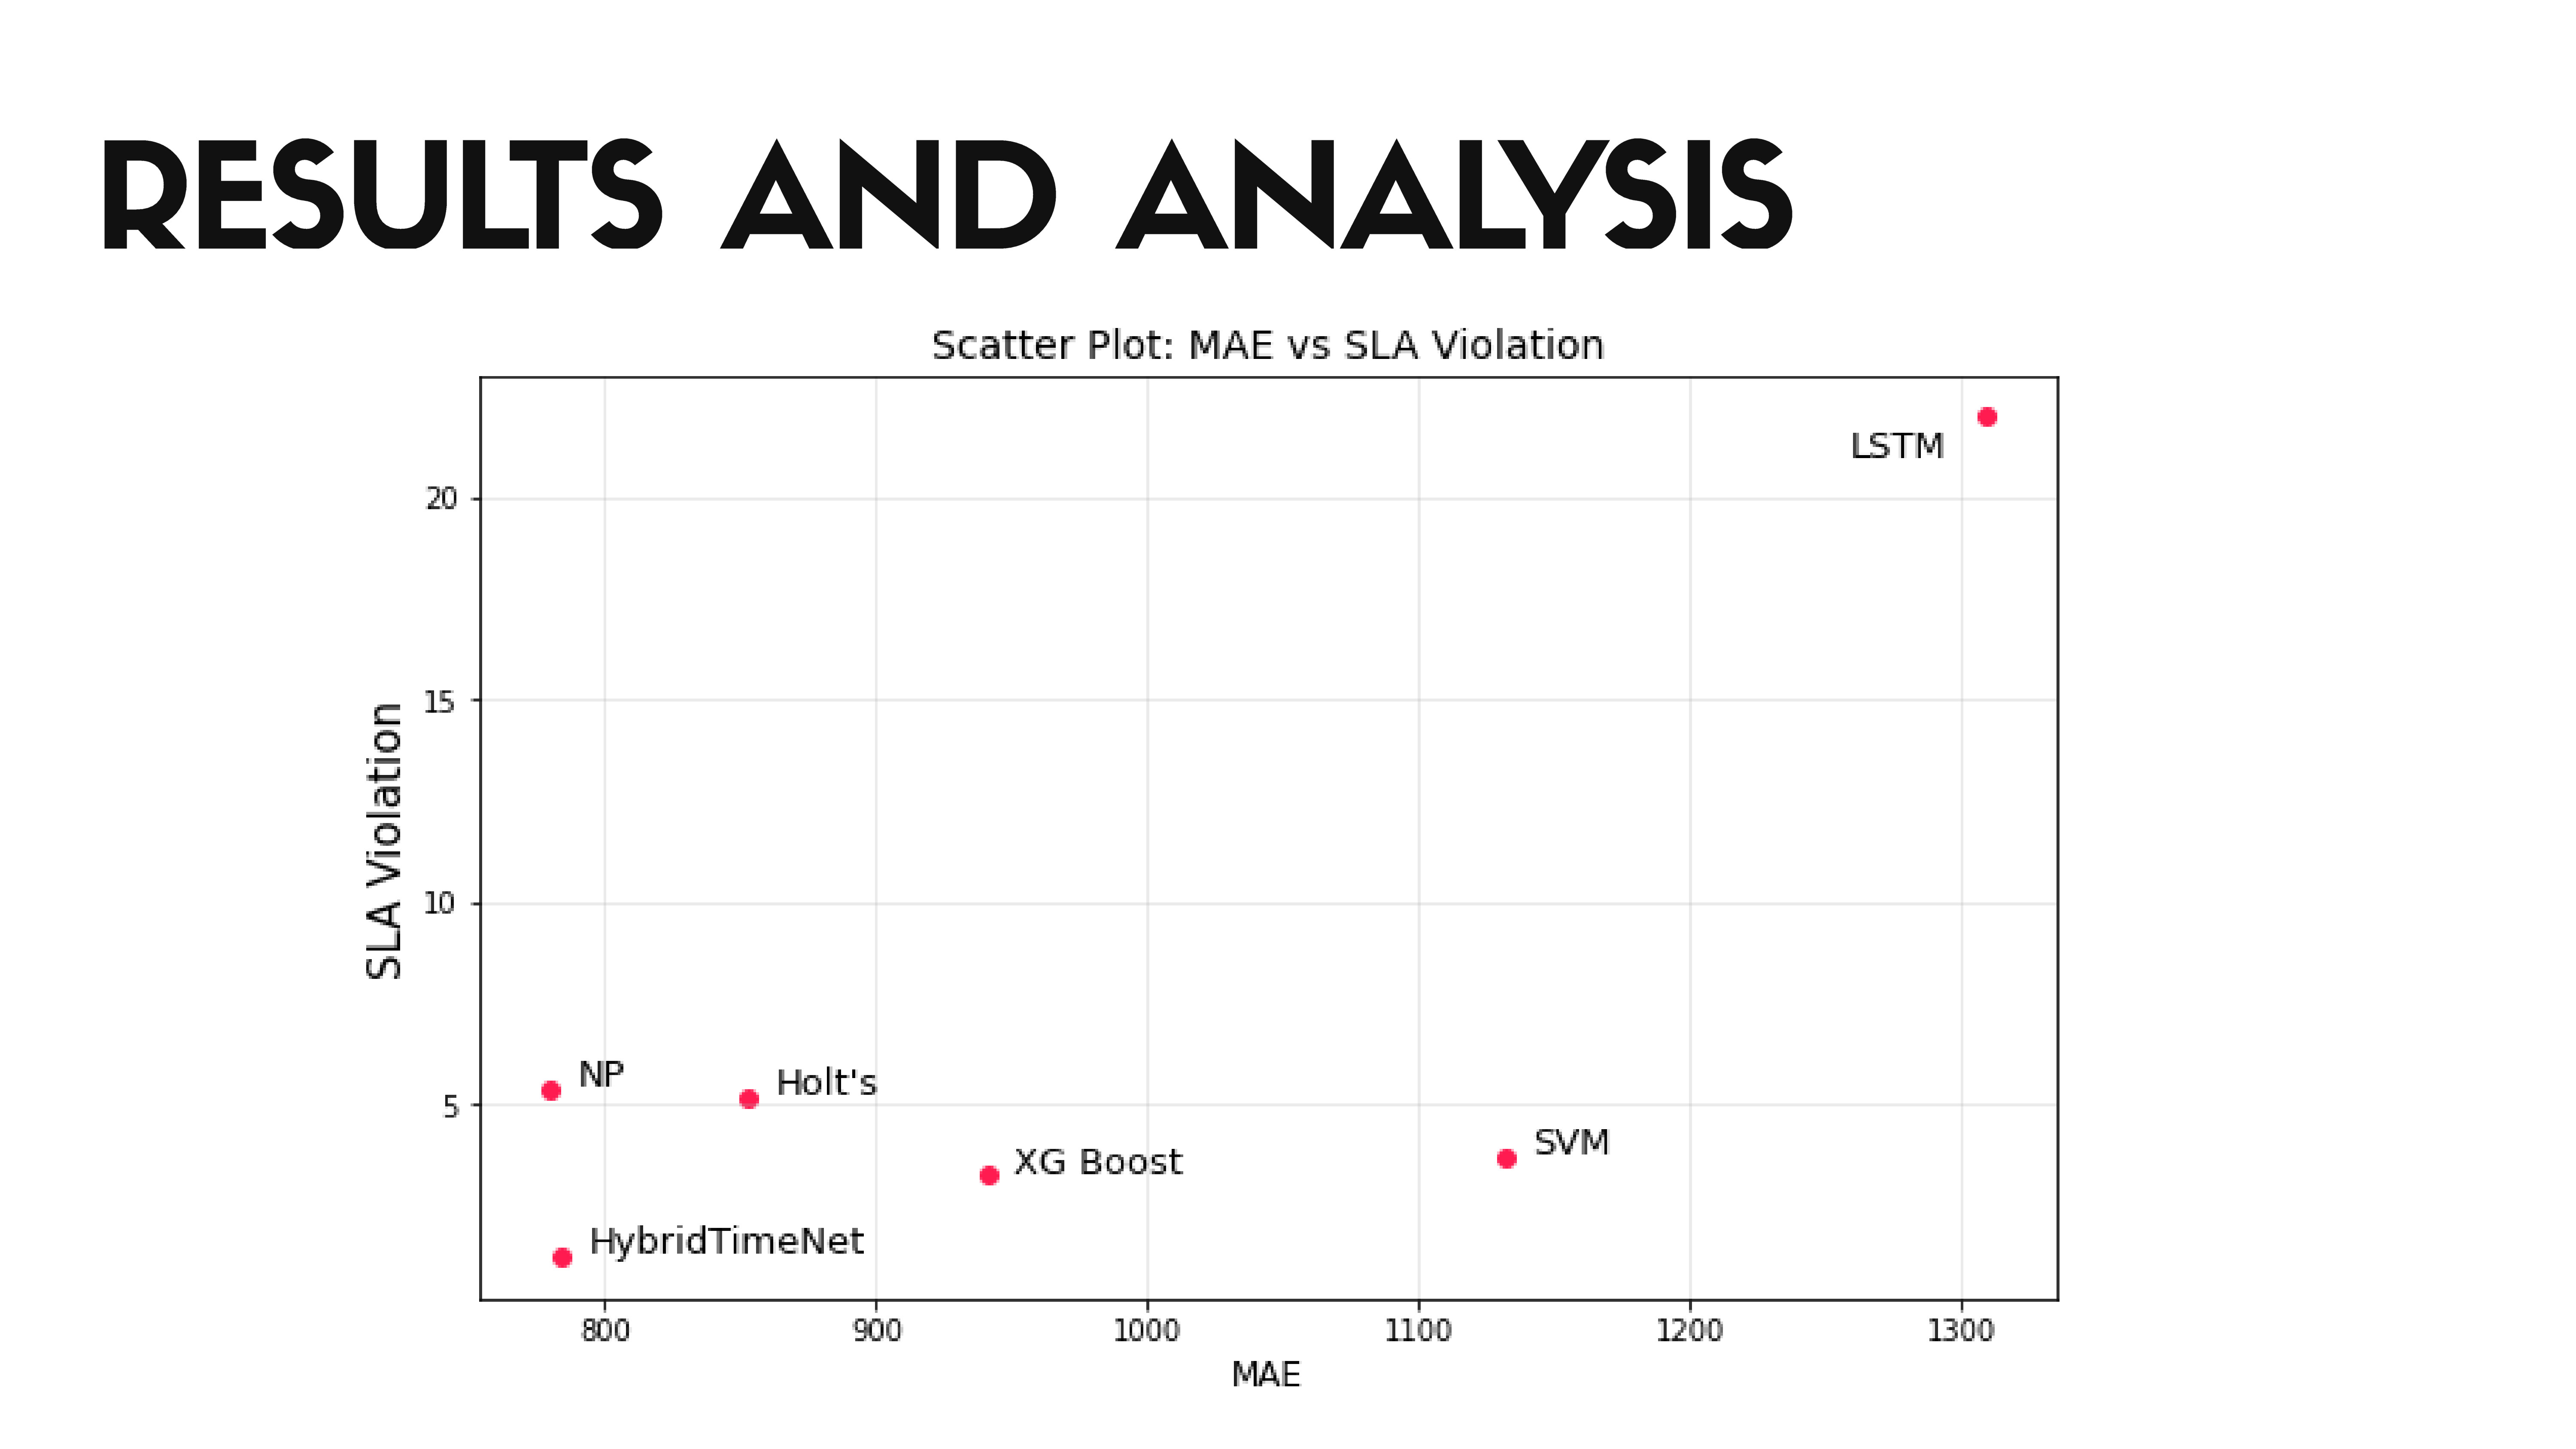
The scatter plot visualizes the relationship between Mean Absolute Error (MAE) and Service Level Agreement (SLA) violations for different models. Each point on the plot represents a model, with its position determined by its MAE value on the x-axis and its SLA violation rate on the y-axis. The plot helps to understand the trade-off between prediction accuracy (lower MAE) and service quality (lower SLA violations) | |
| [Go to Next Slide] |