 |
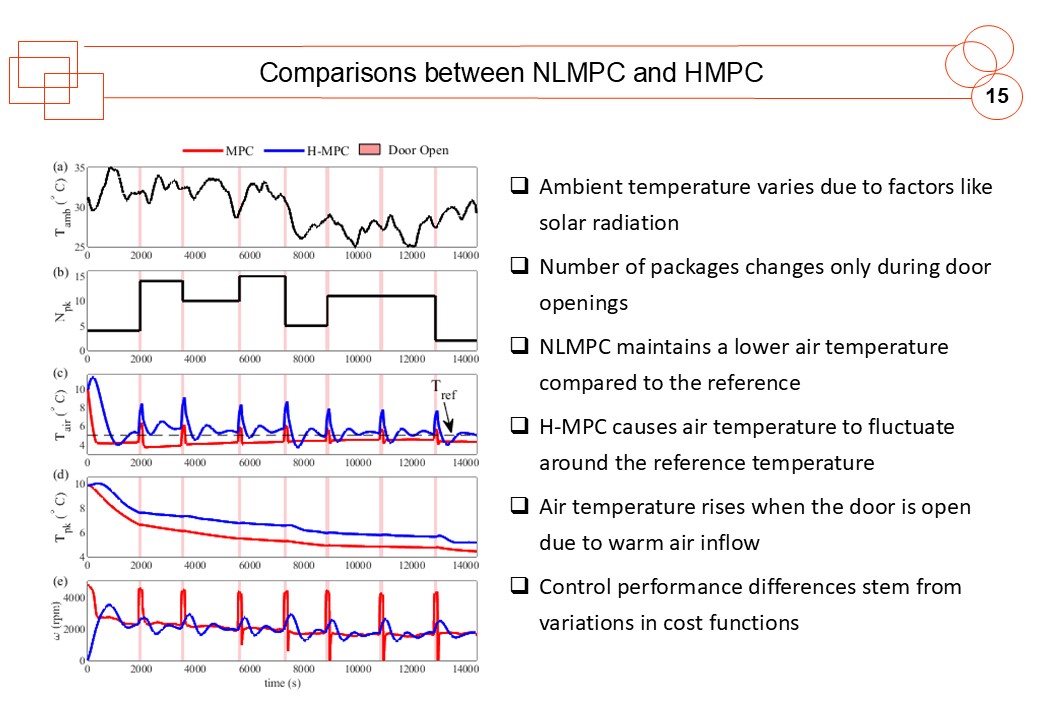
In this figure: The first curve represents ambient temperature, which varies between 25–35”ĘC due to solar radiation. The second curve shows the number of packages, which changes when the van doors open. The third curve compares the cargo space temperature under both MPC controllers. We can see that Nonlinear MPC maintains a lower air temperature compared to the reference, whereas Hierarchical MPC allows the cargo space temperature to fluctuate around the reference. These differences come from variations in the cost functions. |
 IEEE/ICACT20250244 Slide.15
[Big Slide]