 |
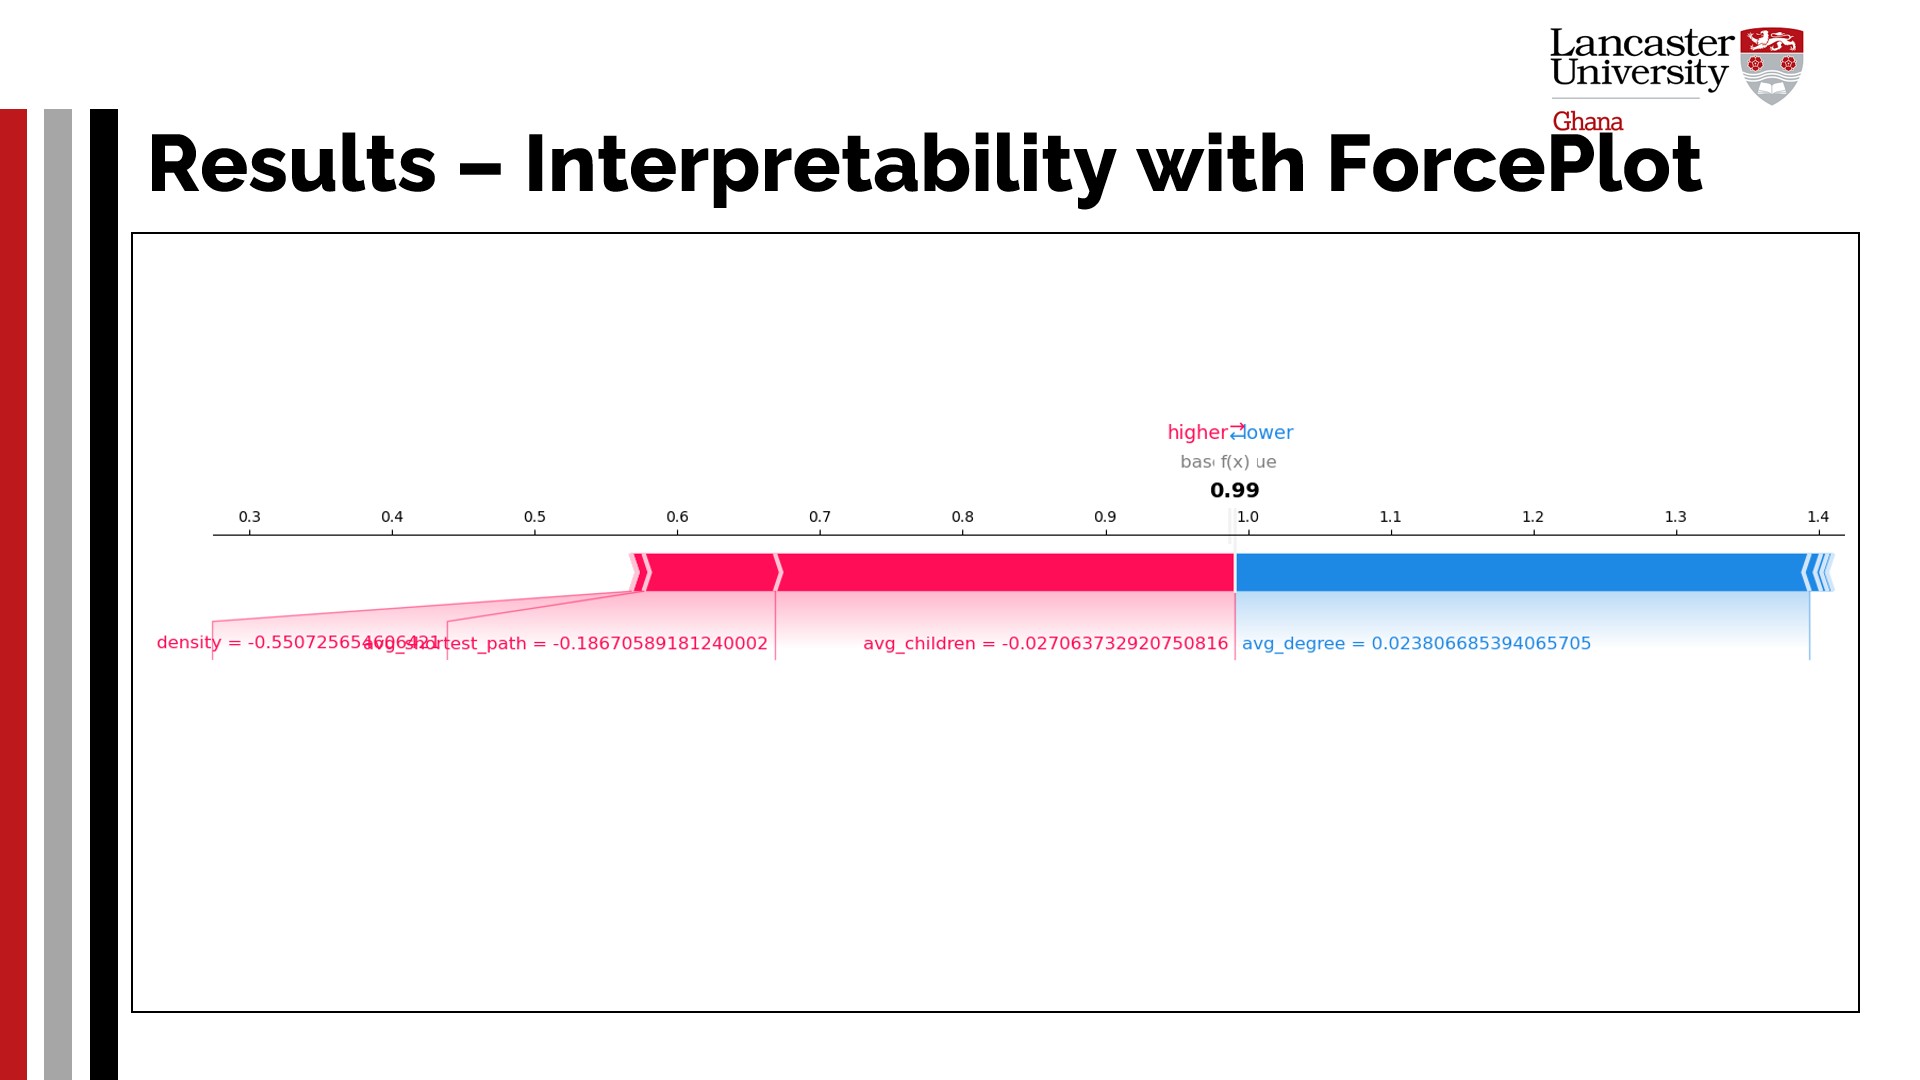
Furthermore, this study utilises the SHAP force plot, as shown in the figure, to visualise and explain how the hybrid model arrives at a specific prediction for an instance. This combines SHAP values to illustrate how each feature contributes to pushing the prediction of the model toward one class or the other. Firstly, the base value, which denotes the model¡¯s average prediction across the dataset without any features, was defined. Then, the SHAP values quantify the contribution of each feature, assigning positive and negative values that push the prediction toward the necessary classes. Essentially, the prediction begins at the base value, with contributors in red pushing the prediction downward (toward Class 0) and those in blue pushing it upward (toward Class 1), as shown in the figure
|
 IEEE/ICACT20260055 Slide.15
[Big Slide]