 IEEE/ICACT20260241 Slide.15
[Big Slide]
Oral Presentation
| Virual Oral Presentation Slide by Slide |
|
IEEE/ICACT20260241 Slide.15
[Big Slide]
| Oral Presentation |
|
|
|
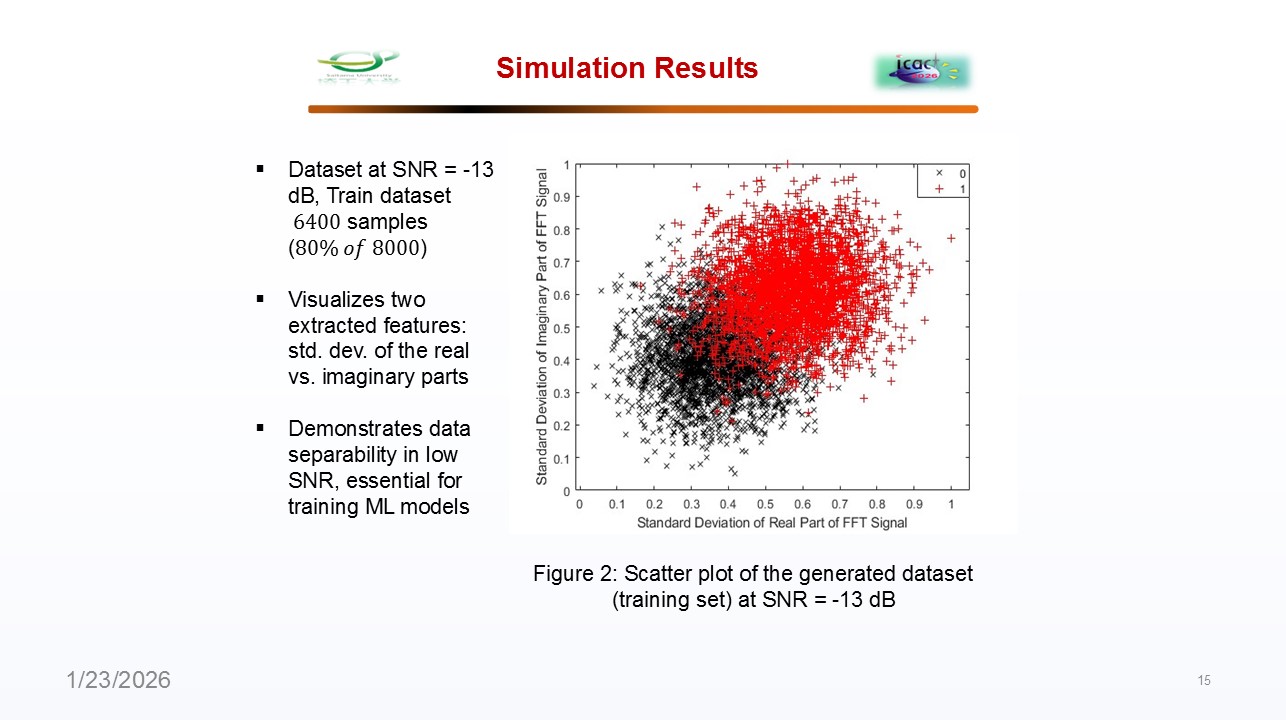
Lets look at the results. First, this scatter plot shows a snapshot of our training data at a very challenging SNR of -13 dB. You can see the distribution and overlap between the signal present and noise only classes, which sets the challenges for different classification models to accurately identify the PU. | |
| [Go to Next Slide] |