 |
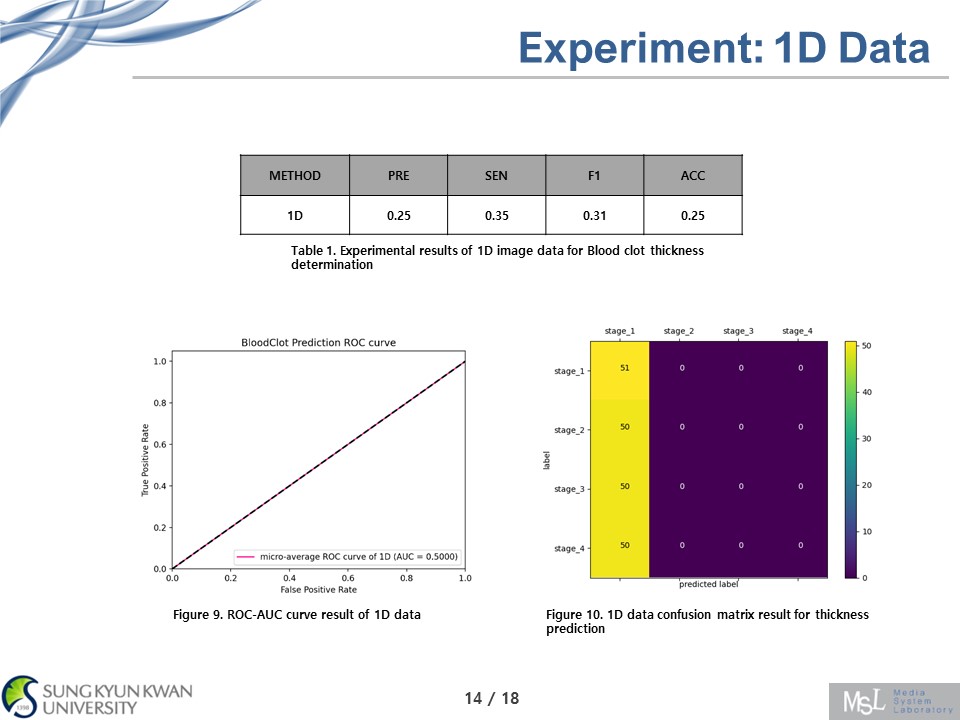
This result is when the blood clot thickness is predicted using only 1D data. We used 1D convolution and the results are in Table 1. Four performance evaluation indicators were used. We tried not only to measure accuracy, but also to measure Precision, Sensitivity, and F1 score to show whether this experiment is really accurate.
Overall, it shows low performance in thickness prediction and low performance in ROC-AUC curve. ROC-AUC curve indicates better performance as the curve close to 1.
Figure 10 is 1D data confusion matrix result for thickness prediction. In here, prediction value is almost stage 1. so, only using 1D data shows inaccurate prediction.
|
 IEEE/ICACT20230066 Slide.16
[Big Slide]
[YouTube]