 |
. Face recognition
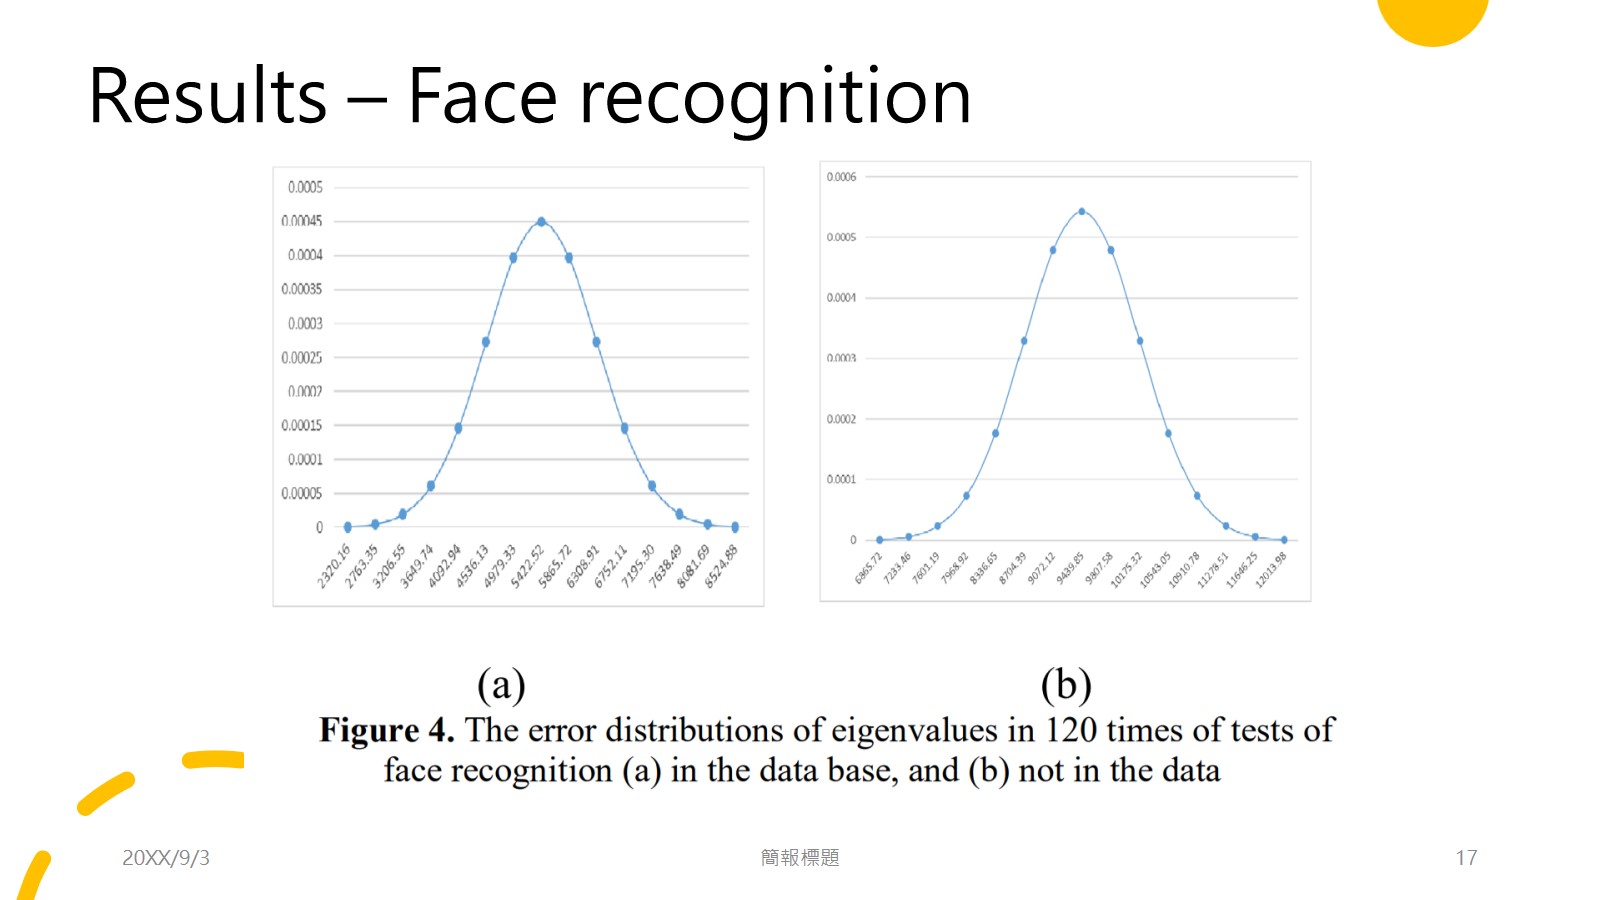
The error distributions of eigenvalues in 120 times of tests
of face recognition (a) in the data base, and (b) not in the data
base were shown in Fig. 4 where X-axis denoted as the error
of eigenvalue and Y-axis denoted as the ratio of the deviation.
In (a), the mean of the error of eigenvalue (¥́) was 5422.52
and the standard deviation (¥̣) was 2019.6. However, in (b),
¥́was 9439.85 and¥̣ was 1750.4. The better threshold was
7200. For strangers of this smart mirror, the successful rate of
strangers (SRS) was 100%. For the user, SRS = 90% and
accuracy of user¡¯s recognition (SRU) was 100%. |
 IEEE/ICACT20230071 Slide.16
[Big Slide]
[YouTube]