 IEEE/ICACT20240426 Slide.16
[Big Slide]
[YouTube] Oral Presentation
| Virual Oral Presentation Slide by Slide |
|
IEEE/ICACT20240426 Slide.16
[Big Slide]
[YouTube] |
Oral Presentation |
|
|
|
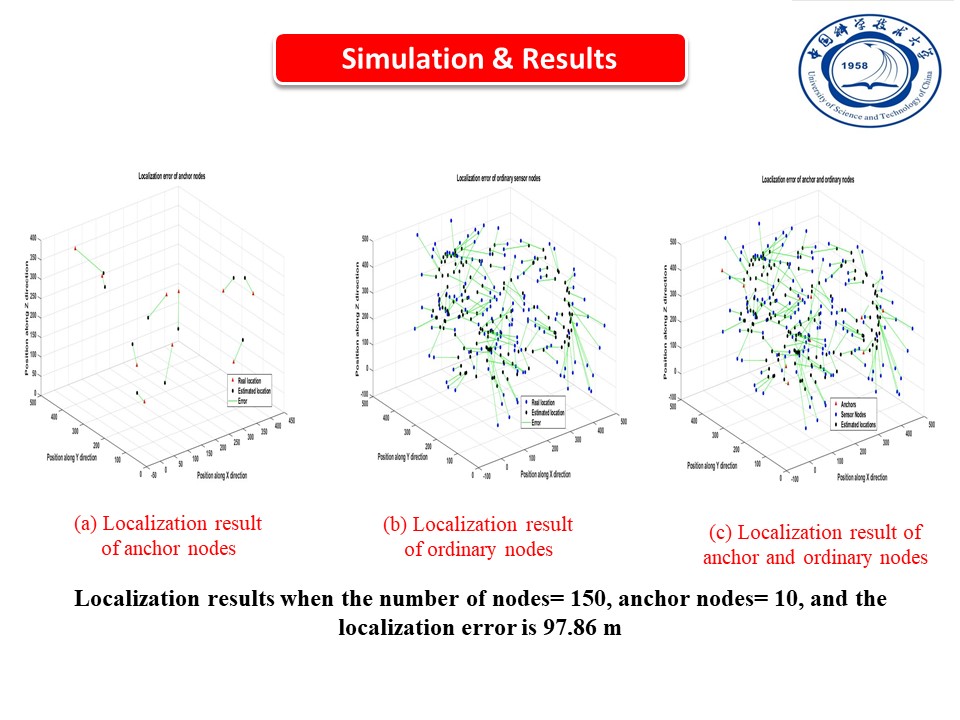
Second, the localization results when the number of nodes is 150. As we can see, Figure (a) presents the movement of the anchor nodes. While Figure (b) shows the relation between the estimated and the actual locations of the ordinary nodes with an average localization error of 97.86 m. In contrast, Figure (c) presents the localization results for all anchors and ordinary nodes. | |
| [Go to Next Slide] |