 IEEE/ICACT20250032 Slide.16
[Big Slide]
Oral Presentation
| Virual Oral Presentation Slide by Slide |
|
IEEE/ICACT20250032 Slide.16
[Big Slide]
| Oral Presentation |
|
|
|
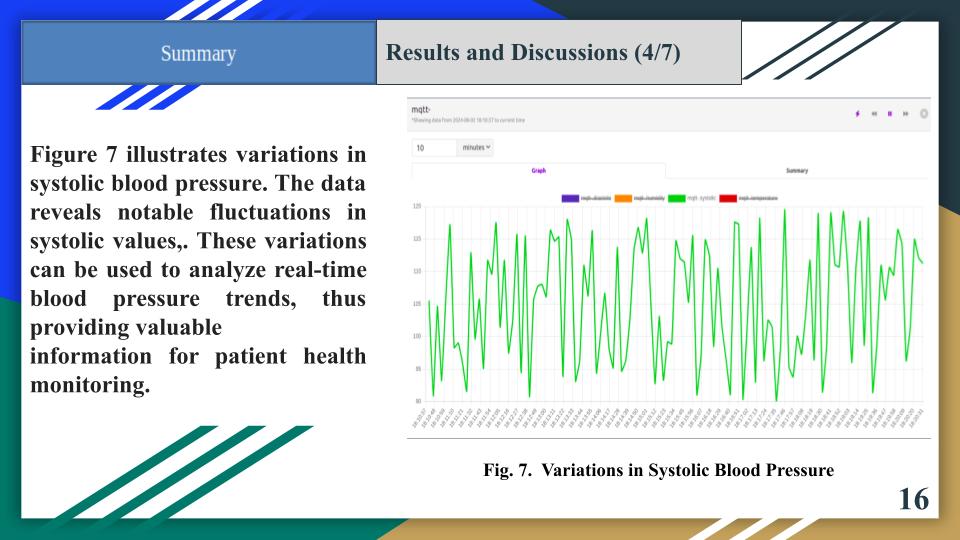
Figure 7 illustrates variations in systolic blood pressure. The data reveals notable fluctuations in systolic values,. These variations can be used to analyze real-time blood pressure trends, thus providing valuable information for patient health monitoring. | |
| [Go to Next Slide] |