 |
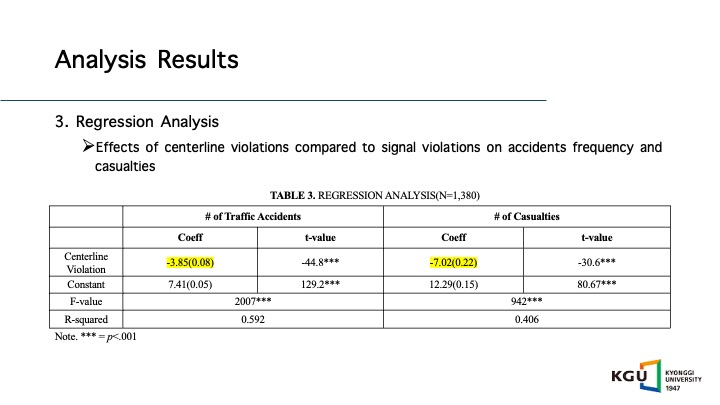
The regression analysis further highlights the effects of different types of traffic violations on accident frequency and casualties.
Compared to centerline violations, traffic hot spot sites with signal violations experience approximately 4 more accidents.
The model fit statistics indicate that around 59% of the variation in accident counts is explained by the type of violation.
Regarding casualties, sites with signal violations experience roughly 7 more, although the model explains relatively less variation in this outcome, accounting for only 40%.
|
 IEEE/ICACT20260100 Slide.16
[Big Slide]