 |
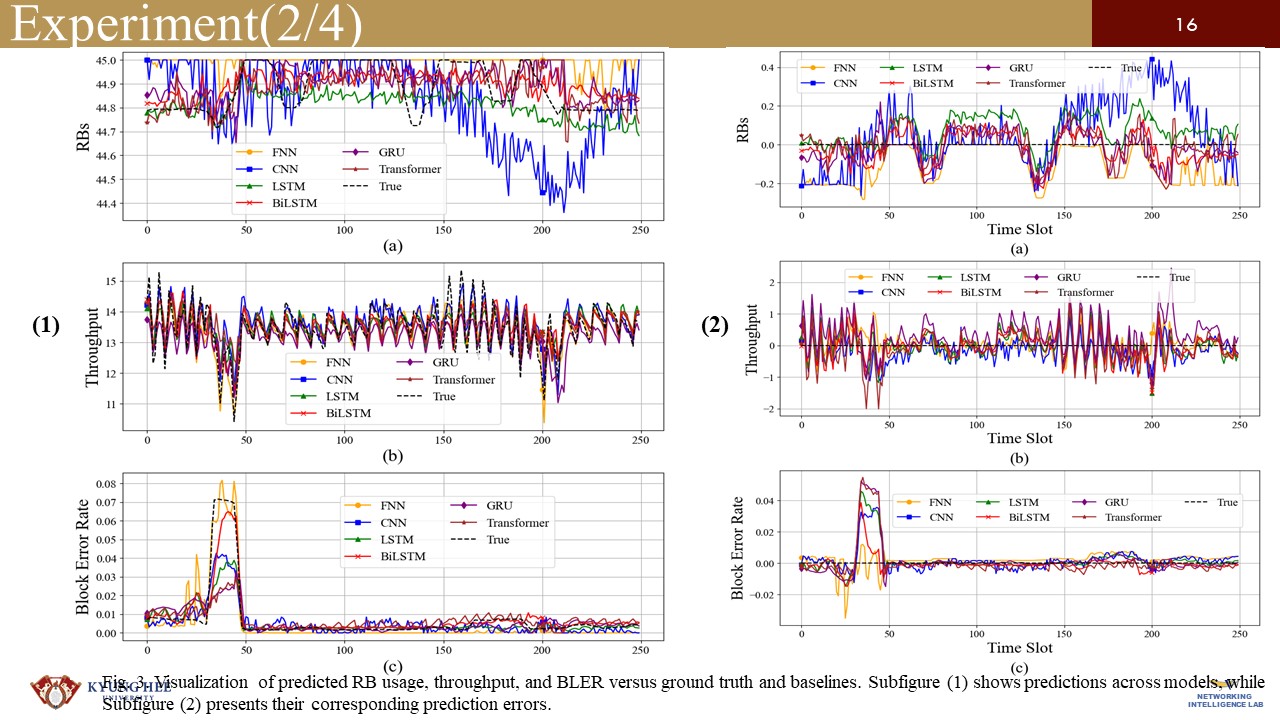
In Fig. 3, we present a visual comparison between the
predicted and ground truth values of throughput, RBs usage,
and BLER, along with their corresponding prediction errors.
The left side of the figure displays the predicted values
alongside the actual ground truth, while the right side depicts
the prediction errors. For both sides, subfigures (a), (b), and (c)
represent RBs, throughput, and BLER, respectively. As shown
in Fig. 3(1), the proposed Bi-LSTM model accurately predicts
the required RBs, throughput, and BLER for the next time slot,
closely aligning with the ground truth and outperforming other
baseline models. In Fig. 3(2), the BiLSTM model consistently
outperforms the other models across all three metrics. For RB
prediction (a), BiLSTM closely follows the true trend after the
initial time steps, capturing key fluctuations with relatively
small errors. In throughput prediction (b), it achieves high
accuracy with errors near zero, aside from a few minor spikes
that remain negligible compared to the other methods. For
BLER prediction (c), BiLSTM maintains near-zero error for
most of the time, closely tracking the ground truth. Although
a noticeable spike appears around time steps 40–50, its overall
performance remains superior, highlighting its effectiveness
over baseline models. |
 IEEE/ICACT20260367 Slide.16
[Big Slide]