 IEEE/ICACT20210173 Slide.17
[Big Slide]
Oral Presentation
| Virual Oral Presentation Slide by Slide |
|
IEEE/ICACT20210173 Slide.17
[Big Slide]
| Oral Presentation |
|
|
|
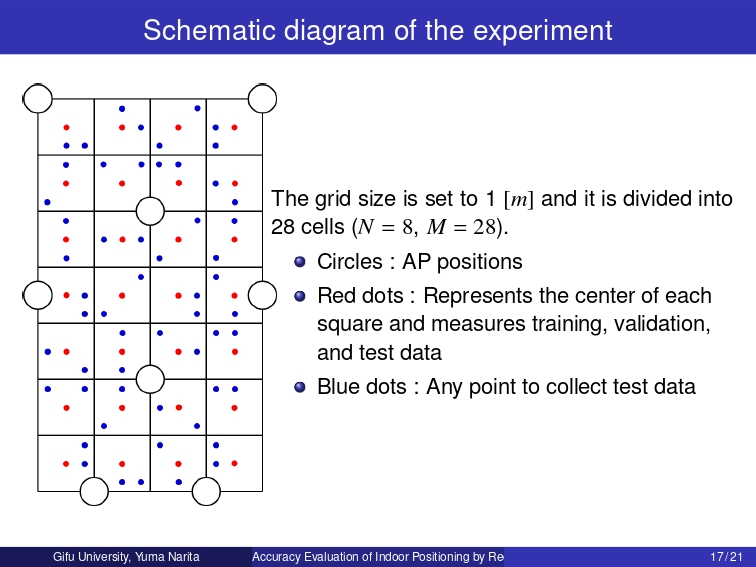
This figure is a schematic diagram of the experiment. The grid size is set to 1 [m], and it is divided into 28 cells. That is, N = 8, M = 28. The circle indicates the location of the access point. The red dots in the figure represent the center of each square and measure training, validation, and test data. The blue dots represent arbitrary points, and only test data is measured. | |
| [Go to Next Slide] |