 |
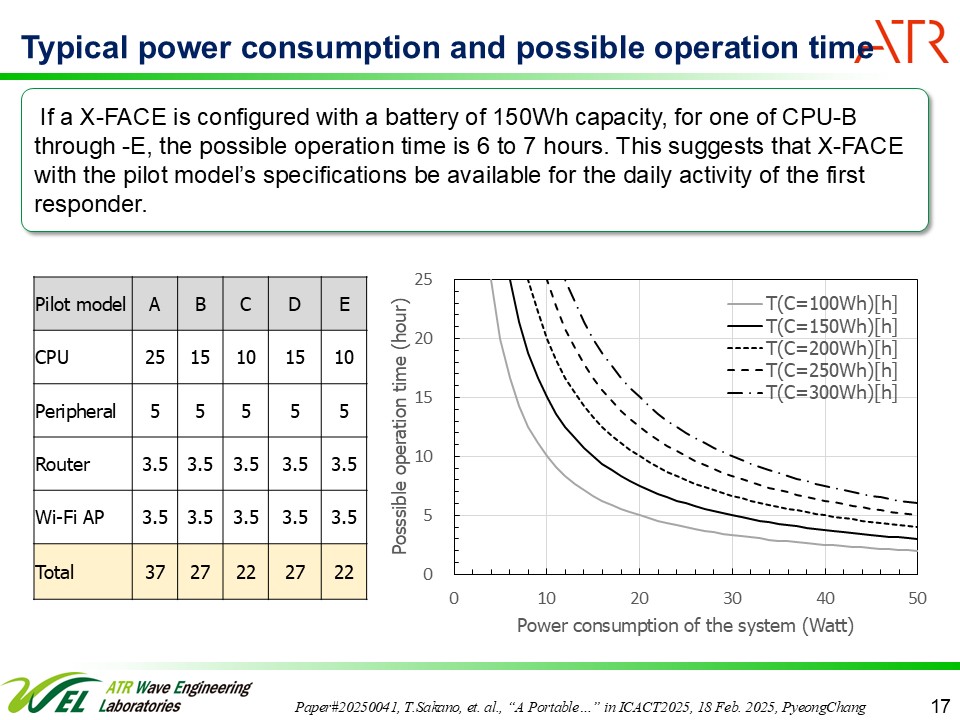
We analyzed typical power consumption of the pilot model and estimated possible operation time.
The table shows the measured power consumption of the pilot model depending on the installed CPUs from A through E.
The graph shows the estimated relationship between power consumption of the system and possible operation time.
If you see the plotted line of battery capacity of 150Wh, you can say, for one of CPU-B through -E, the possible operation time is 6 to 7 hours.
This suggests that X-FACE with the pilot model¡¯s specifications be available for the daily activity of the first responder.
|
 IEEE/ICACT20250041 Slide.17
[Big Slide]