 |
Each tourist spot has their own area and tourist arrival rate. Also, service rate should be considered in various viewpoint such as service provider perspective and user perspective. Thus, to offer transportation service in tourist spot, parameters have to be determined properly.
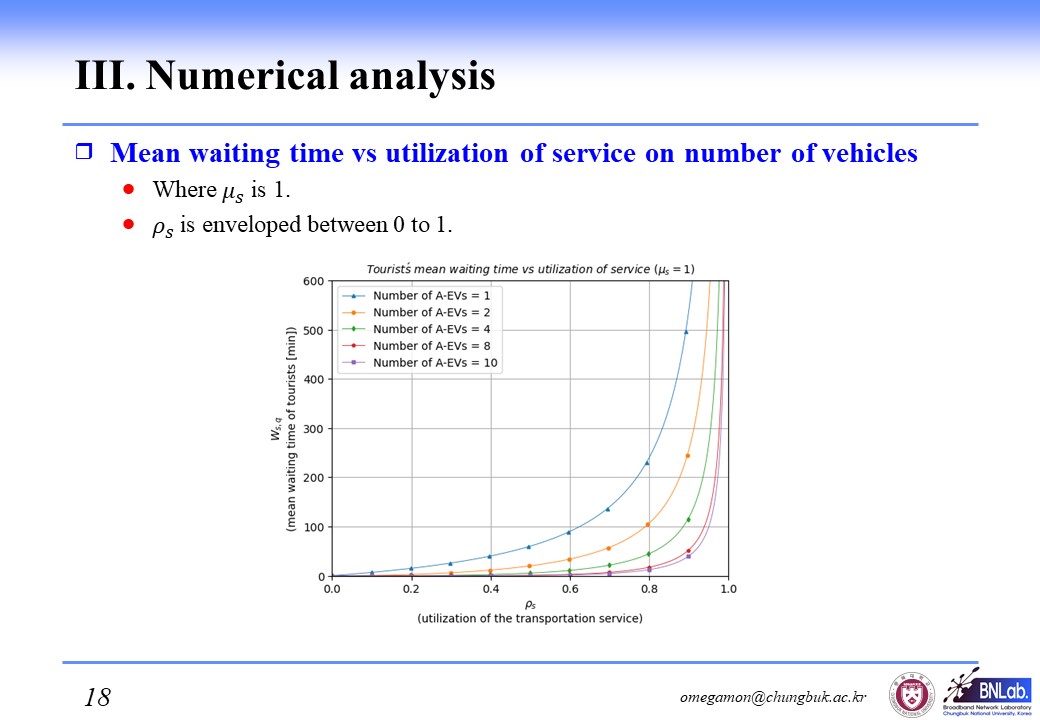
Relationship between mean waiting time of tourists and utilization of service on static service rate is presented in this figure. The service rate is set as 1 and the arrival rate is set suitably according to the number of autonomous electric vehicles to envelope the utilization in between 0 to 1. These curves refer that mean waiting time increase exponentially with growing of utilization. Moreover, the mean waiting time can be reduced dramatically by arranging more autonomous electric vehicles. Also, when utilization approaches to 1, it proliferates. On analysis this graph in the frame of tourist spot operator's context, service provider can know minimum number of autonomous electric vehicles to operate transportation service while satisfying customers queueing time. Further, the service provider could obtain extra number of autonomous electric vehicles in order to cope peak arrival rate.
|
 IEEE/ICACT20220062 Slide.18
[Big Slide]