 |
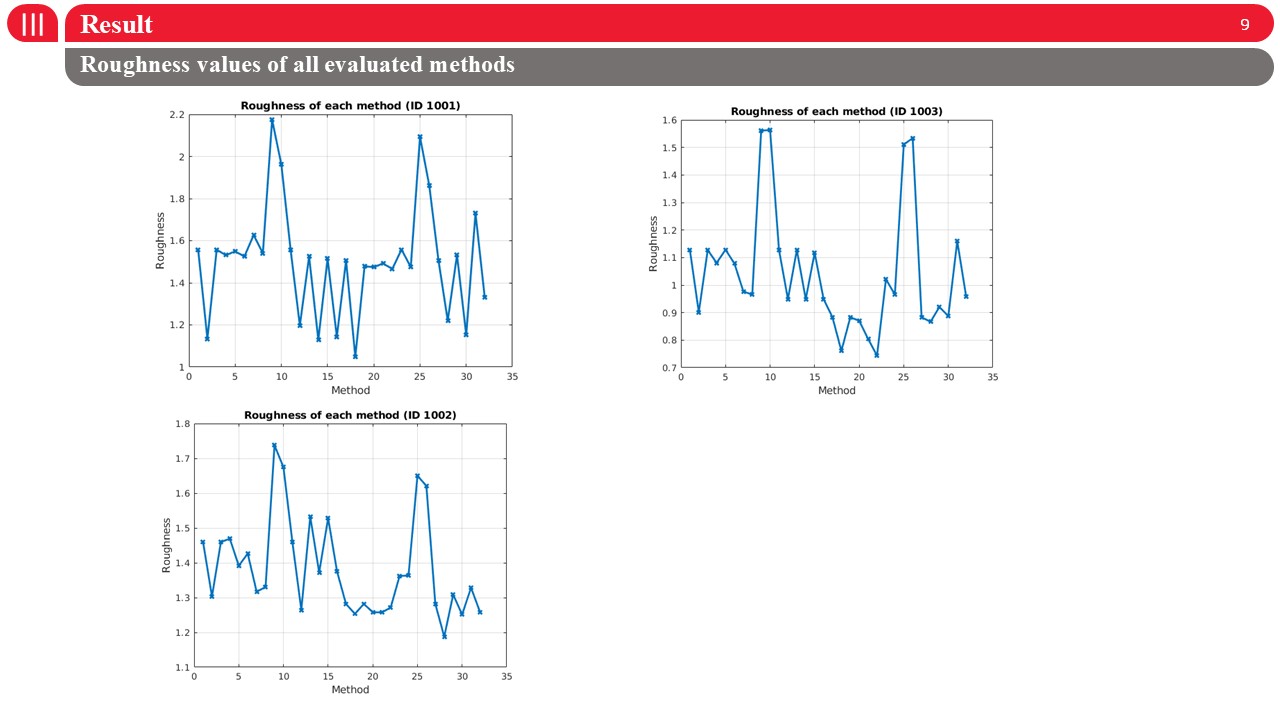
This figure shows the roughness values obtained by all evaluated methods for three different targets.Each point corresponds to one of the 32 configurations, where lower values indicate smoother and more stable elevation trajectories.We observe that roughness varies significantly across methods, confirming that the choice of plot selection and representation strategy strongly affects trajectory stability.The best-performing configurations consistently achieve lower roughness across all targets, while several methods exhibit large fluctuations, indicating unstable elevation estimation.These results further support the robustness of the proposed approach. |
 IEEE/ICACT20260278 Slide.18
[Big Slide]