 |
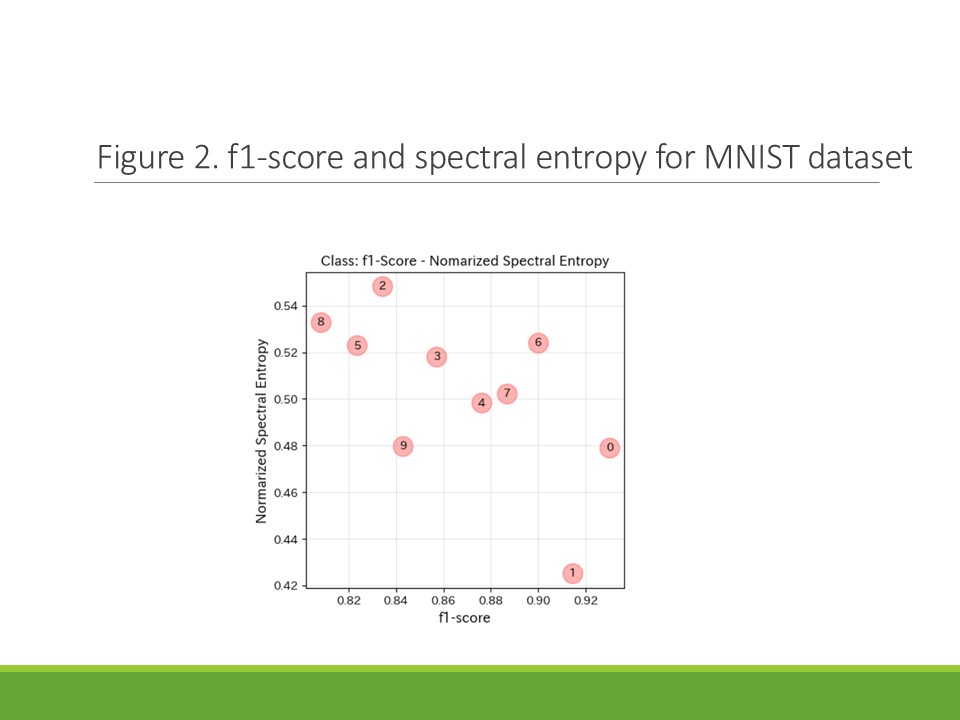
Figure 2 shows a numerical example for f1-score and normalized spectral entropy.
This figure is for the MNIST dataset mentioned above.
The horizontal axis is the f1-score, and the vertical axis is the spectral entropy.
The numbers in the circles correspond to single digits (e.g., 1, 2, 3, ¡¦ ).
What can be seen from this figure is that
for 1 and 0, which have high f1-scores, and the entropy value is low, that indicates stable classification.
On the other hand, for 5 and 8, the entropy is high and the f1-score is low.
This case indicates that many feature directions are required to represent these complex characters, which increases the entropy and makes recognition difficult.
|
 IEEE/ICACT20260379 Slide.18
[Big Slide]