 |
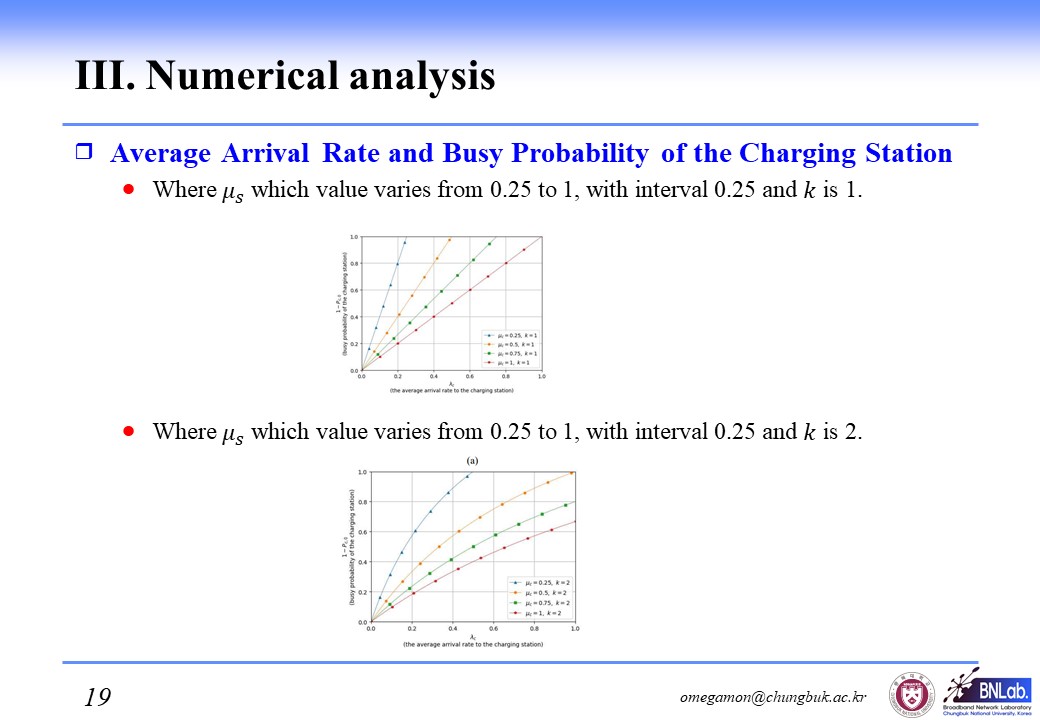
these show the busy probability that A-EVs exist at the charging station versus various arrival rates which in different charging service rates and different number of charging poles. On the curve of the charging station's service rate at 0.25 in above graph, the charging station is busy with an 80% chance at 0.2 arrival rate to the charging station with a charging pole. By the way in below graph, an additional charging pole can reduce this probability to 60% with the same arrival rate and same service rate. The better charging performance increases idle state probability which means no A-EVs in the charging station. A high charging rate may reduce investment cost of A-EV by enhancing service availability of A-EVs which provide tourist transportation service.
|
 IEEE/ICACT20220062 Slide.19
[Big Slide]