 IEEE/ICACT20220153 Slide.19
[Big Slide]
Oral Presentation
| Virual Oral Presentation Slide by Slide |
|
IEEE/ICACT20220153 Slide.19
[Big Slide]
| Oral Presentation |
|
|
|
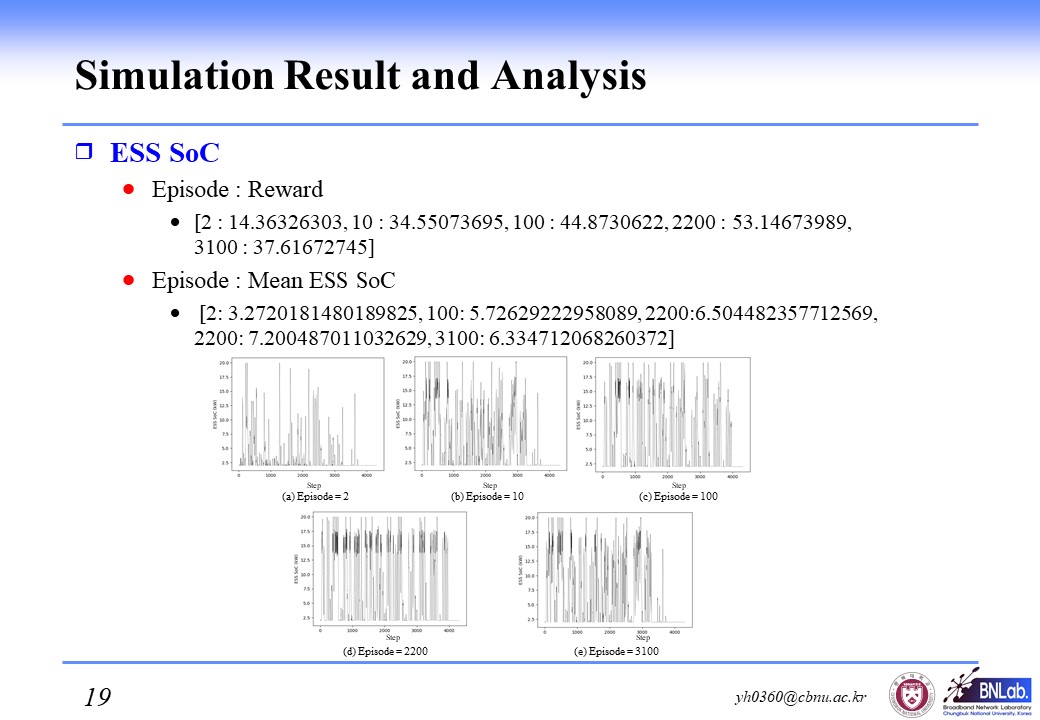
The following is a graph of ESS SoC. Each graph is output for each episode, and the unit is a step. Reward is the maximum at episode 2200 and the average ESS SoC is also the maximum. The neighboring episode with a low reward value in the section repeated after 2200 confirmed in the previous figure is 3100. In this case, the average ESS SoC also decreases. | |
| [Go to Next Slide] |