 IEEE/ICACT20210173 Slide.20
[Big Slide]
Oral Presentation
| Virual Oral Presentation Slide by Slide |
|
IEEE/ICACT20210173 Slide.20
[Big Slide]
| Oral Presentation |
|
|
|
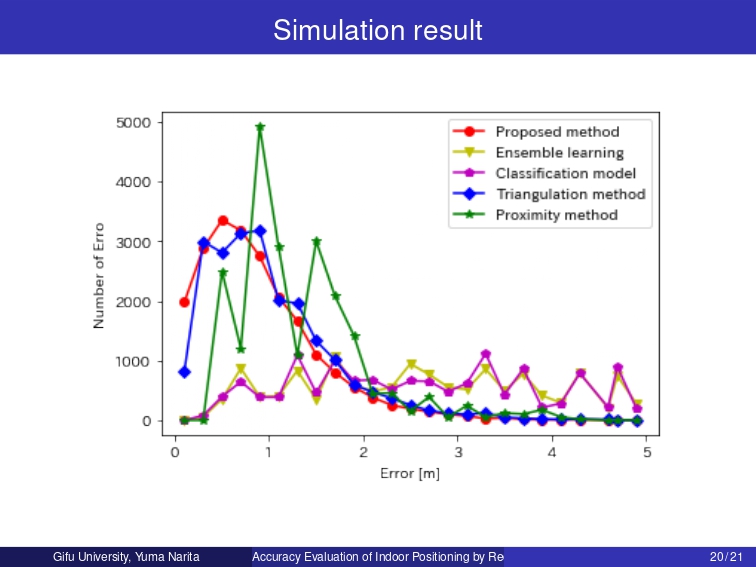
The graph compares the most accurate output of the proposed method and the existing method. The red line shows the most accurate binary-converted data using regression analysis. The blue line shows the Triangulation method, and the green line shows the Proximity method. As can be seen from the graph, in regression analysis, the number of errors with a small mistake is large, and the number decreases when the error exceeds 1m. | |
| [Go to Next Slide] |