 |
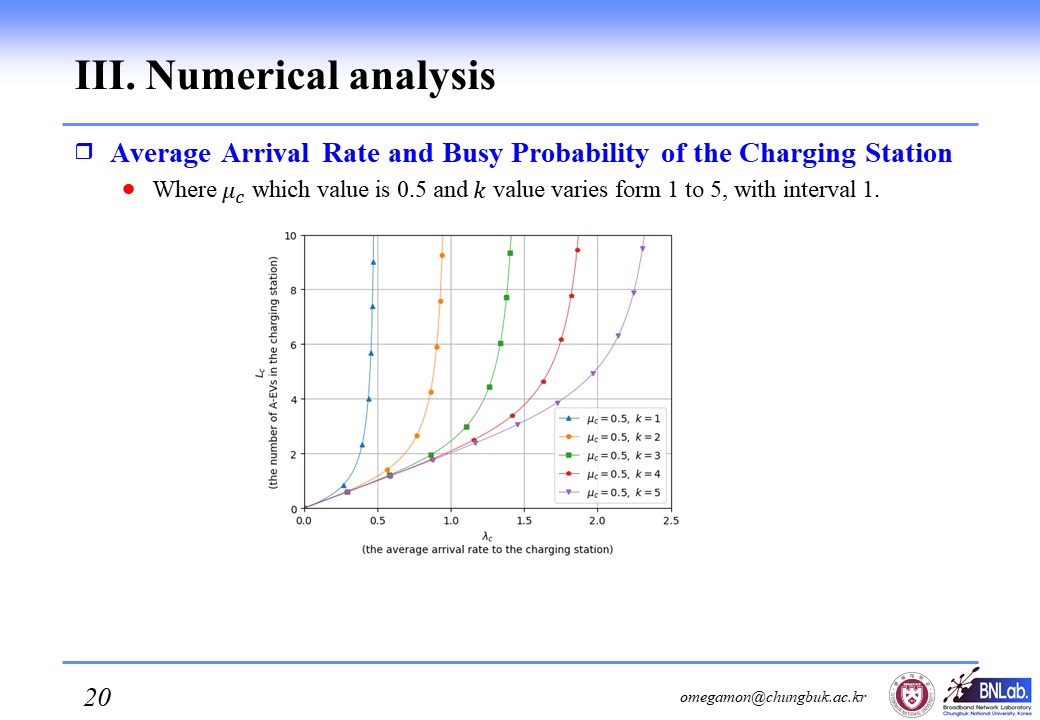
this graph depicts the relationship between charging station¡¯s arrival rate and the number of A-EVs in various number of charging poles with same charging rate. The arrival rate of each curve is enveloped in a range of below utilization 1 about given parameters. If A-EVs request charging frequently, the number of A-EVs in the charging station increase exponentially. When utilization of charging station closes to 1, almost every A-EV will be in the charging station. In summary, we can know that it is necessary to consider characteristic of tourist spot¡¯s charging station to reserve the number of A-EVs for providing tourist transportation service within tourist¡¯s waiting time threshold.
|
 IEEE/ICACT20220062 Slide.20
[Big Slide]