 IEEE/ICACT20240438 Slide.20
[Big Slide]
Oral Presentation
| Virual Oral Presentation Slide by Slide |
|
IEEE/ICACT20240438 Slide.20
[Big Slide]
| Oral Presentation |
|
|
|
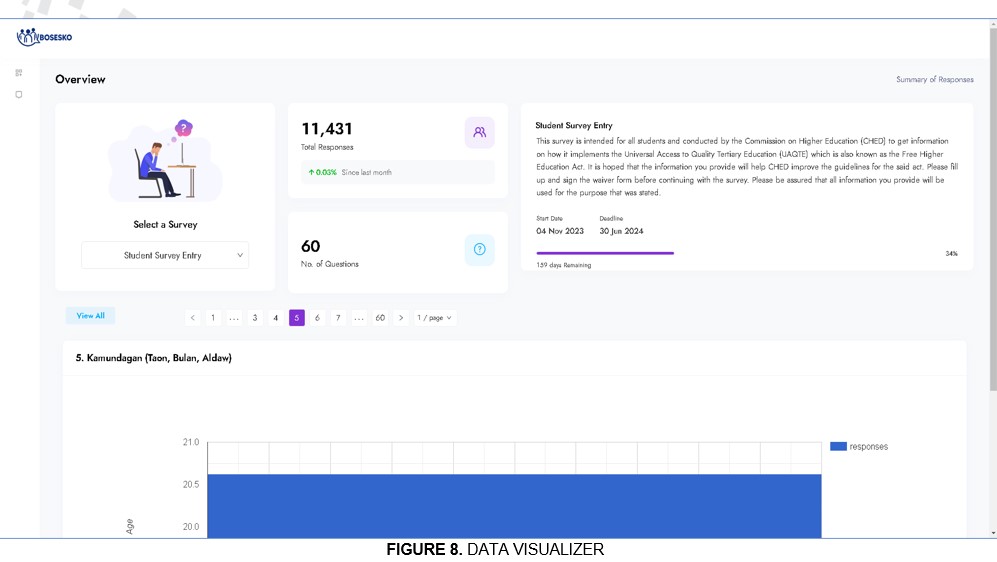
The Data Visualizer (Figure 8) is a report-generation tool that creates data visualization of survey responses. It displays a storyboard, charts, graphs, and other visual representations. | |
| [Go to Next Slide] |