 |
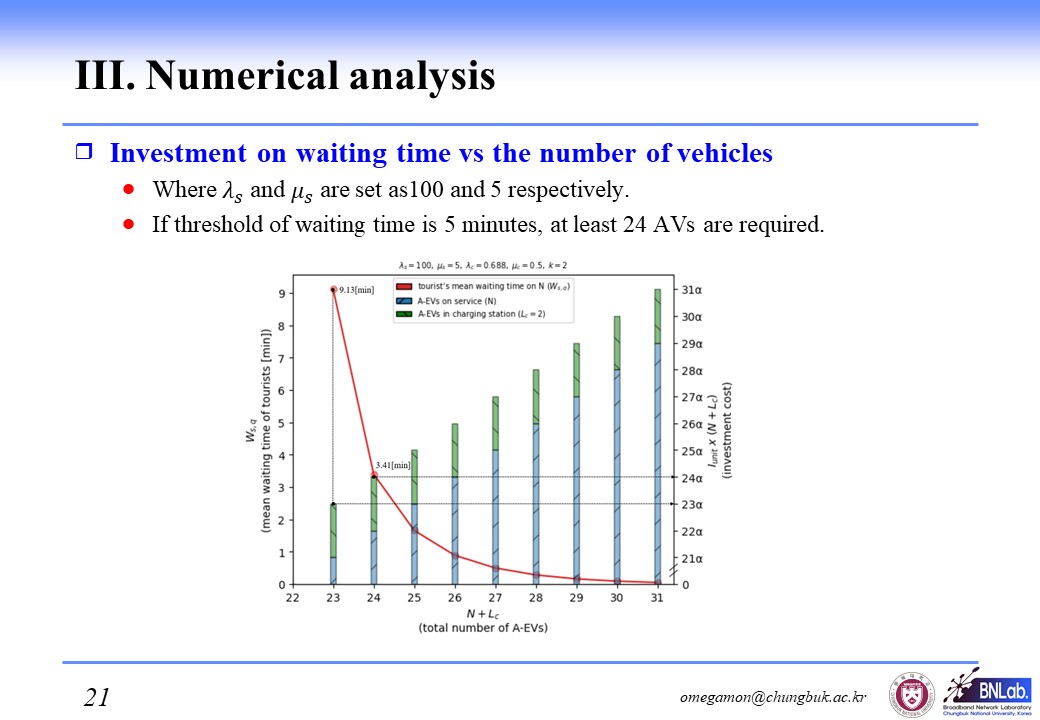
This graph indicates investment cost obtained by multiplying A-EV¡¯s unit investment cost by number of A-EVs. It's average tourist¡¯s arrival rate and average A-EV¡¯s service rate are specified as 100 requests per hour and 5 services per hour respectively. And, according to a curve which k is 2 in the figure 6, its charging station¡¯s arrival rate is set as 0.688. Therefore, the number of A-EVs in the charging station is determined as 2. In this result, if tour operators want to provide transportation service under average waiting time of 5 minutes, they need to have 24 A-EVs at least. When the unit price of A-EV is unit I , their investment cost is calculated as multiplication unit I by 24.
|
 IEEE/ICACT20220062 Slide.21
[Big Slide]