 |
Lets explain the data in a little more detail.
For example, Figure 3 is a scatter plot of two indicators for a particular fiscal year.
The horizontal axis represents the debt composition ratio, which represents flow, and the vertical axis represents the subsidy dependence ratio, which represents stock.
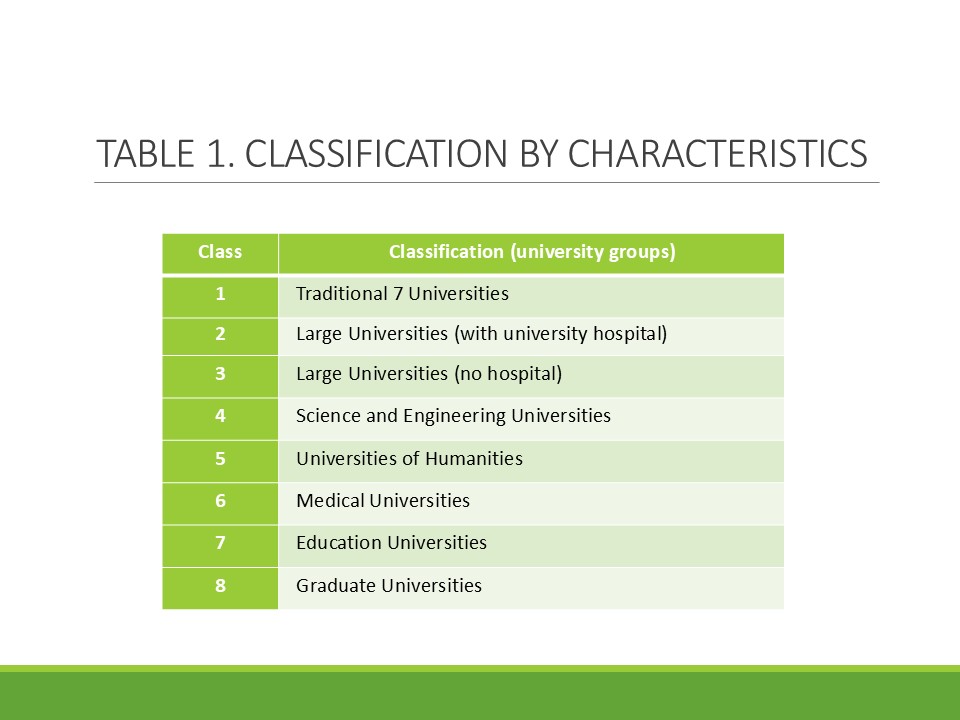
The color of each point corresponds to the eight university classes or groups.
As can be seen from this figure, universities from the same class tend to be located relatively close to each other, and similar classes tend to be located close.
However, there are also cases where this does not necessarily follow this trend.
|
 IEEE/ICACT20260379 Slide.22
[Big Slide]