 IEEE/ICACT20240049 Slide.25
[Big Slide]
Oral Presentation
| Virual Oral Presentation Slide by Slide |
|
IEEE/ICACT20240049 Slide.25
[Big Slide]
| Oral Presentation |
|
|
|
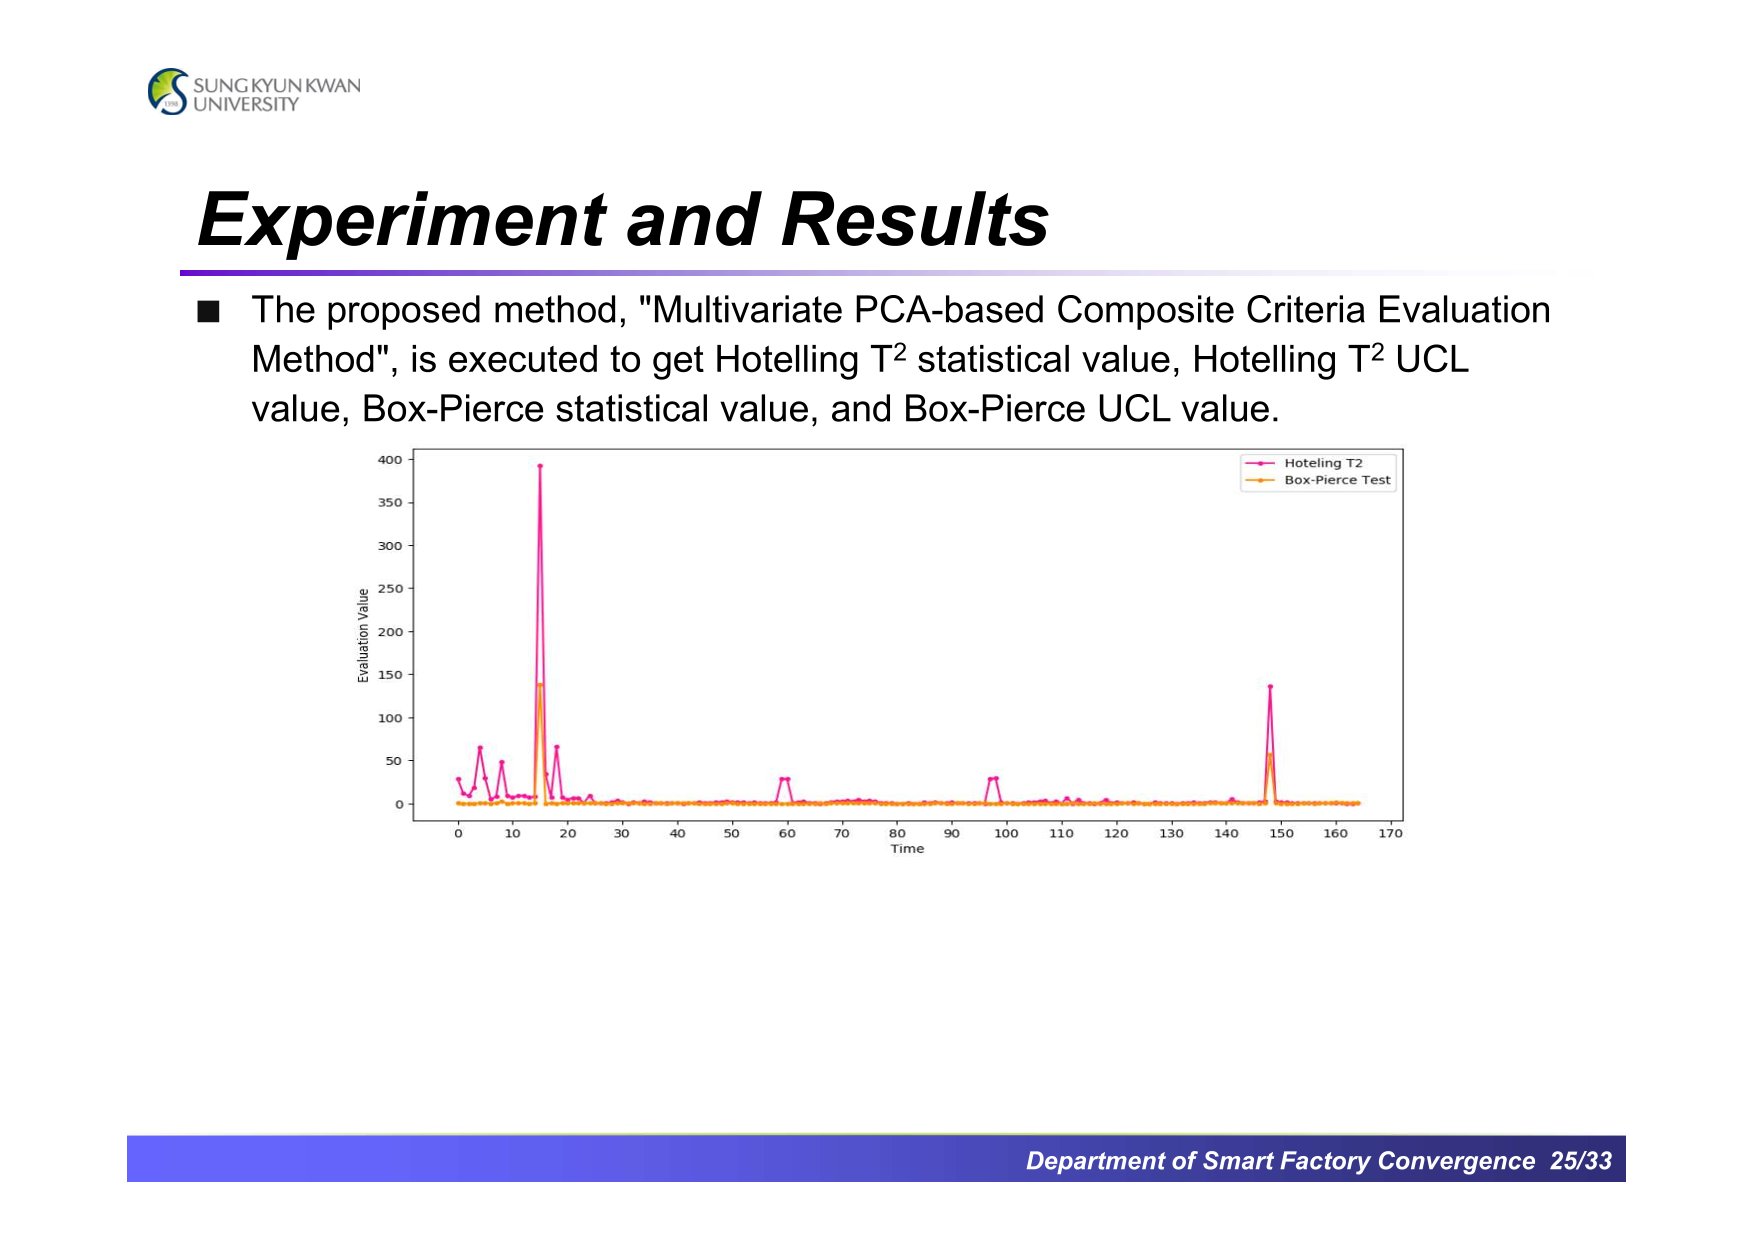
After normalization, the data was analyzed with the proposed method. The results of Hotelling's T2 Control chart and Box-Pierce test were shown. We can find that the results of Hotelling's T2 control chart are more sensitive than the Box-Pierce test. | |
| [Go to Next Slide] |