 IEEE/ICACT20260214 Slide.25
[Big Slide]
[YouTube] Oral Presentation
| Virual Oral Presentation Slide by Slide |
|
IEEE/ICACT20260214 Slide.25
[Big Slide]
[YouTube] |
Oral Presentation |
|
|
|
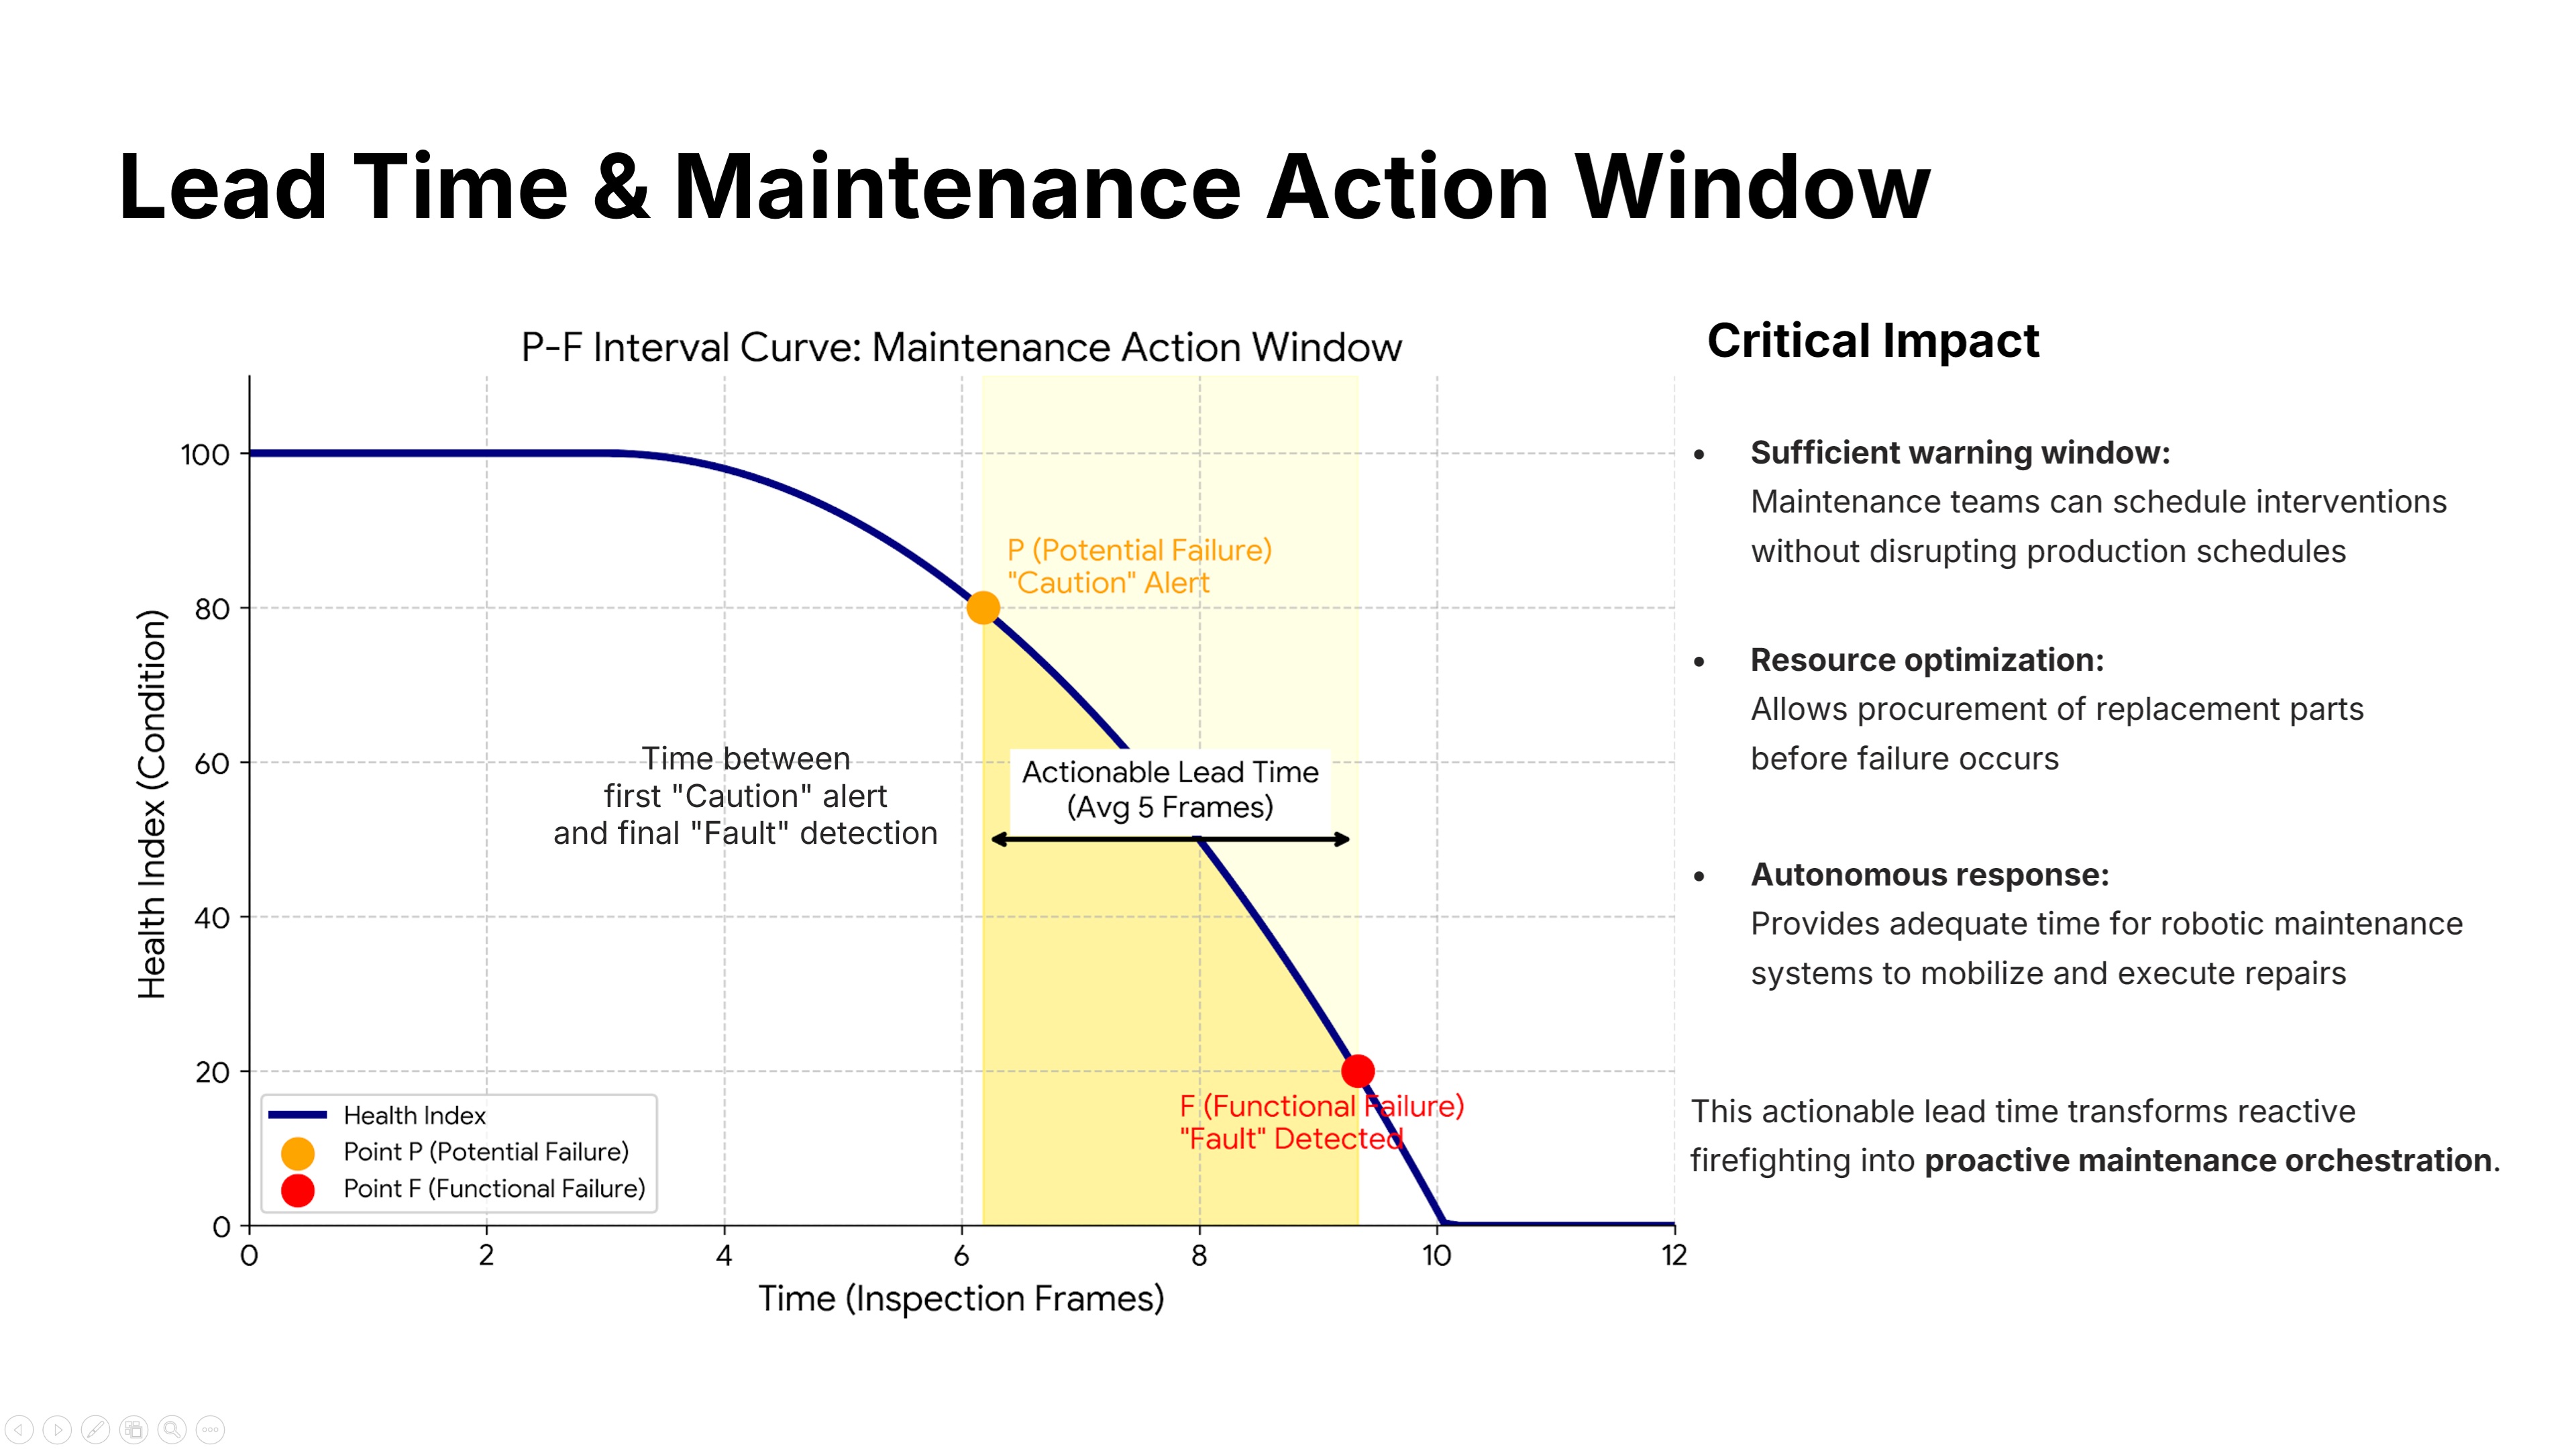
This is perhaps the most important slide for operations managers. The P-F Interval Curve shows the critical time between the first Caution alert, and the final Fault detection. We secured an average Lead Time of 5 Frames. This gives the maintenance team a sufficient Action Window to order parts and schedule repairs, well before a functional failure occurs. This transforms maintenance from reactive firefighting, into proactive, planned orchestration. | |
| [Go to Next Slide] |