 |
In this paper, we consider 33 types of financial indicators (data items) . We used the data covering eight years from fiscal year 2012 to fiscal year 2019.
Since this is a research paper, the names of the universities have been anonymized.
We selected several financial indicators from the 33 available.
Below, we refer to these indicators as data items.
We used six years of data from 2012 to 2017 as training data and two years of data from 2018 and 2019 as test data, and performed classification using multiclass logistic regression.
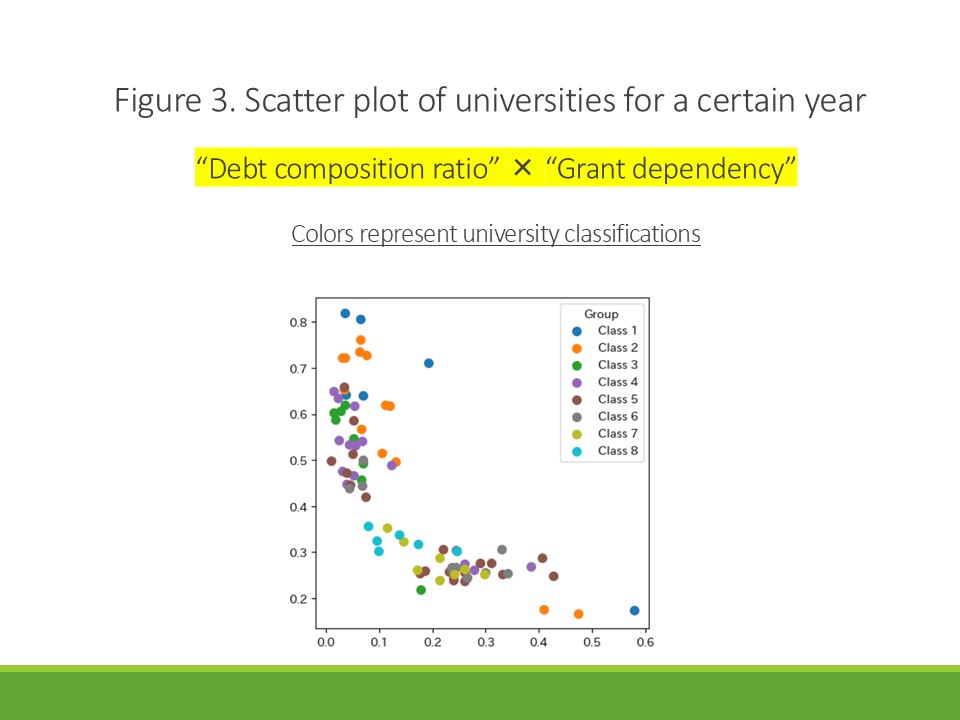
Scatter plot of universities for a certain year �� ¡°Debt composition ratio¡± ¡¿ ¡°Grant dependency¡±�� Colors represent university classifications |
 IEEE/ICACT20260379 Slide.25
[Big Slide]