 |
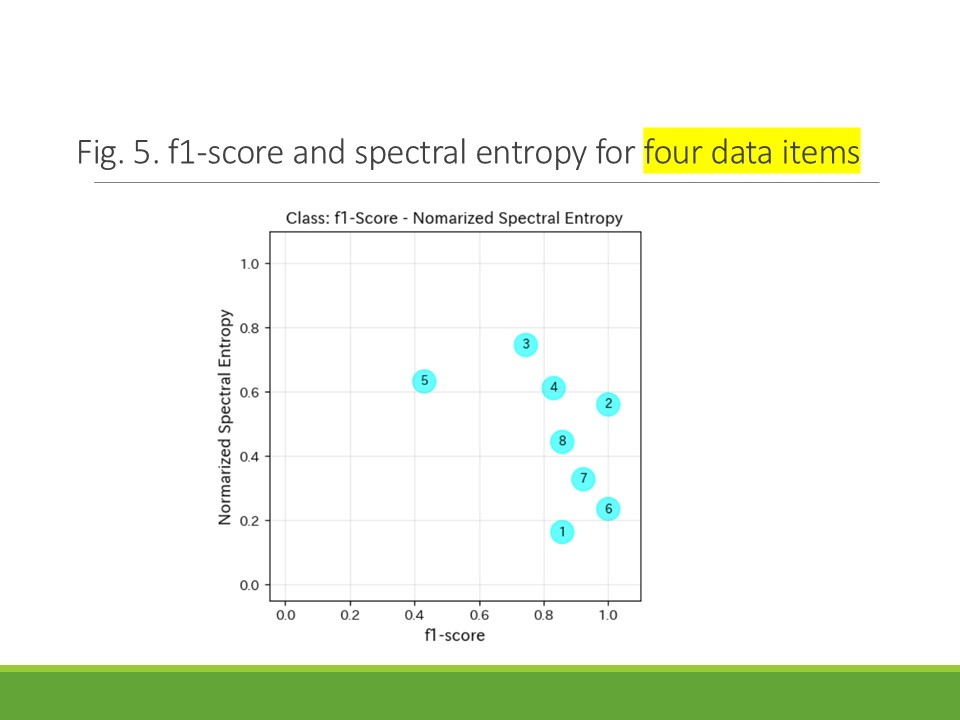
(2) Selection of four indicators (Fig. 5)
Indicators: Debt composition ratio, Grant dependency ratio, Education expenses ratio, Research expenses ratio.
Normalized entropy of the covariance matrix 0.859.
Accuracy: 0.889.
As the number of selected items (indicators) increased, the discrimination performance improved and accuracy increased. Regarding entropy, 1, 6 and 7 are low, and it is thought that there is a direction that clearly expresses each characteristic and so stable classified.
Class 1, 6 and 7, shown in the bottom right of the figure, are considered to be easier to discriminate because high f1-score and low entropy.
The f1-score for class 5 tends to be significantly lower (outlier).
This is likely due to the fact that class 5 is the class of humanities, and there is considerable variety in each university.
|
 IEEE/ICACT20260379 Slide.29
[Big Slide]