 |
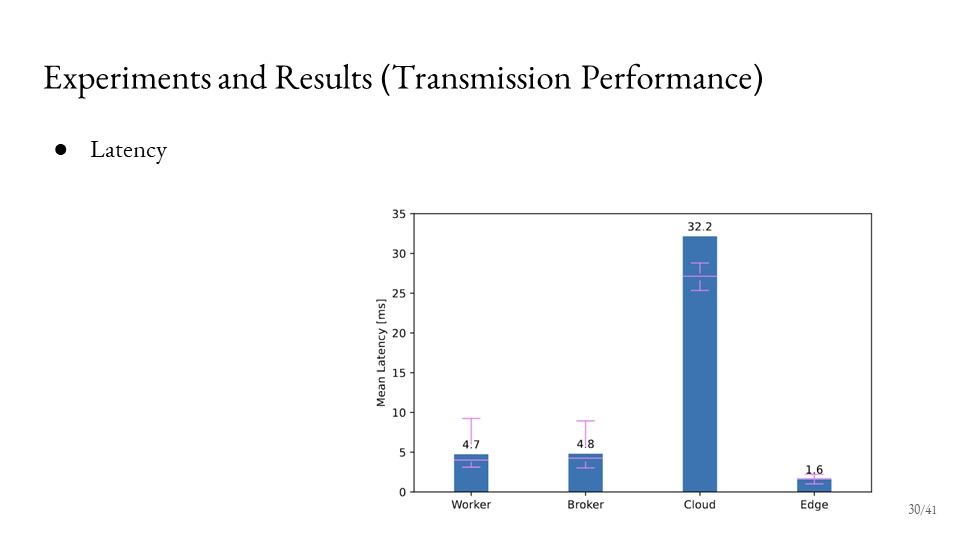
The figure gives the mean latency for different computing devices. The data shows that the cloud node had the highest mean latency at 32.2 ms due to its multi-hop connection and longer data travel distances. In contrast, the edge device demonstrates the lowest mean latency at 1.6 ms because the data source also performs as a computational unit. The worker and broker nodes show mean latencies of 4.7 and 4.8 ms respectively. These results show the potential of edge device and fog computing architecture to significantly reduce latency, making them more suitable for real-time emotion recognition applications that require swift and responsive data processing.
|
 IEEE/ICACT20250190 Slide.30
[Big Slide]