 IEEE/ICACT20250190 Slide.32
[Big Slide]
Oral Presentation
| Virual Oral Presentation Slide by Slide |
|
IEEE/ICACT20250190 Slide.32
[Big Slide]
| Oral Presentation |
|
|
|
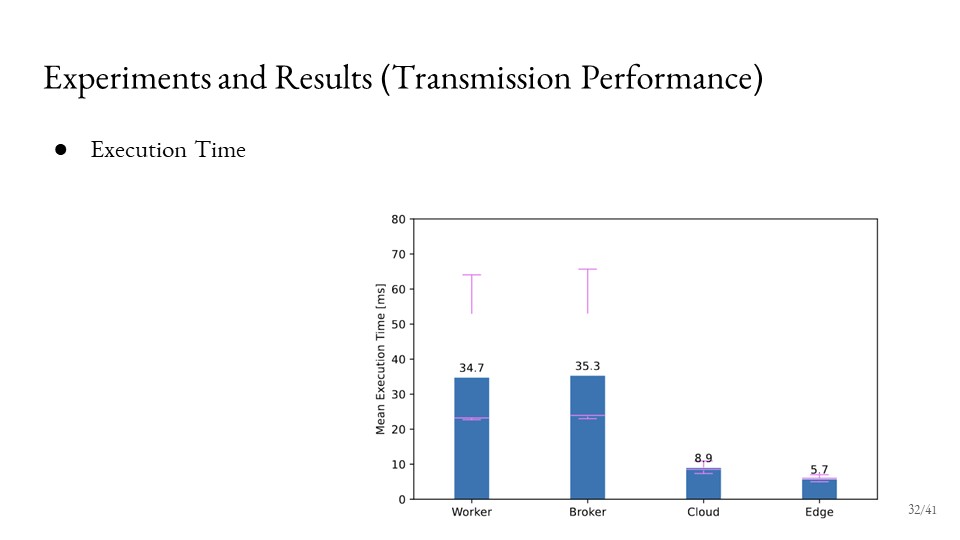
The mean execution time results for various computing architectures are displayed in the figure. As expected, the worker and broker nodes exhibit similar and the highest mean execution times of 34.7 ms and 35.3 ms, respectively because they have the same processor power. On the other hand, the cloud and edge nodes show lower mean execution times, with the cloud node at 8.9 ms and the edge node at 5.7 ms as they have more powerful processors. | |
| [Go to Next Slide] |