 ICACT20210173 Slide.24
[Big slide for presentation] |
Chrome Text-to-Speach Click!! |
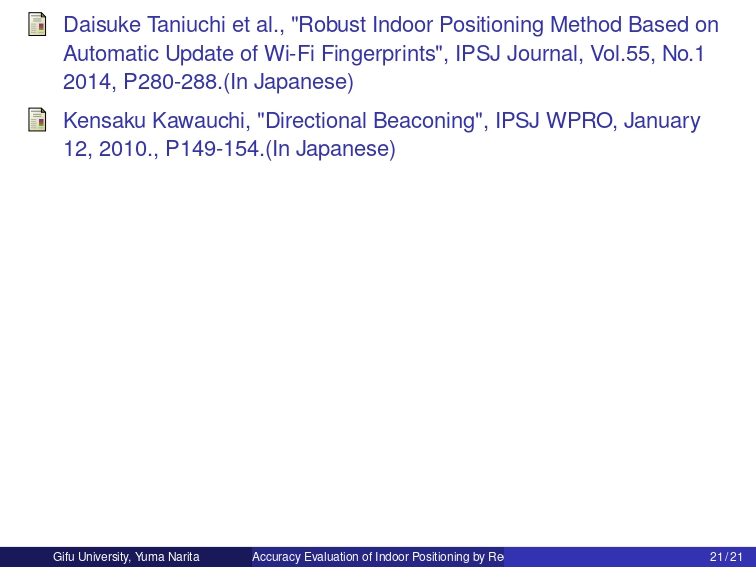 |
These are references.
Thank you for listening.
|
|
ICACT20210173 Slide.23
[Big slide for presentation]
|
Chrome Text-to-Speach Click!! |
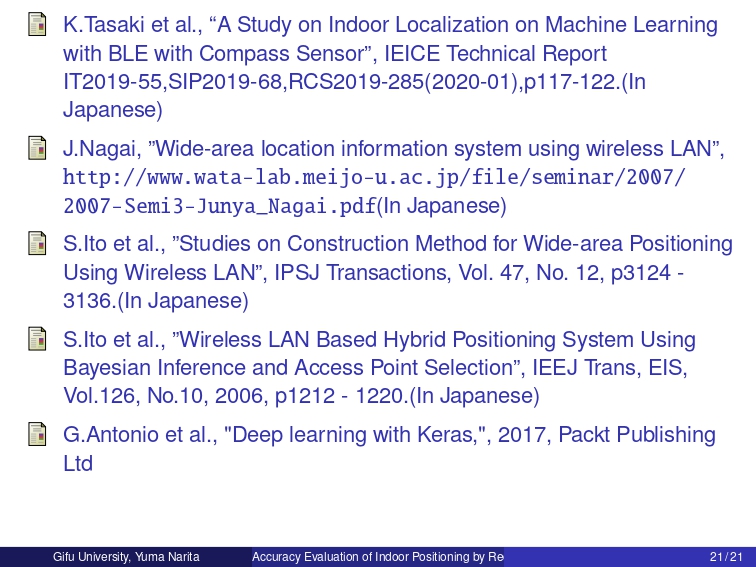 |
These are references.
|
|
ICACT20210173 Slide.22
[Big slide for presentation]
|
Chrome Text-to-Speach Click!! |
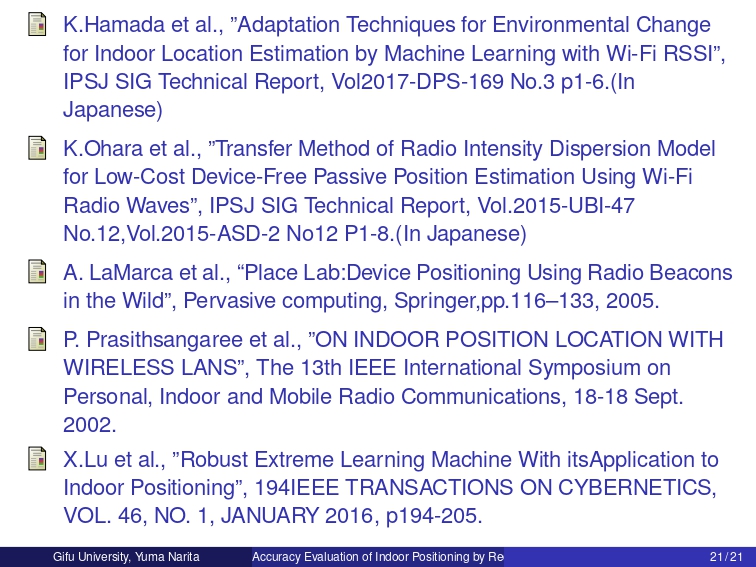 |
These are references.
|
|
ICACT20210173 Slide.21
[Big slide for presentation]
|
Chrome Text-to-Speach Click!! |
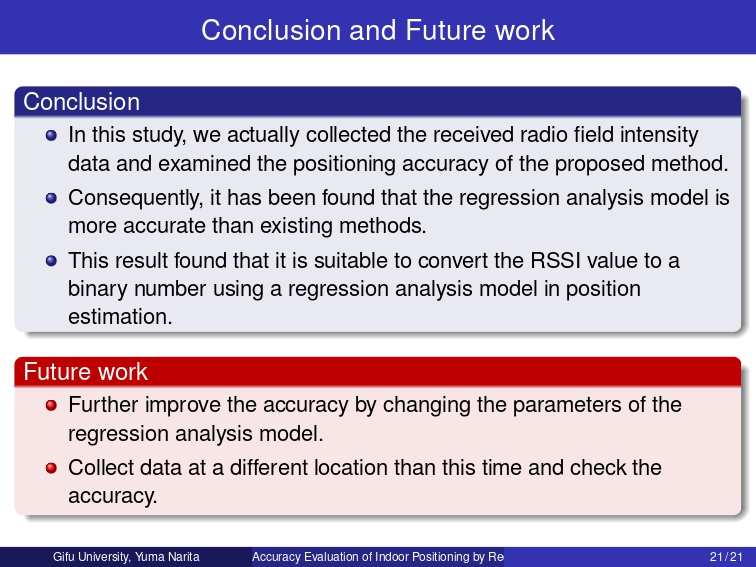 |
Finally, I will talk about the Conclusion and Future Work.
In this study, we collected the received radio field intensity data and examined the positioning accuracy of the proposed method.
Consequently, it has been found that the regression analysis model is more accurate than existing methods.
This result found that it is suitable to convert the RSSI value to a binary number using a regression analysis model in position estimation.
From now on, further improve the accuracy by changing the parameters of the regression analysis model.
Also, collect data at a different location than this time and check the accuracy.
|
|
ICACT20210173 Slide.20
[Big slide for presentation]
|
Chrome Text-to-Speach Click!! |
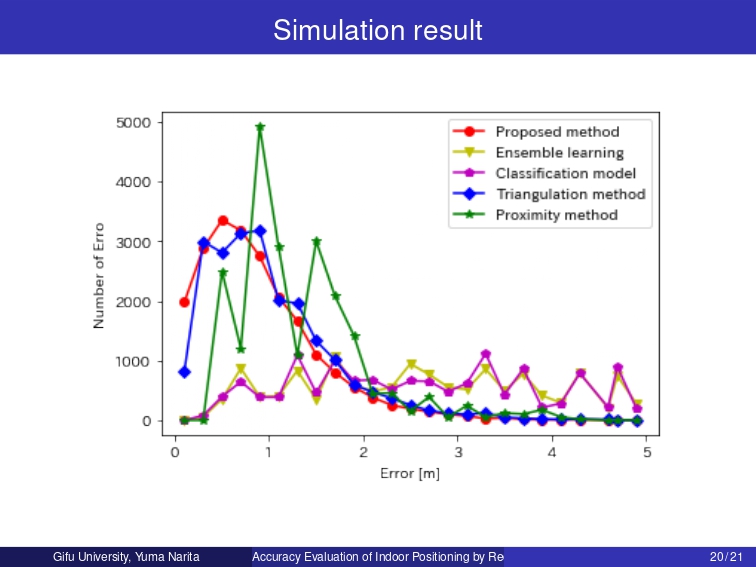 |
The graph compares the most accurate output of the proposed method and the existing method.
The red line shows the most accurate binary-converted data using regression analysis.
The blue line shows the Triangulation method, and the green line shows the Proximity method.
As can be seen from the graph, in regression analysis, the number of errors with a small mistake is large, and the number decreases when the error exceeds 1m.
|
|
ICACT20210173 Slide.19
[Big slide for presentation]
|
Chrome Text-to-Speach Click!! |
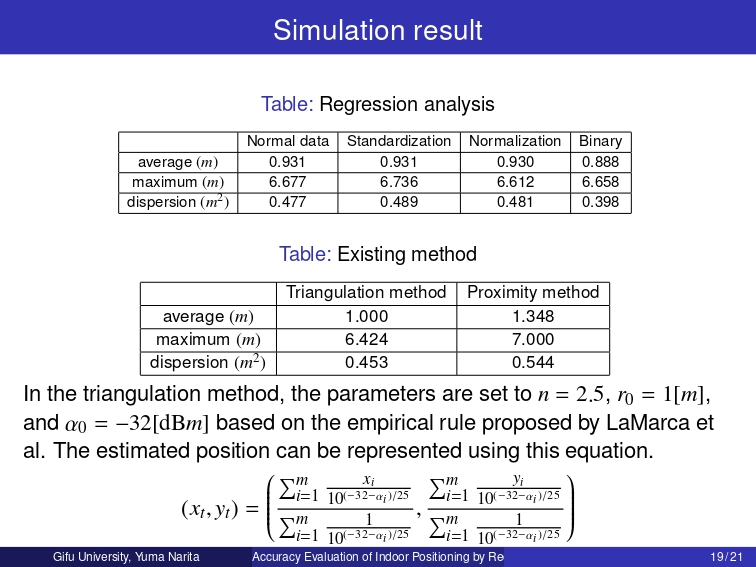 |
The table above shows the positioning accuracy obtained by combining the regression analysis models with and without data shaping.
The table below compares the position accuracy of the triangulation method with that of the proximity method.
In the triangulation method, the parameters are set to n = 2.5, r_{0} = 1 [m], and α_{0}= -32 [dBm] based on the empirical rule proposed by LaMarca et al.
The estimated position can be represented using this equation.
From these tables there, we can see that the accuracy of the classification model and ensemble learning is low, but the accuracy of the regression analysis is right.
The low accuracy of the classification model and ensemble learning is thought to be due to the inability to make accurate estimates if the data deviates from the teacher data.
The method that combines regression analysis and binary translation data is useful for position estimation because it has a smaller mean error and smaller variance than existing methods.
|
|
ICACT20210173 Slide.18
[Big slide for presentation]
|
Chrome Text-to-Speach Click!! |
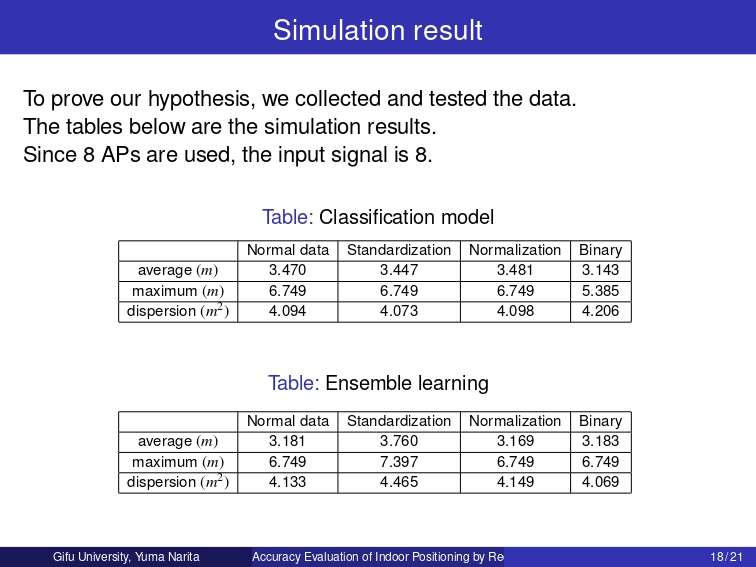 |
I'll talk about the simulation results.
To prove our hypothesis, we collected and tested the data.
The table above shows the results of training the classification model with and without data sharing.
The table below shows the results of training the ensemble learning with and without data sharing.
|
|
ICACT20210173 Slide.17
[Big slide for presentation]
|
Chrome Text-to-Speach Click!! |
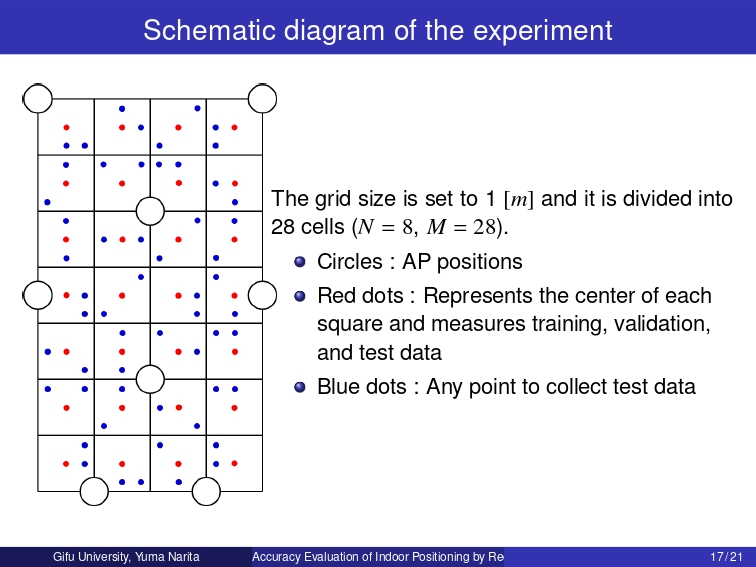 |
This figure is a schematic diagram of the experiment.
The grid size is set to 1 [m], and it is divided into 28 cells.
That is, N = 8, M = 28.
The circle indicates the location of the access point.
The red dots in the figure represent the center of each square and measure training, validation, and test data.
The blue dots represent arbitrary points, and only test data is measured.
|
|
ICACT20210173 Slide.16
[Big slide for presentation]
|
Chrome Text-to-Speach Click!! |
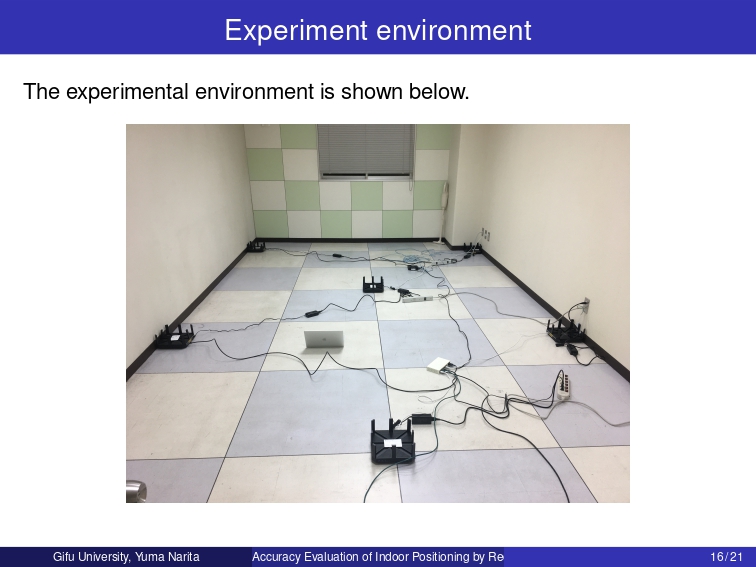 |
This photo is an experimental environment.
The receiving terminal receives the received signal strength indicator value and SSID from each access point.
The terminal receiving measures the strength of the received radio wave from the area's access point about once every 5 seconds.
Learning and estimation are performed using the RSSI value and SSID.
In this study, eight access points are installed in a room with dimensions of 7 ×3.765[m^2].
The APs use the TP-Link Archer C5400, and the RSSI values are measured using NetSpot, developed by Etwok.
|
|
ICACT20210173 Slide.15
[Big slide for presentation]
|
Chrome Text-to-Speach Click!! |
 |
Finally, regression analysis.
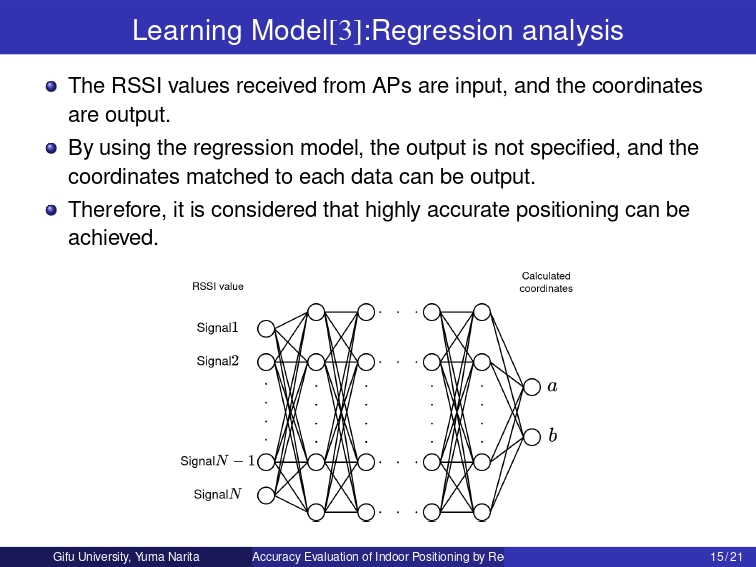
The position is predicted using the regression that indicates the real value from the given input, typical in supervised learning.
The received RSSI from APs are input, and the coordinates are output.
Using the regression model, the output is not specified, and the coordinates matched to each data can be output.
Therefore, it is considered that highly accurate positioning can be achieved.
The existing Fingerprint method has a problem that fine positioning is difficult, but by using the regression analysis model, highly accurate positioning can be expected regardless.
|
|
ICACT20210173 Slide.14
[Big slide for presentation]
|
Chrome Text-to-Speach Click!! |
 |
Next, the ensemble learning.
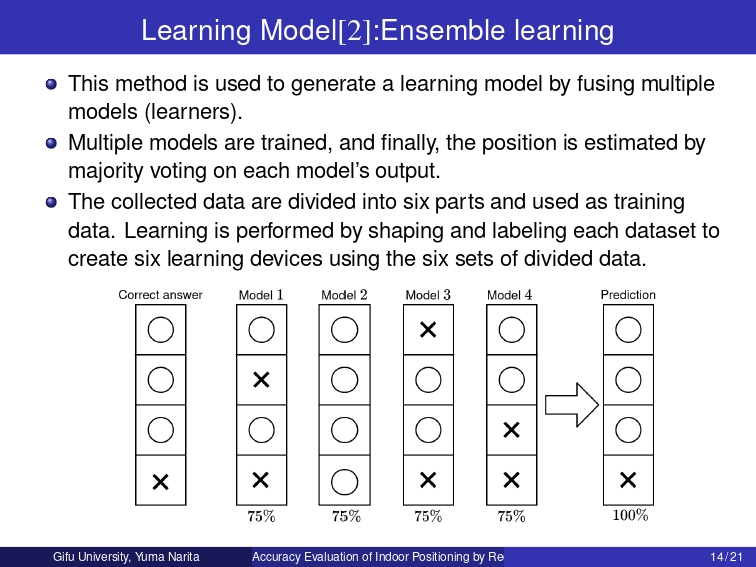
This method is used to generate a learning model by fusing multiple models.
Multiple models are trained, and finally, the position is estimated by the majority voting on each model's output.
In this study, the collected data will be divided into six parts and used as training data.
Learning is performed by shaping and labeling each dataset to create six learning devices using the six sets of divided data.
This figure is a schematic diagram of ensemble learning.
|
|
ICACT20210173 Slide.13
[Big slide for presentation]
|
Chrome Text-to-Speach Click!! |
 |
Let's talk about the learning model.
First, the classification model.
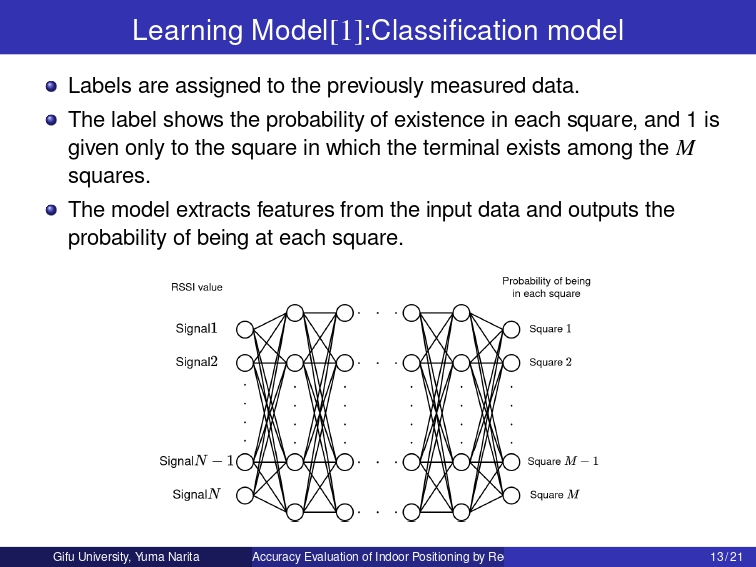
Labels are assigned to the previously measured data.
The label shows the probability of existence in each square, and one is given only to the court in which the terminal exists among the M squares.
As shown in this figure, the model extracts features from the input data and outputs the probabilities of being in each square.
|
|
ICACT20210173 Slide.12
[Big slide for presentation]
|
Chrome Text-to-Speach Click!! |
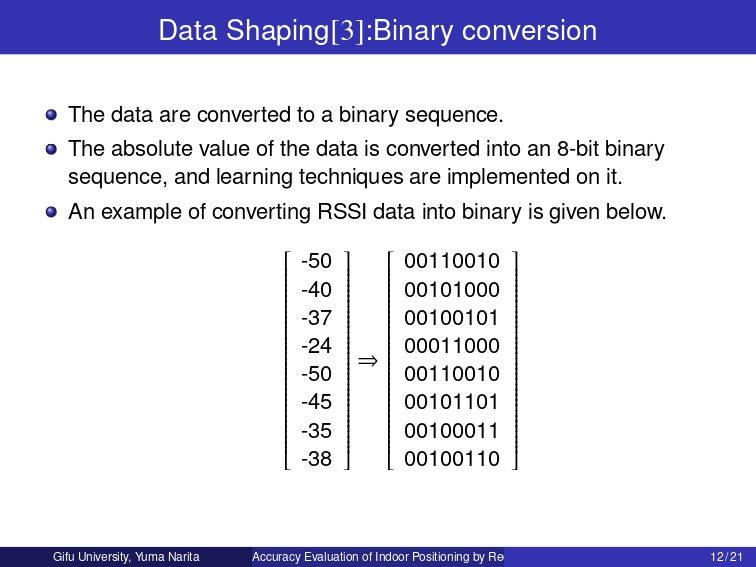 |
Next is binary conversion.
The data are converted to a binary sequence.
The absolute value of the data is converted into an 8-bit binary sequence, and learning techniques are implemented on it.
An example of converting RSSI data into binary is the given table.
When the RSSI value is obtained in this way, the absolute value of the data is taken and converted to a binary number.
|
|
ICACT20210173 Slide.11
[Big slide for presentation]
|
Chrome Text-to-Speach Click!! |
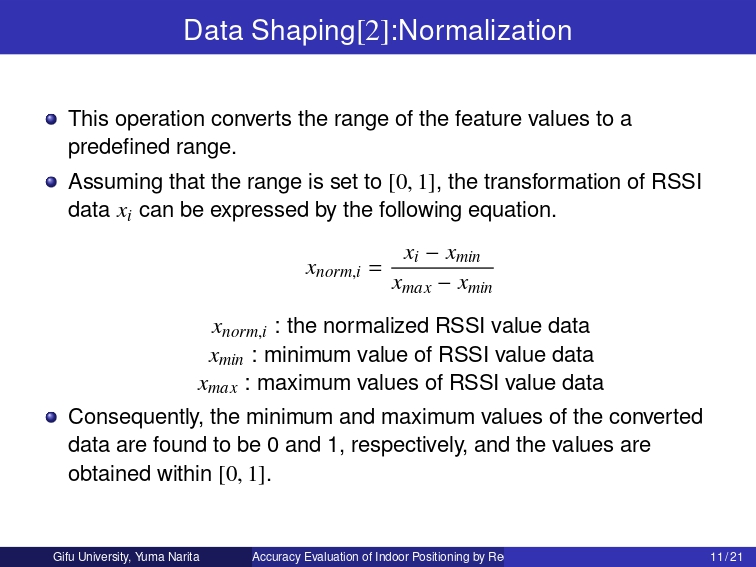 |
Next is normalization.
This operation converts the range of the feature values to a predefined range.
In this study, assuming that the range is set to [0,1], the transformation of x_{i} can be expressed by this equation.
x_{norm, i} denotes the normalized data, x_{min} and x_{max} represent the minimum and the maximum values of the dataset, respectively.
Consequently, the minimum and maximum values of the converted data are found to be 0 and 1, respectively, and the values are obtained within [0, 1].
|
|
ICACT20210173 Slide.10
[Big slide for presentation]
|
Chrome Text-to-Speach Click!! |
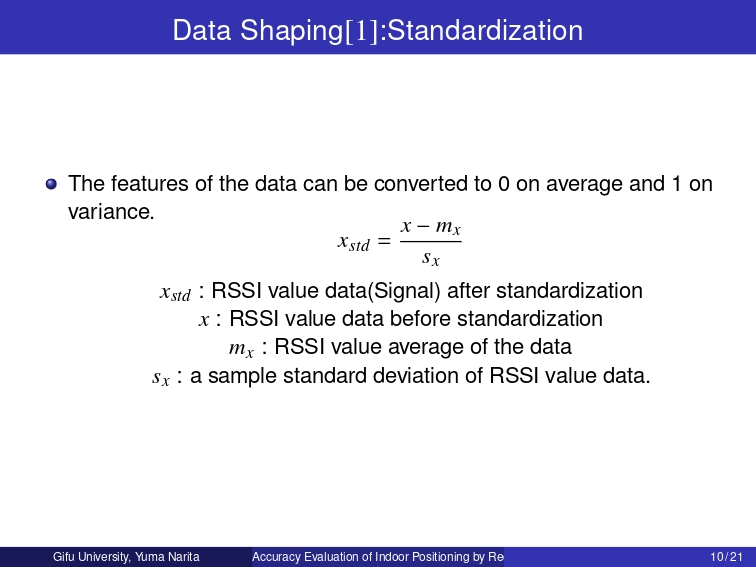 |
Let's talk about standardization.
Instead of using the original data, the data features are standardized.
Standardization is performed using this equation.
Using this equation, the features of the data can be converted to 0 on average and one on variance.
x_{std} denotes the data after standardization, x denotes the data before standardization, m_{x} represents the average of the data, and s_{x} denotes a sample standard deviation of the data.
|
|
ICACT20210173 Slide.09
[Big slide for presentation]
|
Chrome Text-to-Speach Click!! |
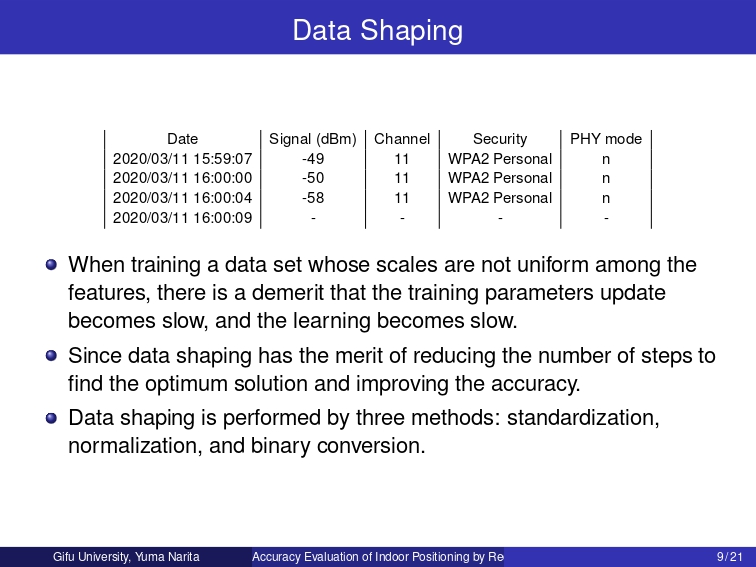 |
I'll talk about data shaping.
The collected data are shaped to ensure that the network model is easy to learn.
When training a data set whose scales are not uniform among the features, there is a demerit that the training parameters update becomes slow, and the learning becomes slow.
Since data shaping has the merit of reducing the number of steps to find the optimum solution and improving the accuracy.
In this study, there are three methods: standardization, normalization, and binary translation.
|
|
ICACT20210173 Slide.08
[Big slide for presentation]
|
Chrome Text-to-Speach Click!! |
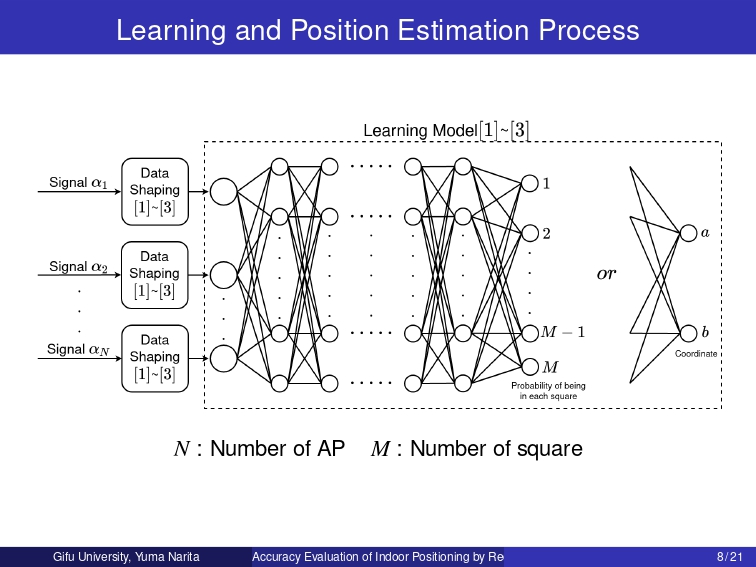 |
This figure shows the Learning and Position Estimating Process.
Data is formatted for the received RSSI value and used as input.
The model is trained using multiple learning methods.
The output changes depending on how the model is trained. One model outputs the probability of being in each square, and another model outputs the coordinates.
|
|
ICACT20210173 Slide.07
[Big slide for presentation]
|
Chrome Text-to-Speach Click!! |
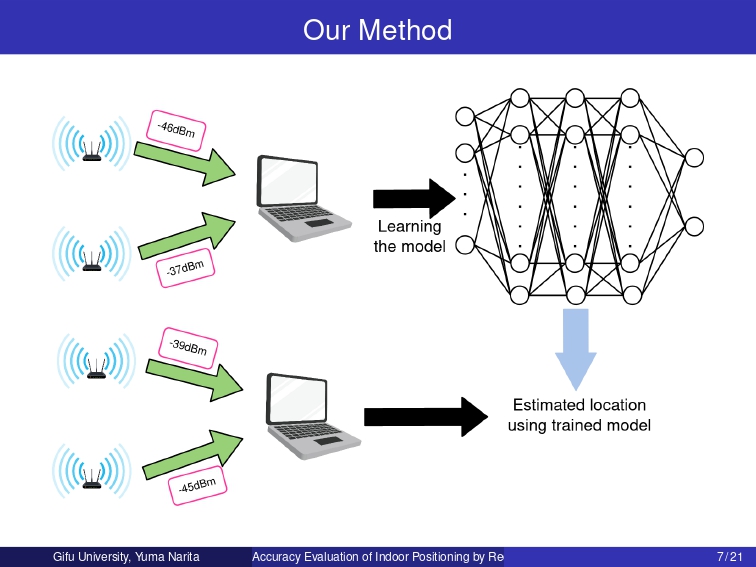 |
From here, I will talk about our positioning method.
The terminal receives the RSSI value and SSID from each access point.
In the model, the strength of the radio wave received from each AP is input, and the coordinates of each information are learned.
When new RSSI value data is received, the position is estimated by the trained model.
Learning and estimation are performed using the RSSI value, SSID, and coordinate.
|
|
ICACT20210173 Slide.06
[Big slide for presentation]
|
Chrome Text-to-Speach Click!! |
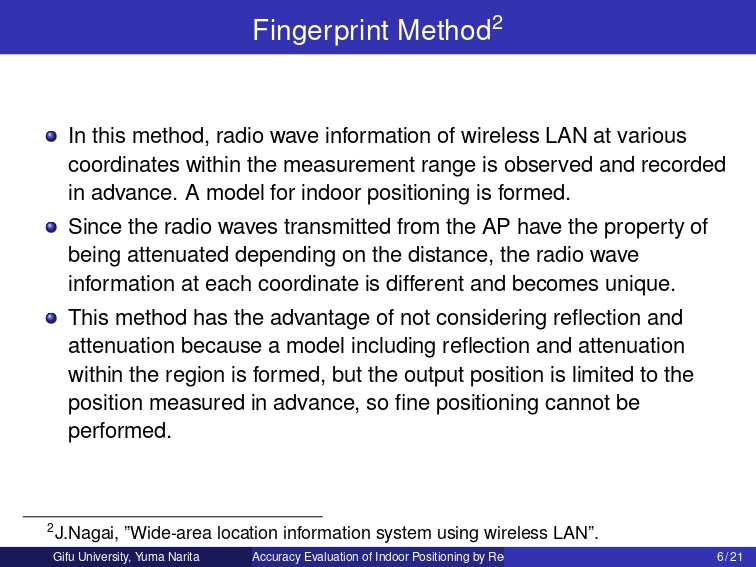 |
Next, let's talk about the Fingerprint method.
In this method, radio wave information of wireless LAN at various coordinates within the measurement range is observed and recorded in advance. A model for indoor positioning is formed.
The radio wave information is the received radio wave strength from each AP and the source AP's identification number.
Since the radio waves transmitted from the AP have the property of being attenuated depending on the distance, the radio wave information at each coordinate is different and becomes unique.
Therefore, when estimating the position, the positioning target terminal uses the radio wave information at the current location and compares it with the position estimation model to obtain the position information corresponding to the radio wave information measured at the current site.
This method finds and estimates the closest radio wave information among the position estimation models measured in advance.
Since a model, including reflection and attenuation in the region, is formed, it is an estimation method that does not consider reflection and attenuation.
This method has the advantage of not considering reflection and attenuation because a model including reflection and attenuation within the region is formed. Still, the output position is limited to the work, place measured in advance, so fine positioning cannot be performed.
|
|
ICACT20210173 Slide.05
[Big slide for presentation]
|
Chrome Text-to-Speach Click!! |
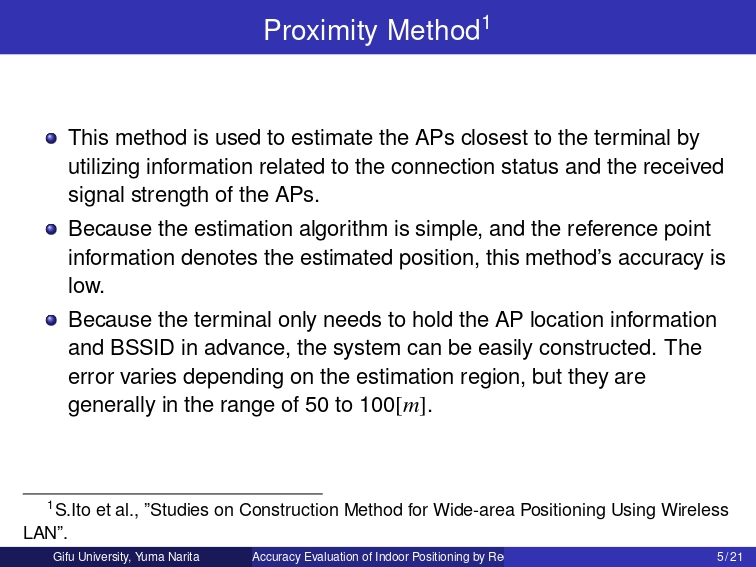 |
Next, let's talk about the Proximity method.
This method is used to estimate the APs closest to the terminal by utilizing information related to the connection status and received signal strength of the APs.
Because the estimation algorithm is simple, and the reference point information denotes the estimated position, this method's accuracy is low.
Because the terminal only needs to hold the AP location information and BSSID in advance, the system can be easily constructed. The error varies depending on the estimation region, but they are generally in the range of 50 to 100[m].
|
|
ICACT20210173 Slide.04
[Big slide for presentation]
|
Chrome Text-to-Speach Click!! |
 |
We will explain the existing method that uses the strength of the radio waves received from the access point.
First, let's talk about the Triangulation method.
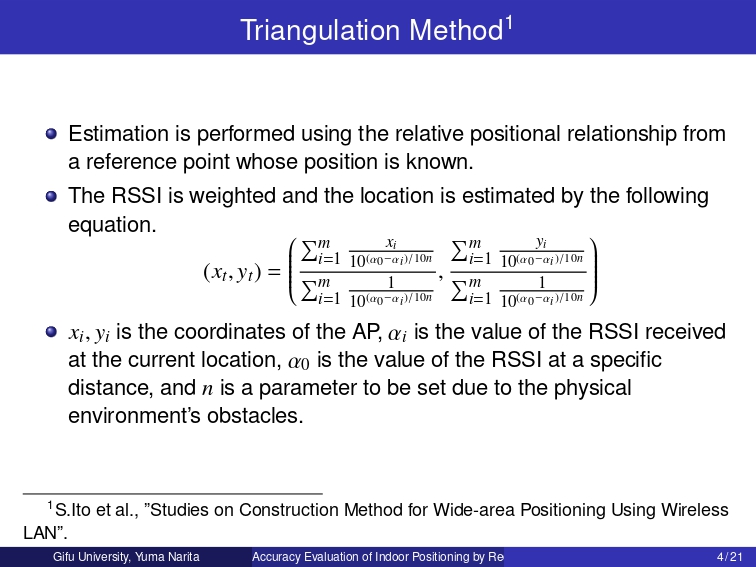
In this method, estimation is performed using the relative positional relationship from a reference point whose position is known.
The radio waves observed by the terminal are stronger because they are closer to the AP. Thus, if the AP information with the more vigorous received radio wave intensity is used, the positioning accuracy would be improved. Therefore, the RSSI is weighted, and the location is estimated by this equation.
Xi, Yi is the AP’s coordinates, αi is the value of the RSSI received at the current location, α0 is the value of the RSSI at a specific distance, and n is a parameter to be set due to the physical environment's obstacles.
|
|
ICACT20210173 Slide.03
[Big slide for presentation]
|
Chrome Text-to-Speach Click!! |
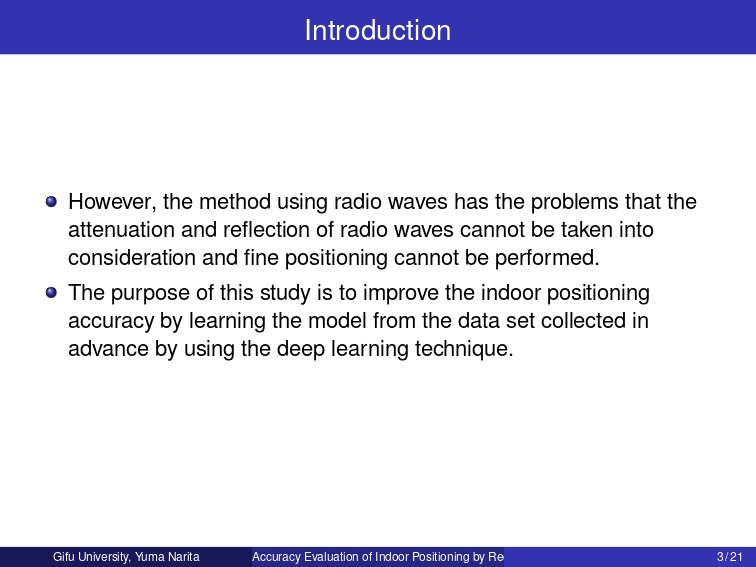 |
Although the Triangulation method and Proximity method are easy to use, it is difficult to consider the reflection and attenuation of radio waves in the estimated area. It is challenging to perform highly accurate positioning.
On the other hand, the Fingerprint method uses data observed in advance at any point in the estimation area, so it is possible to perform estimation considering reflection and attenuation.
However, with the Fingerprint method, the estimated position to be output is the point measured in advance, so detailed estimation is not possible.
The purpose of this study is to improve the indoor positioning accuracy by learning the model from the data set collected in advance by using the deep learning technique.
|
|
ICACT20210173 Slide.02
[Big slide for presentation]
|
Chrome Text-to-Speach Click!! |
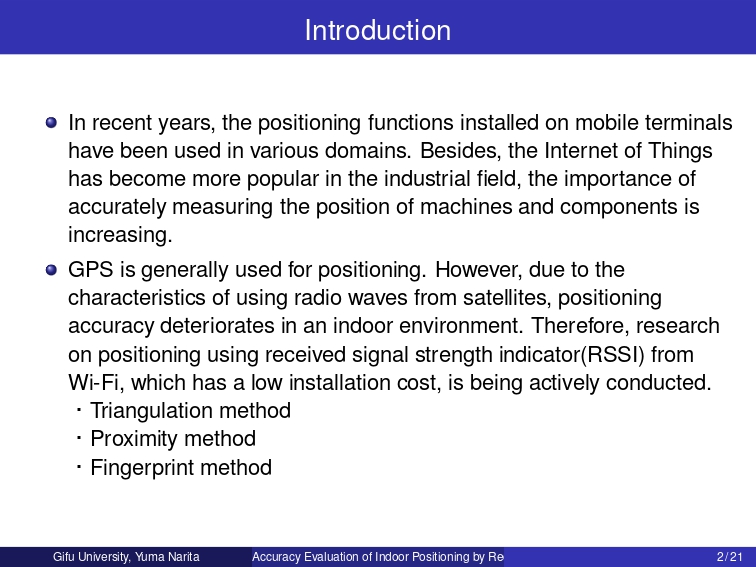 |
In recent years, the positioning functions installed on mobile terminals have been used in various domains, such as social media, games, and navigation systems. Besides, the Internet of Things has become more popular in the industrial field. With the increasing automation of factories, the importance of accurately measuring the position of machines and components is increasing.
The Global Positioning System (GPS), a global satellite positioning system, is used for positioning. However, because this system uses radio waves from satellites, its positioning accuracy decreases in indoor environments where the radio waves cannot reach efficiently.
Therefore, research on positioning systems with low installation costs using received signal strength(RSSI) such as Wi-Fi and Bluetooth is actively conducted.
For example, the Triangulation method, Proximity method, Fingerprint method.
|
|
ICACT20210173 Slide.01
[Big slide for presentation]
|
Chrome Text-to-Speach Click!! |
 |
Hello everyone.
My name is Yuma Narita.
Today, I’d like to talk about indoor positioning using deep learning technology.
|
















