 ICACT20240049 Slide.35
[Big slide for presentation] |
Chrome Text-to-Speach Click!! |
 |
That's it for my presentation Thank you for listening. Please let me know if you have any questions or comments.
|
|
ICACT20240049 Slide.34
[Big slide for presentation]
|
Chrome Text-to-Speach Click!! |
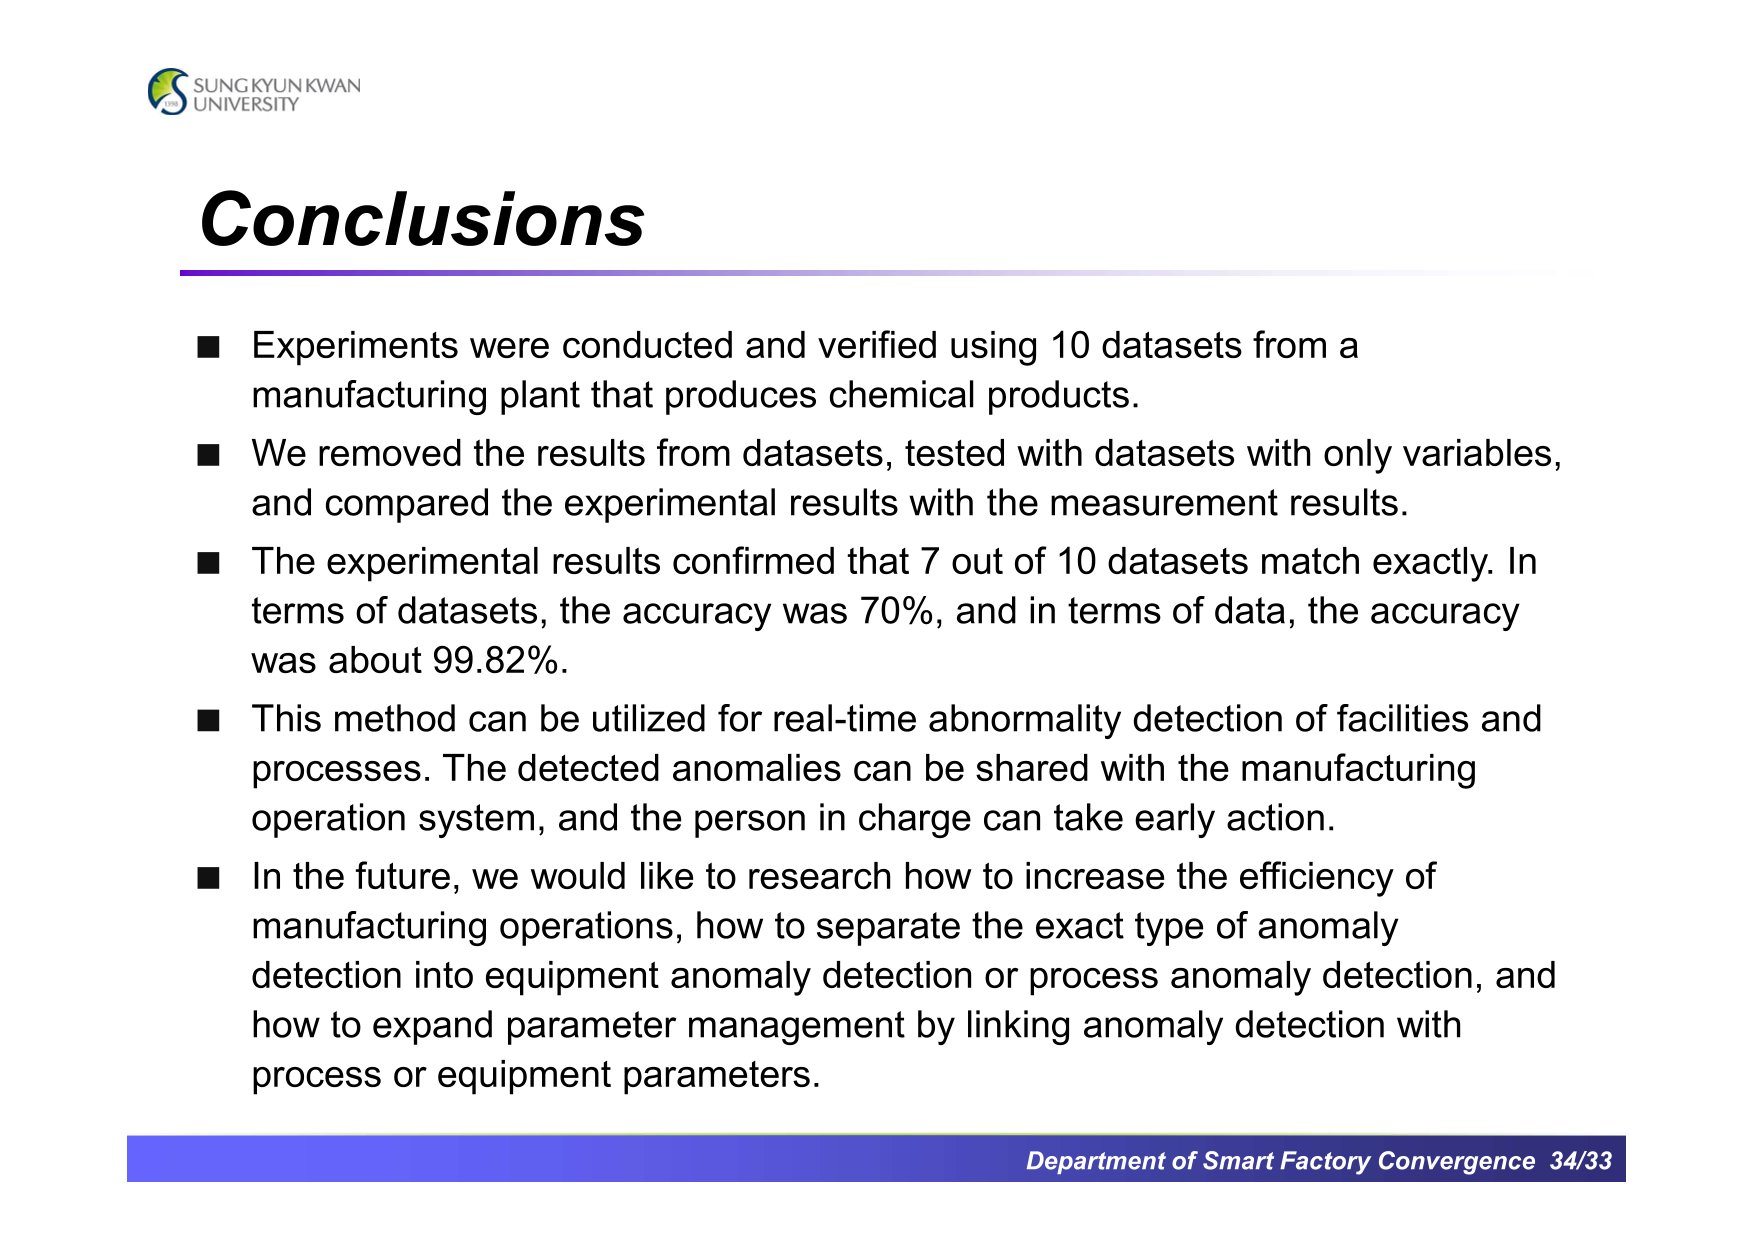 |
Supervised learning has higher prediction accuracy and good performance, but since there are some limitations to utilize the data immediately, it requires extra work on the data and is expensive. To compensate for this, unsupervised learning can be considered. However, unsupervised learning has lower accuracy and poorer performance compared to supervised learning. To analyze real-time data based on unsupervised learning, we proposed and validated "Multivariate PCA-based Composite Criteria Evaluation Method", which utilizes a simple PCA algorithm and two statistical techniques. In particular, in the case of anomaly detection, the frequency of anomalies is often too high for practical use. To improve this, two statistical technique thresholds were used together to reduce the frequency of anomalies. This method can be used to monitor and detect abnormal situations in facilities or processes. In the future, we plan to continue research on utilizing the identified anomalies information. In other words, the information sharing direction should be changed to bi-directional ways instead of single directional data flow between the manufacturing operation system and the data analysis system. We believe that it can be used in lot tracking to select the next process or facility, job dispatching, recipe parameter optimization, etc.
|
|
ICACT20240049 Slide.33
[Big slide for presentation]
|
Chrome Text-to-Speach Click!! |
 |
Conclusions ...
|
|
ICACT20240049 Slide.32
[Big slide for presentation]
|
Chrome Text-to-Speach Click!! |
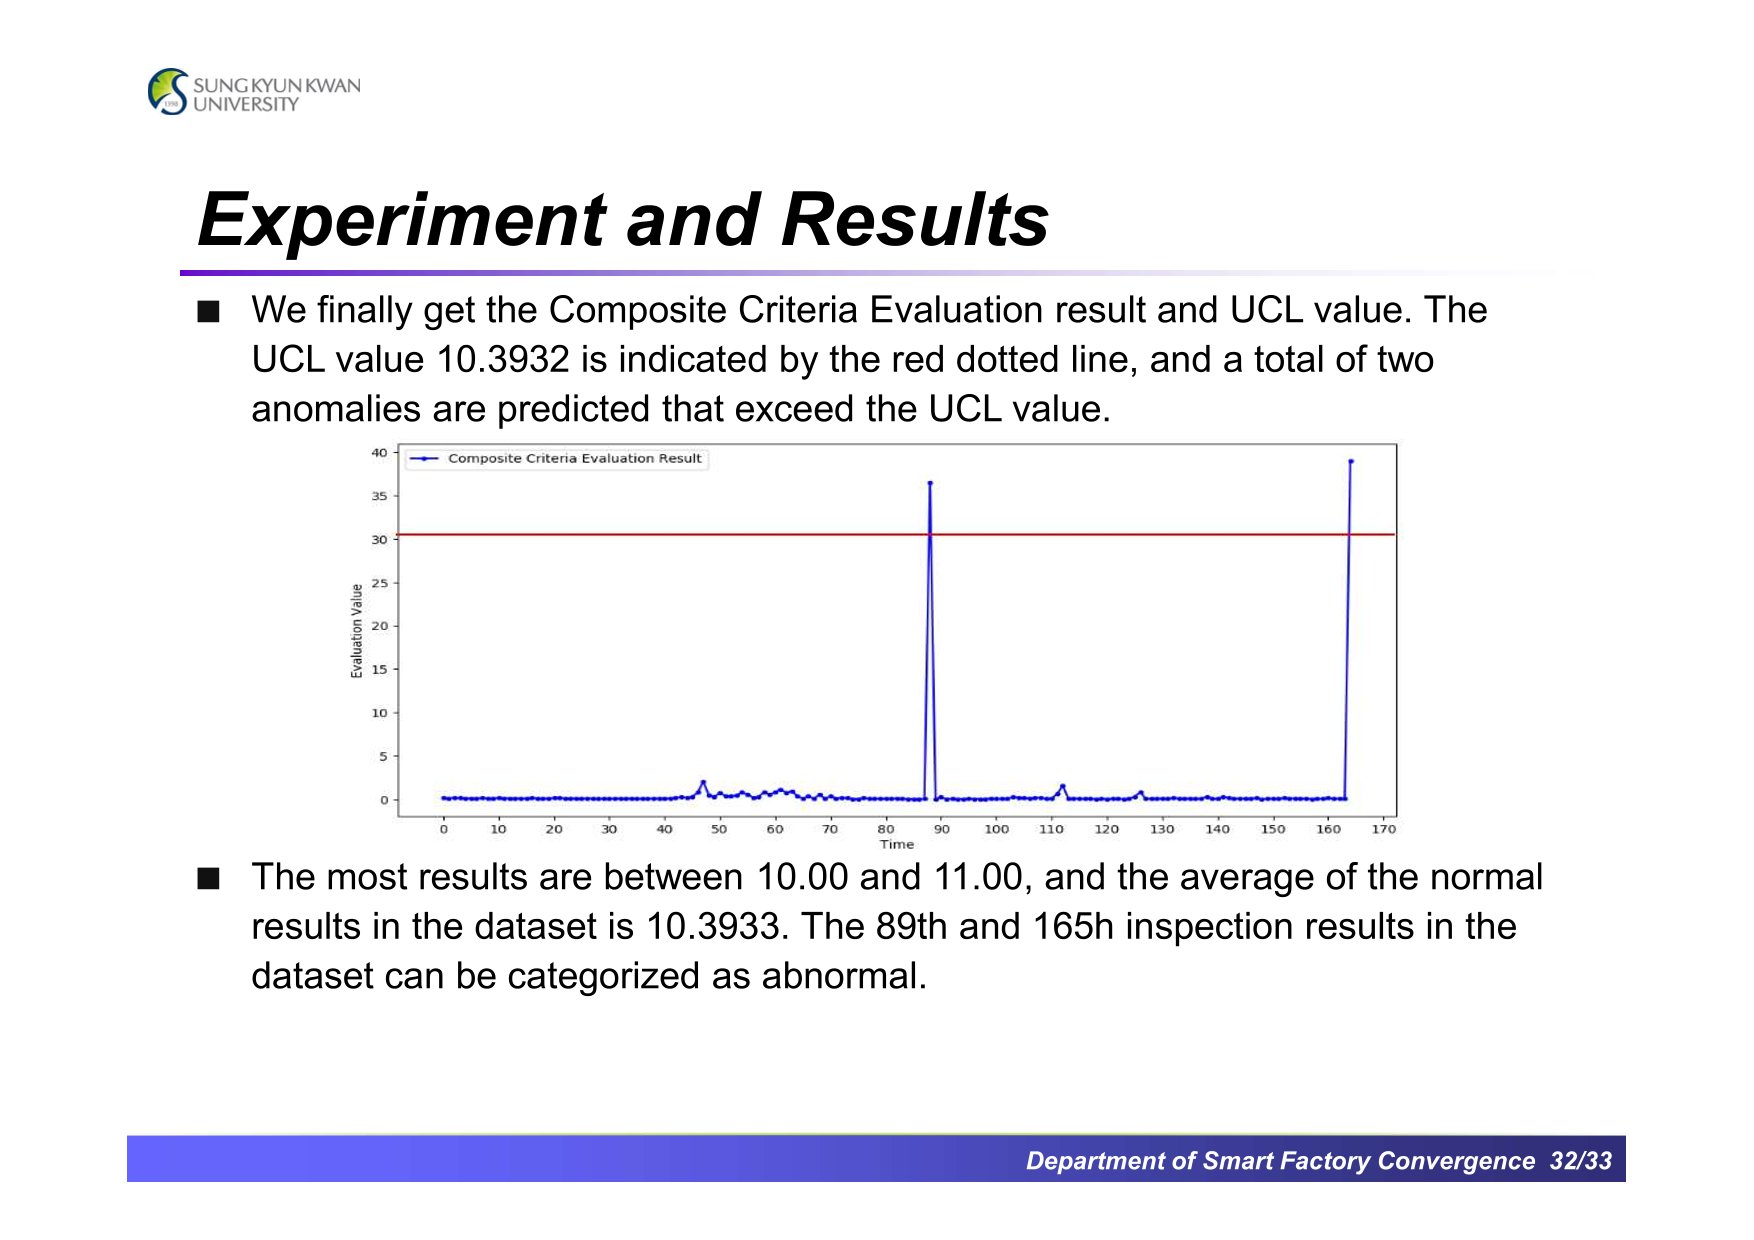 |
The final result ...
The result is similar to the previous case, with the two anomalies correctly predicted.
|
|
ICACT20240049 Slide.31
[Big slide for presentation]
|
Chrome Text-to-Speach Click!! |
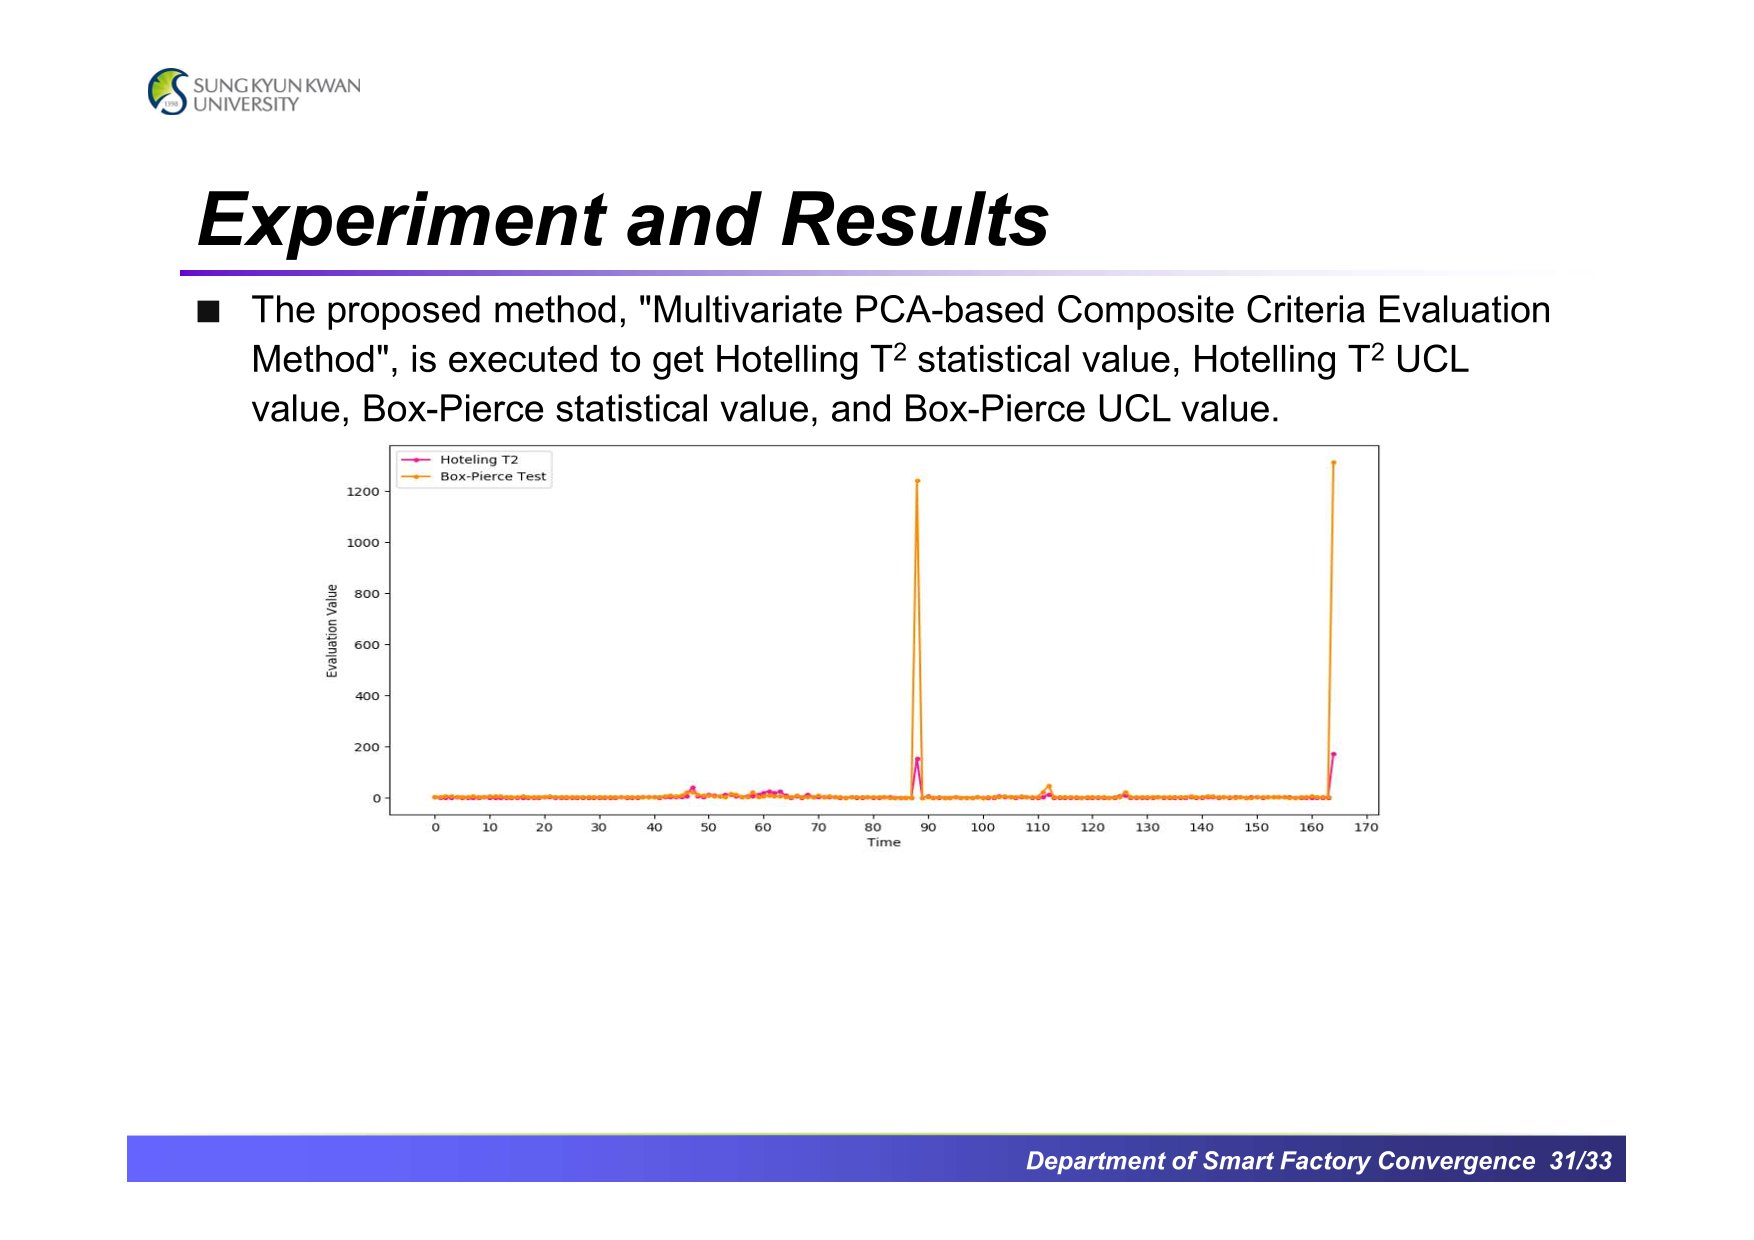 |
Checking the results of Hotelling's T2 Control chart and Box-Pierce test ....
|
|
ICACT20240049 Slide.30
[Big slide for presentation]
|
Chrome Text-to-Speach Click!! |
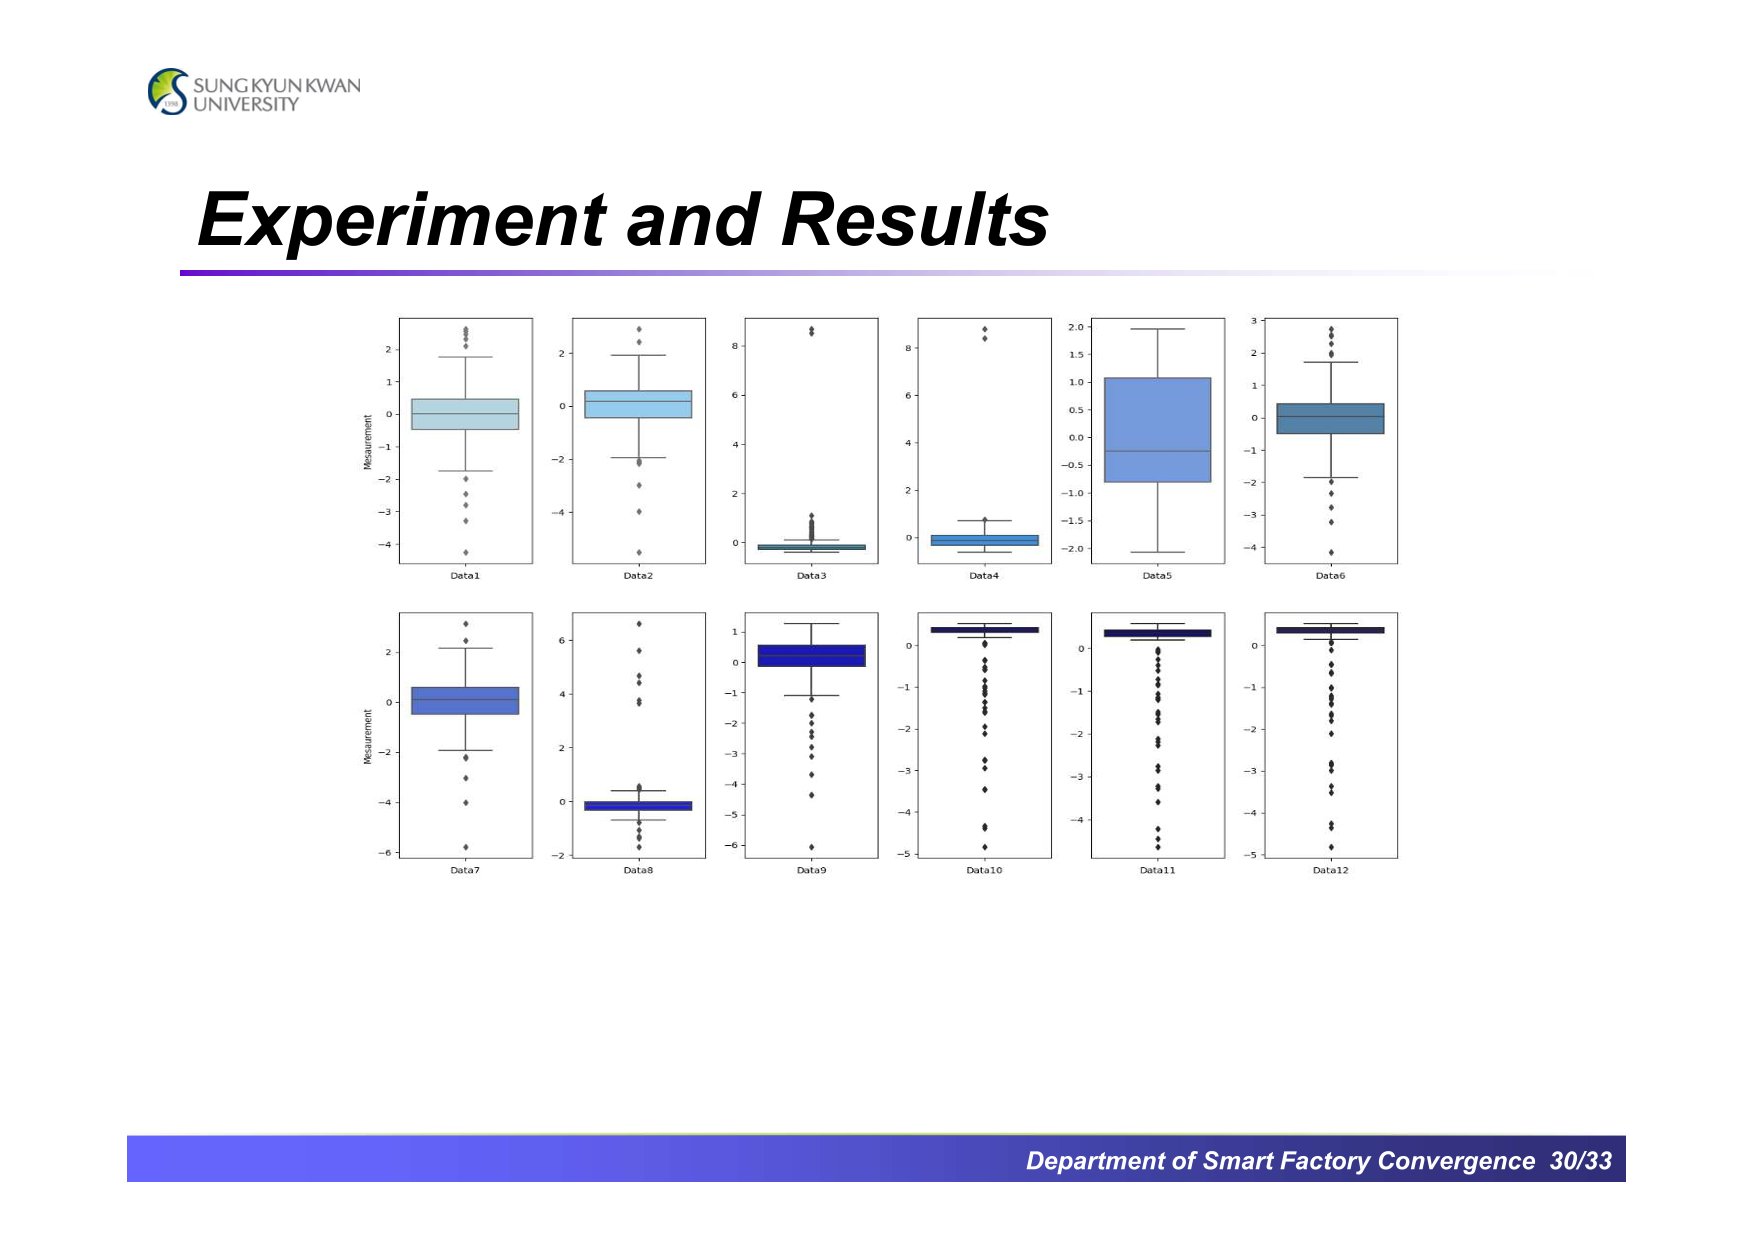 |
Checking statistical distribution ....
|
|
ICACT20240049 Slide.29
[Big slide for presentation]
|
Chrome Text-to-Speach Click!! |
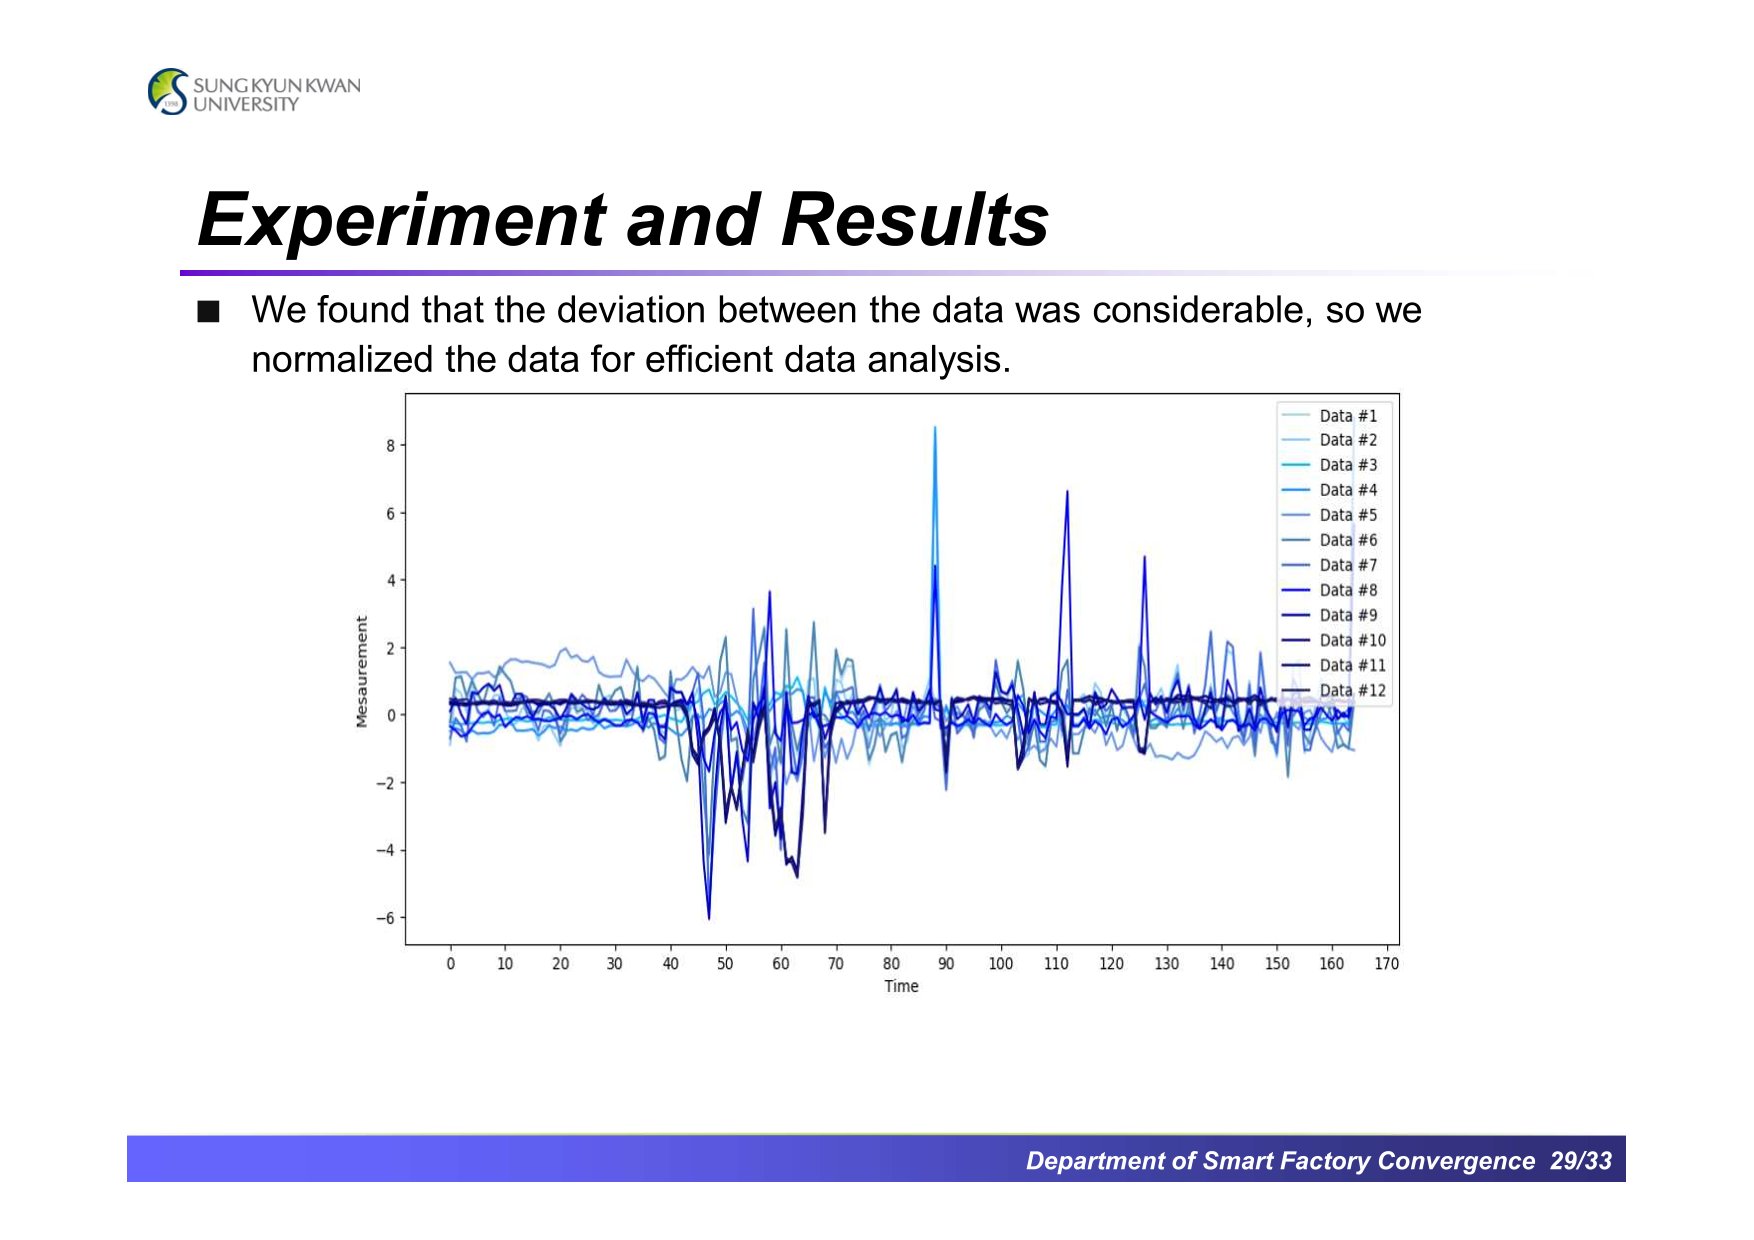 |
Normalizing data ....
|
|
ICACT20240049 Slide.28
[Big slide for presentation]
|
Chrome Text-to-Speach Click!! |
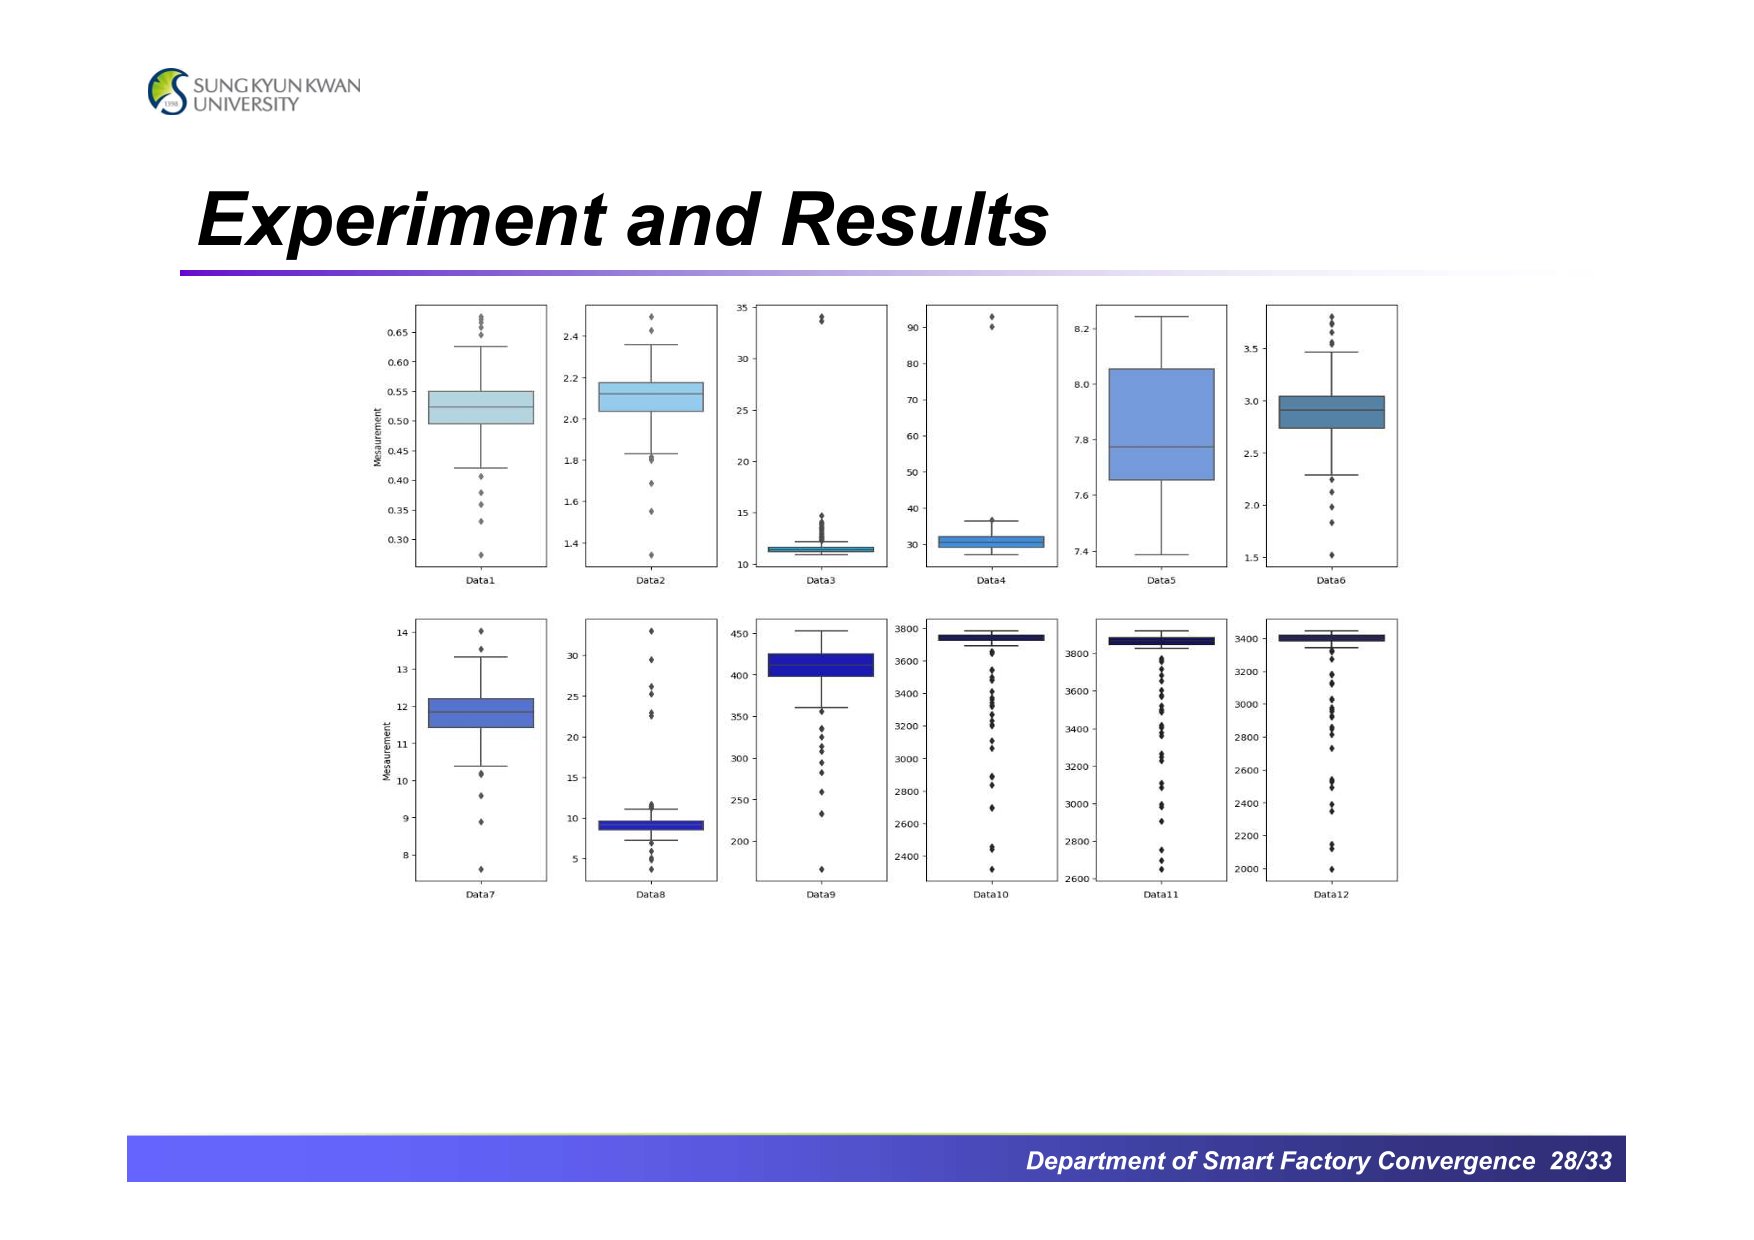 |
Checking statistical distribution, as well ....
The steps for analyzing the data are the same.
|
|
ICACT20240049 Slide.27
[Big slide for presentation]
|
Chrome Text-to-Speach Click!! |
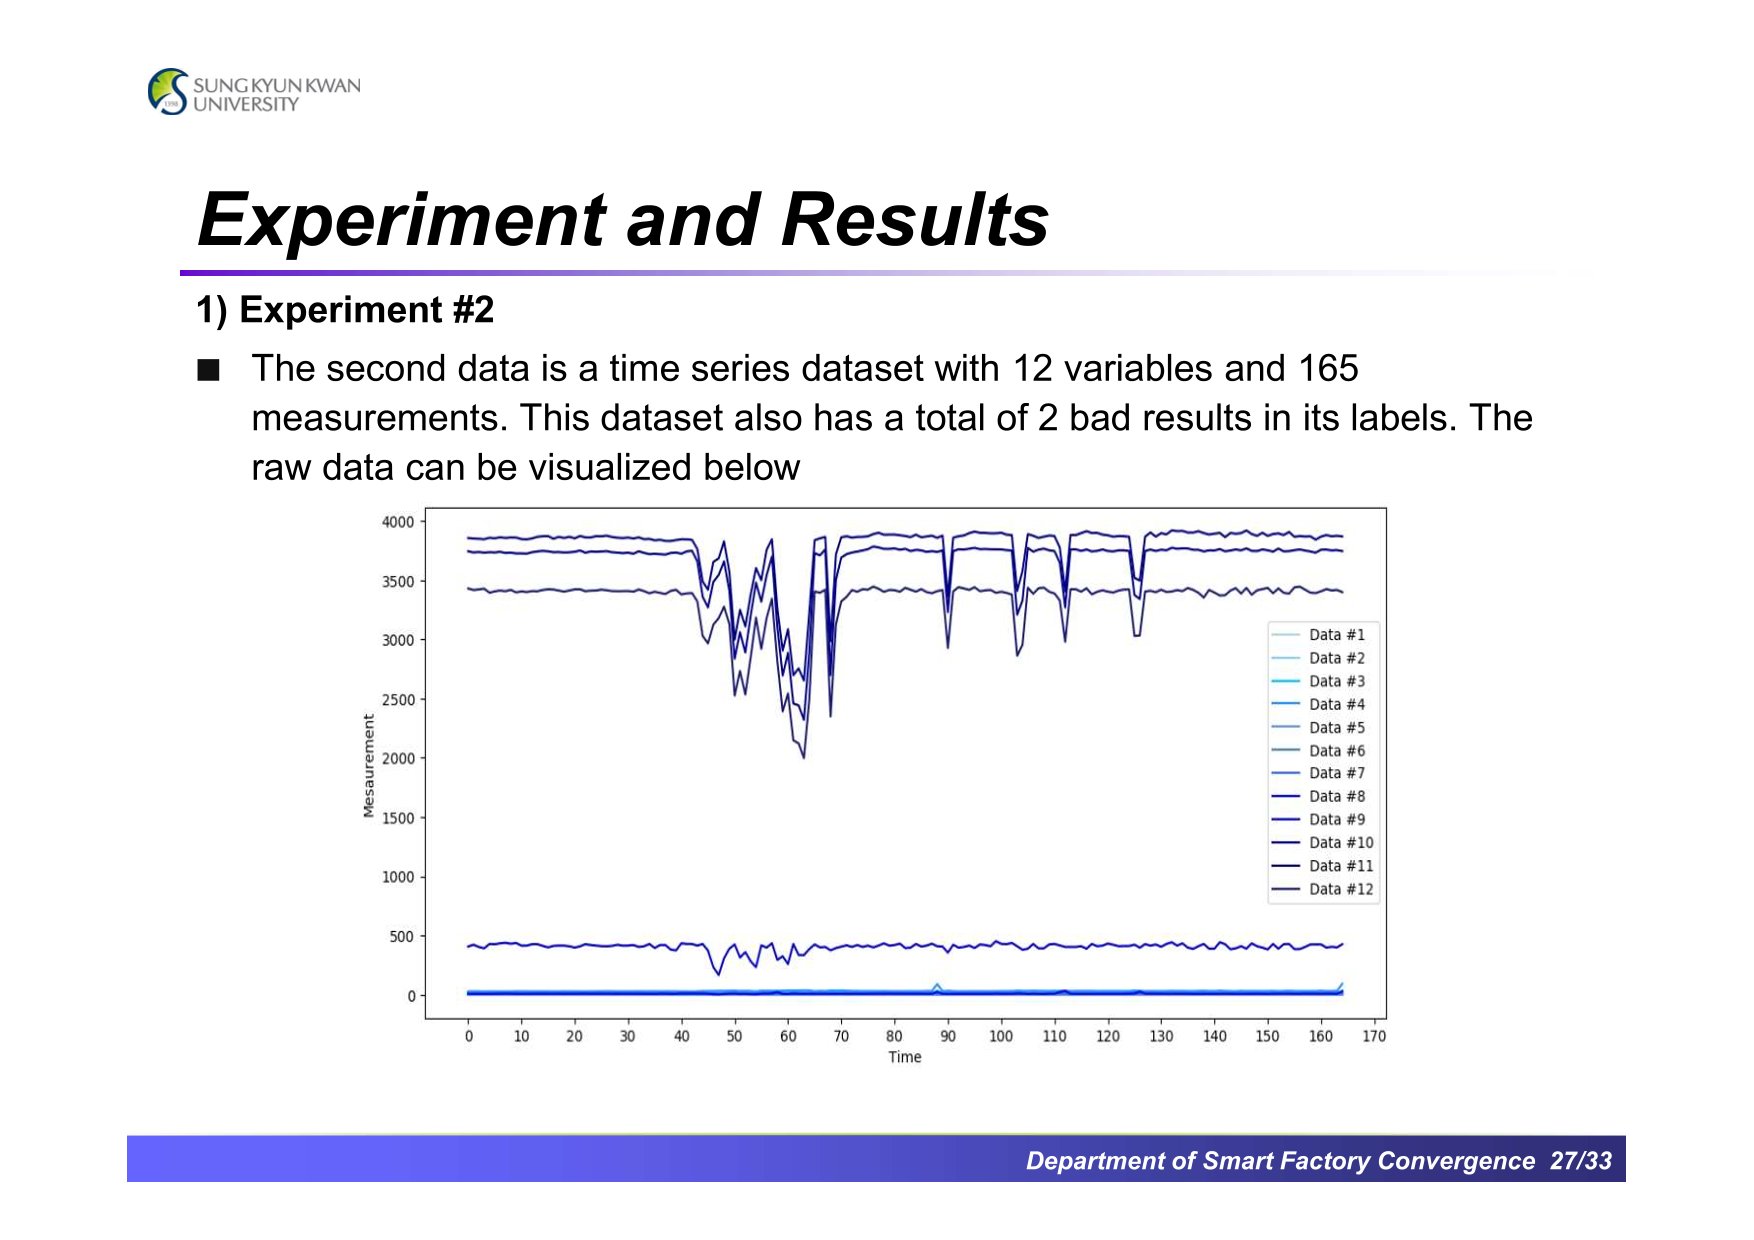 |
The other successful case is shown below. The dataset is a multivariate dataset with 12 independent variables, and we first checked the raw data of each variable.
|
|
ICACT20240049 Slide.26
[Big slide for presentation]
|
Chrome Text-to-Speach Click!! |
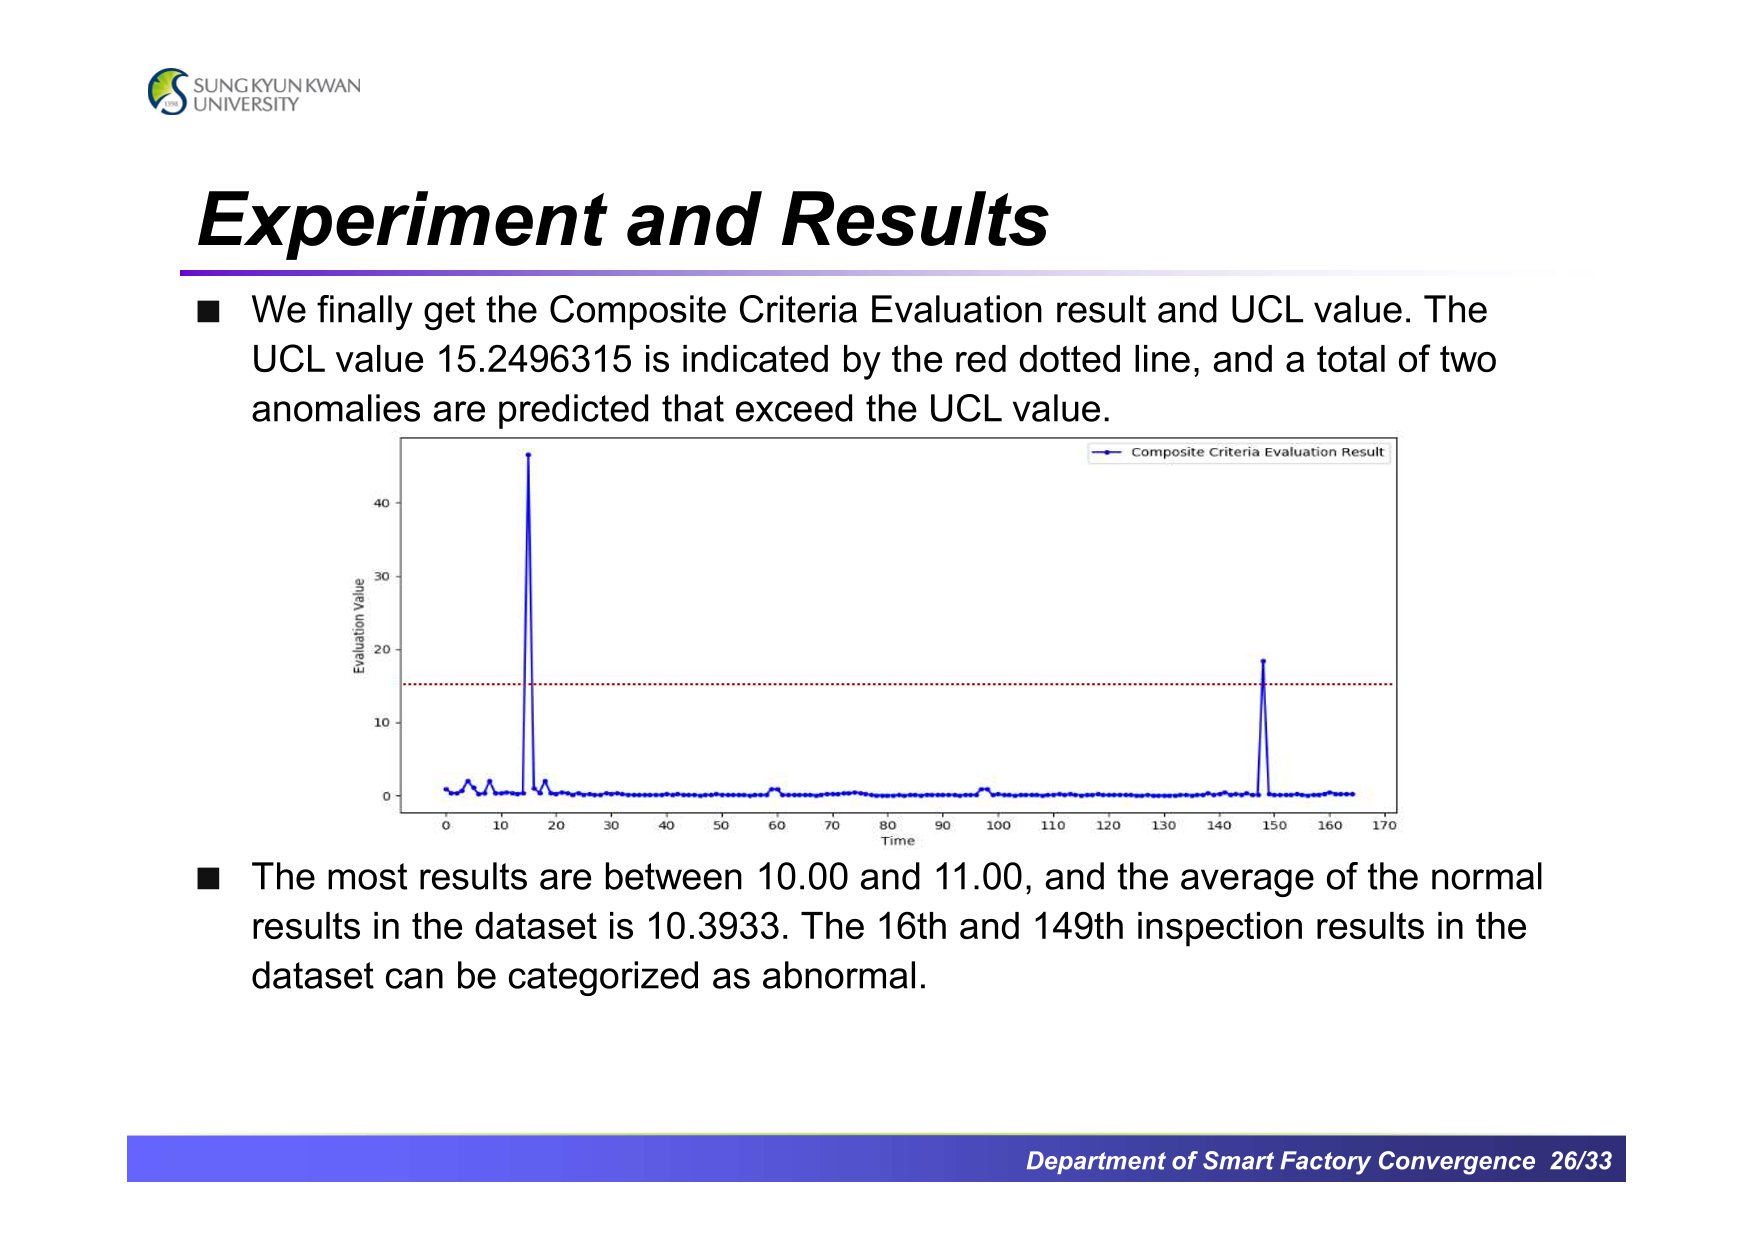 |
Finally, the data analysis results of the proposed method were shown with the UCL values of the proposed method. The UCL values of the proposed method are based on Hotelling's T2 control chart UCL and Box-Pierce test UCL values. The results of the proposed method detected two anomalies. If these anomalies are compared to the actual label values, it is confirmed that they are consistent.
|
|
ICACT20240049 Slide.25
[Big slide for presentation]
|
Chrome Text-to-Speach Click!! |
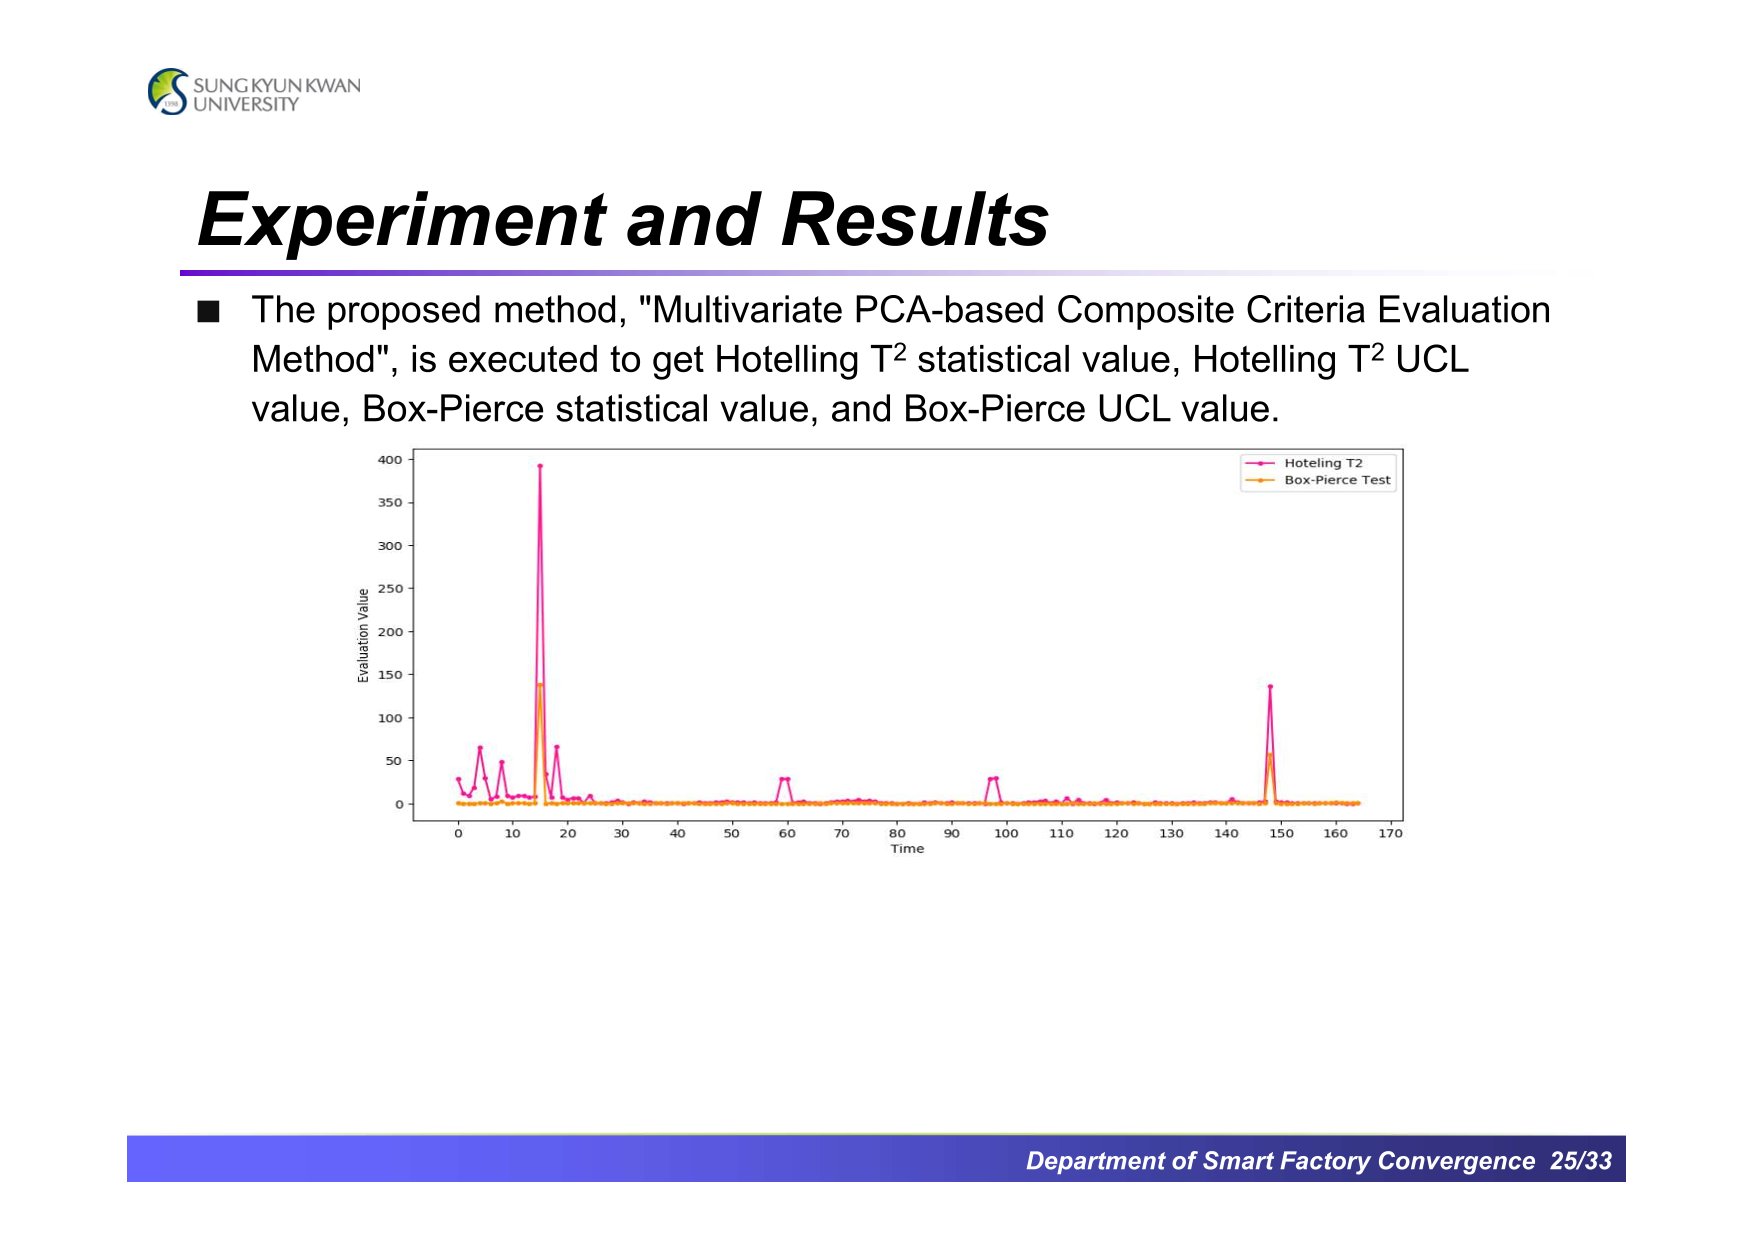 |
After normalization, the data was analyzed with the proposed method. The results of Hotelling's T2 Control chart and Box-Pierce test were shown. We can find that the results of Hotelling's T2 control chart are more sensitive than the Box-Pierce test.
|
|
ICACT20240049 Slide.24
[Big slide for presentation]
|
Chrome Text-to-Speach Click!! |
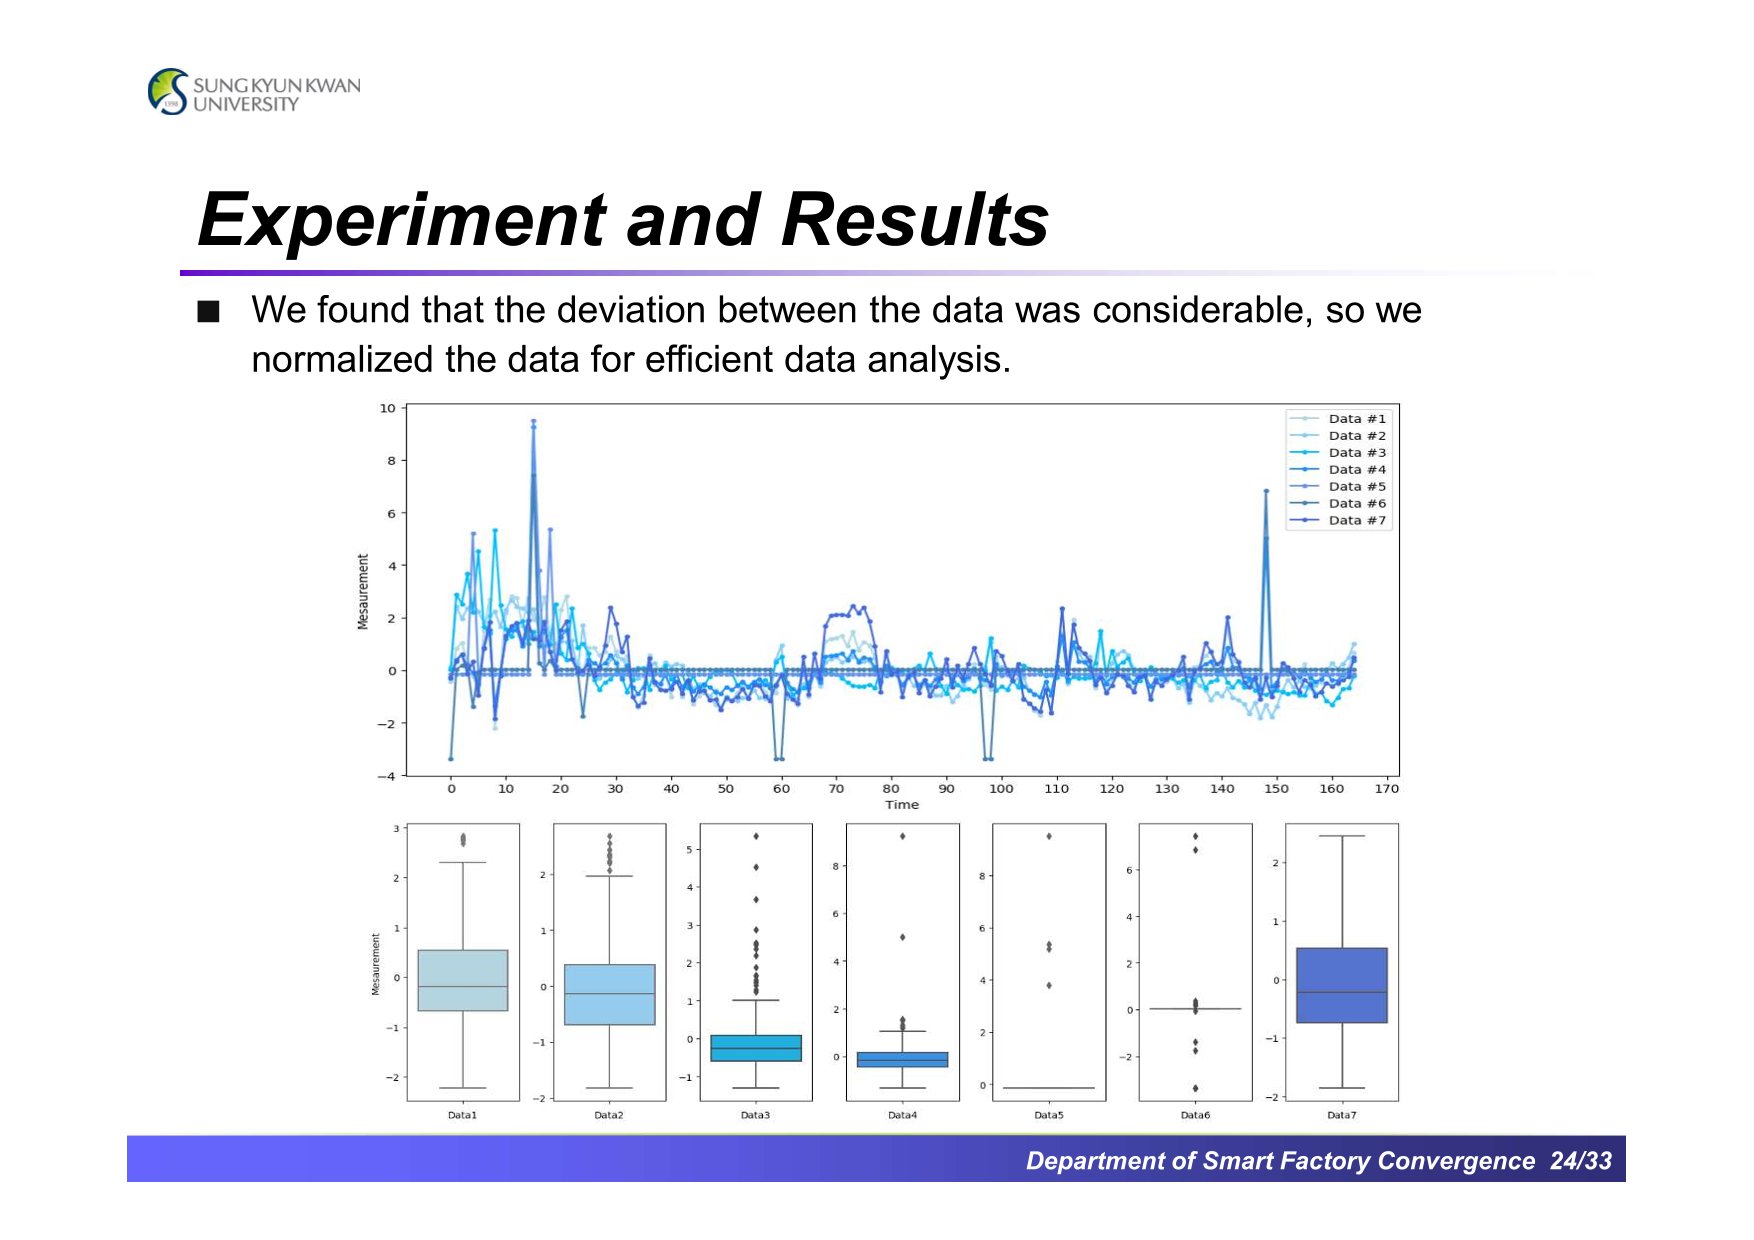 |
After that, we found that there are many differences between the independent variables and it is difficult to analyze the raw data as it is. So, we normalized the data for the next step.
|
|
ICACT20240049 Slide.23
[Big slide for presentation]
|
Chrome Text-to-Speach Click!! |
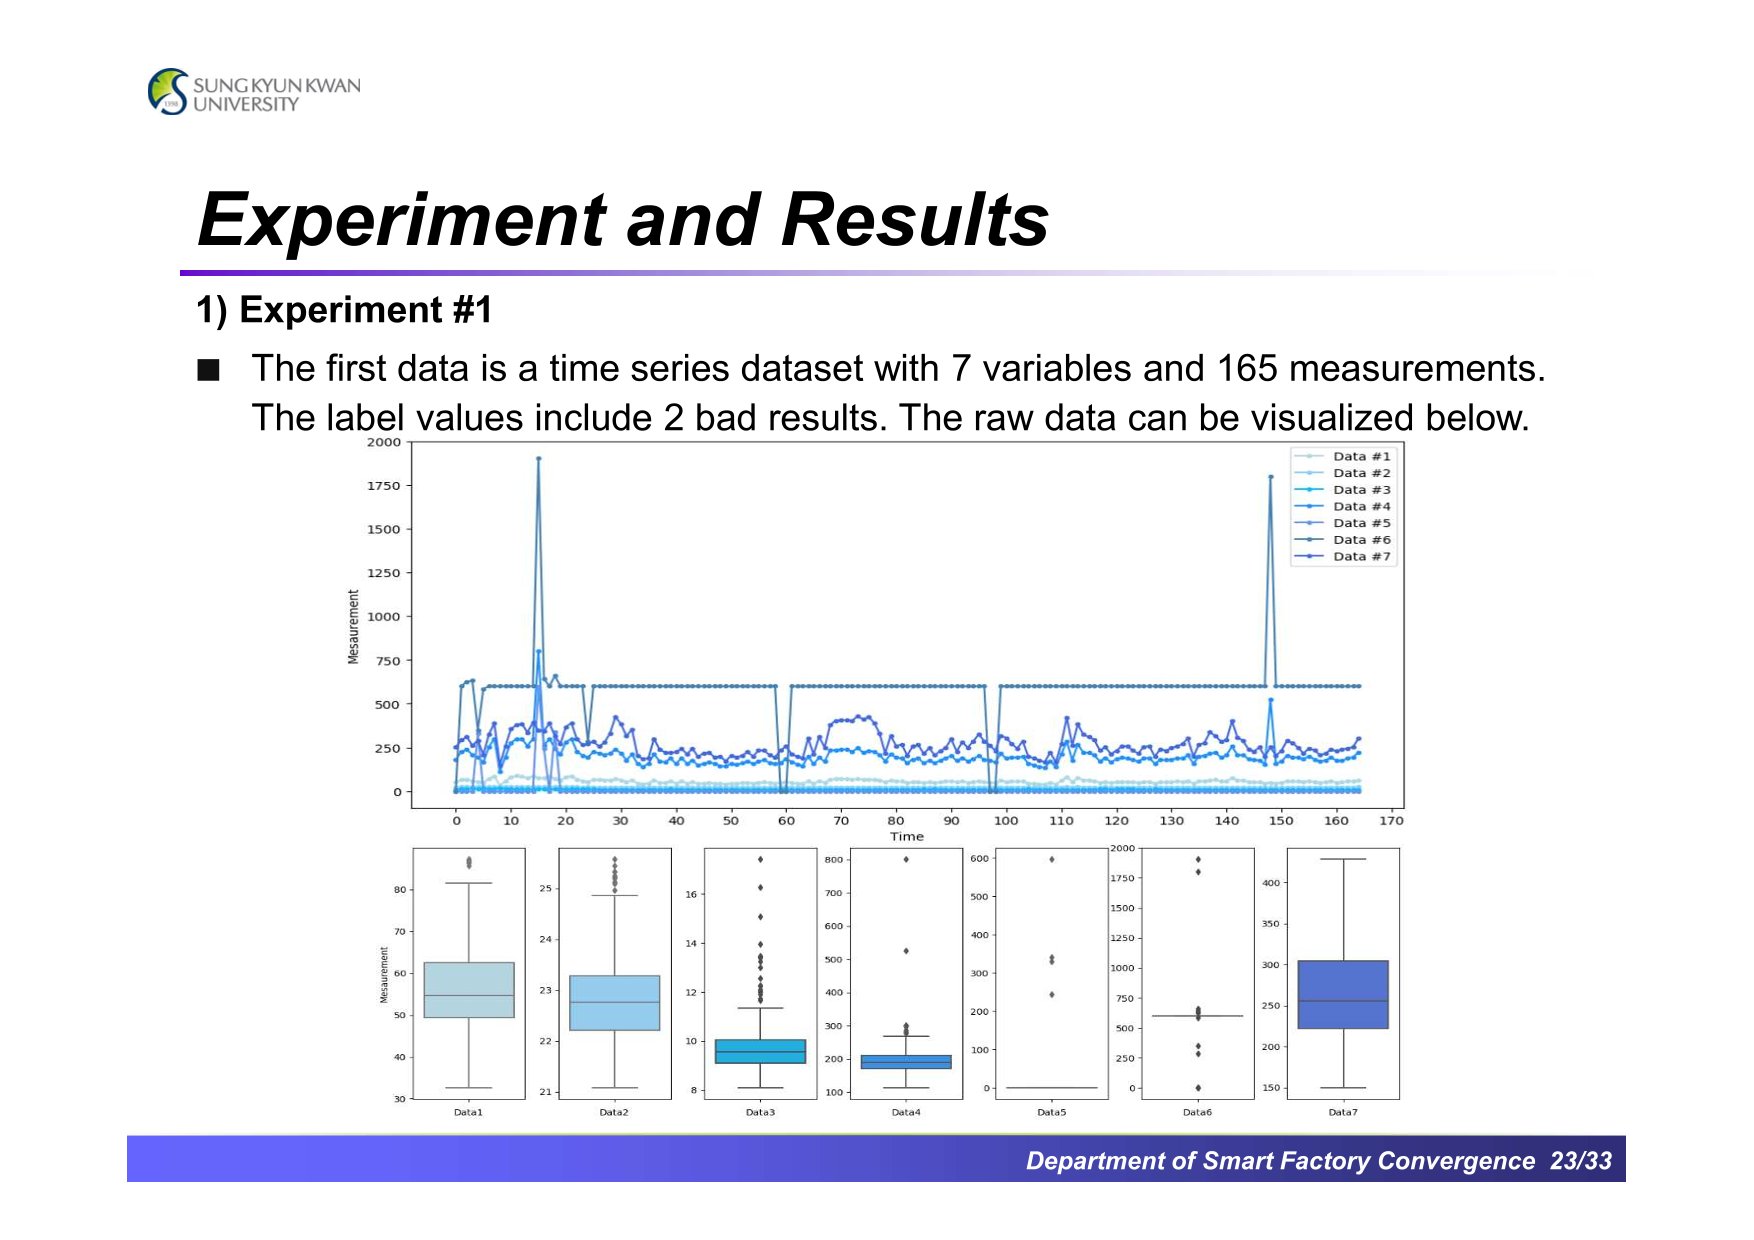 |
Here are two successful cases of how to analyze the dataset with the proposed method. One of the successful cases is shown below. The dataset is a multivariate dataset with 7 independent variables, and we first checked the statistical distribution of each variable.
|
|
ICACT20240049 Slide.22
[Big slide for presentation]
|
Chrome Text-to-Speach Click!! |
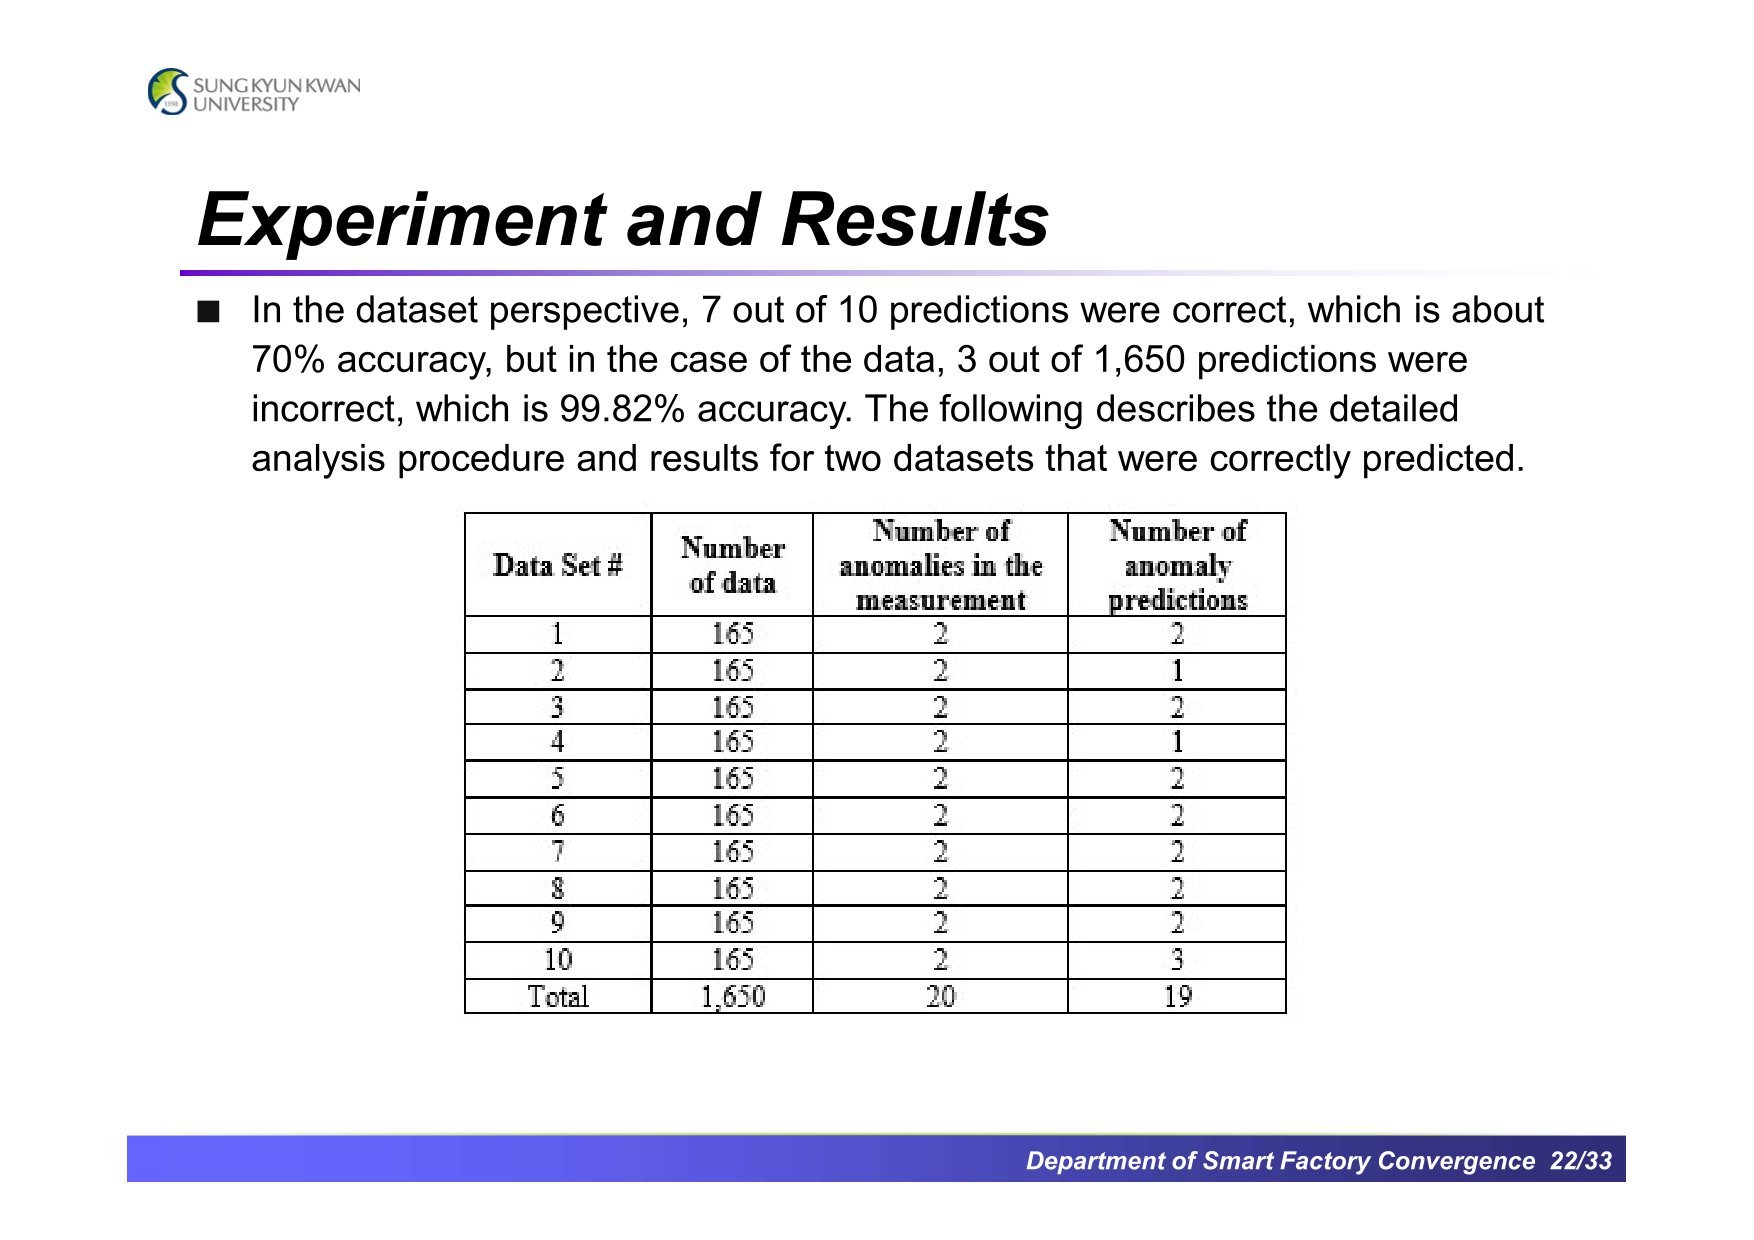 |
The following table shows the experimental datasets and the experimental results. As a result of the experiments with the proposed method, it predicted 7 among 10 datasets correctly, and it predicted 3 datasets incorrectly.
For datasets #2 and #4. it correctly predicted one of the two anomalies but failed to predict the other anomaly.
For dataset #10, it correctly predicted two anomalies but it predicted 1 normal data incorrectly.
|
|
ICACT20240049 Slide.21
[Big slide for presentation]
|
Chrome Text-to-Speach Click!! |
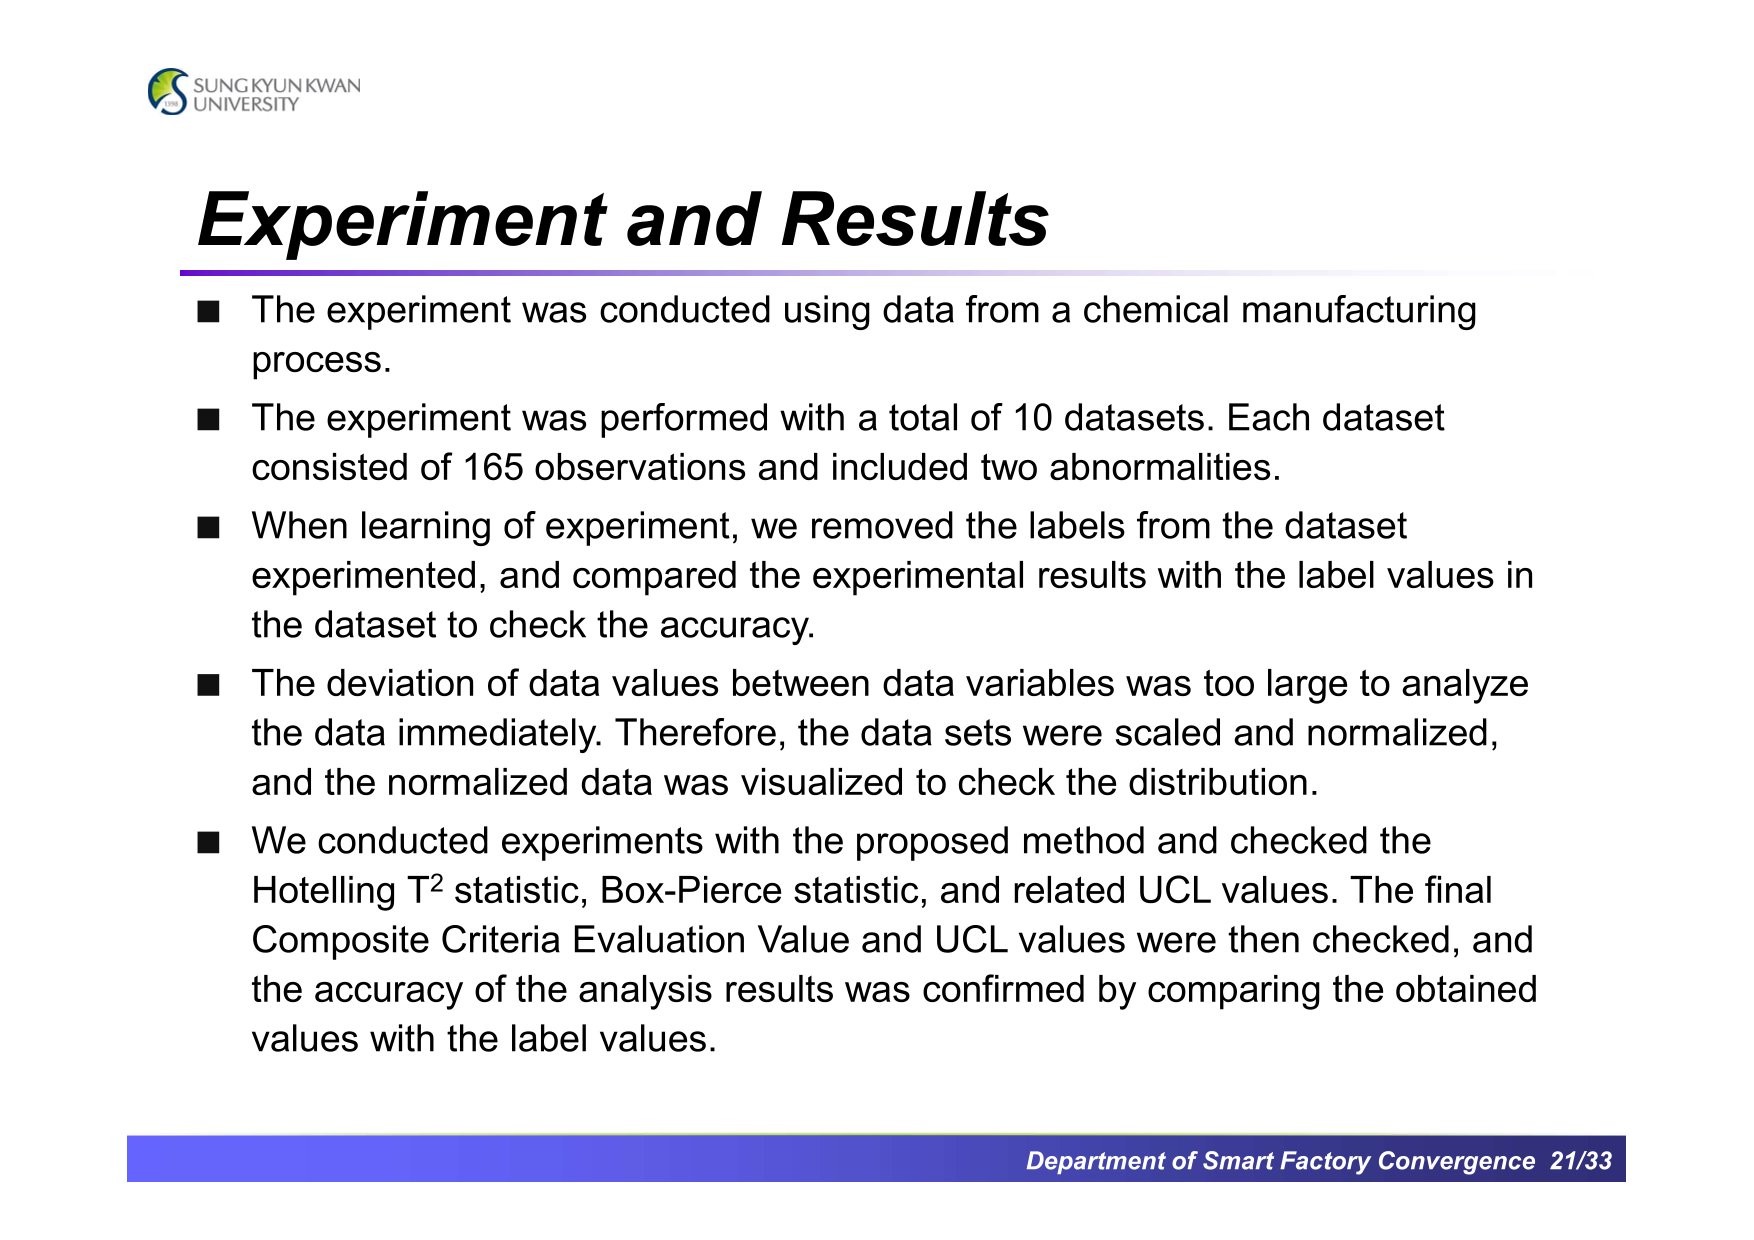 |
The experiments used manufacturing data for chemical products, and the evaluation of the experiments was based on unsupervised learning but used supervised learning data. When experimenting with the proposed method, the labels were removed and the experiment was conducted in an unsupervised way.
A total of 10 datasets were used. Each data consists of 165 data points with 2 abnormal data points.
|
|
ICACT20240049 Slide.20
[Big slide for presentation]
|
Chrome Text-to-Speach Click!! |
 |
Experiment and results
|
|
ICACT20240049 Slide.19
[Big slide for presentation]
|
Chrome Text-to-Speach Click!! |
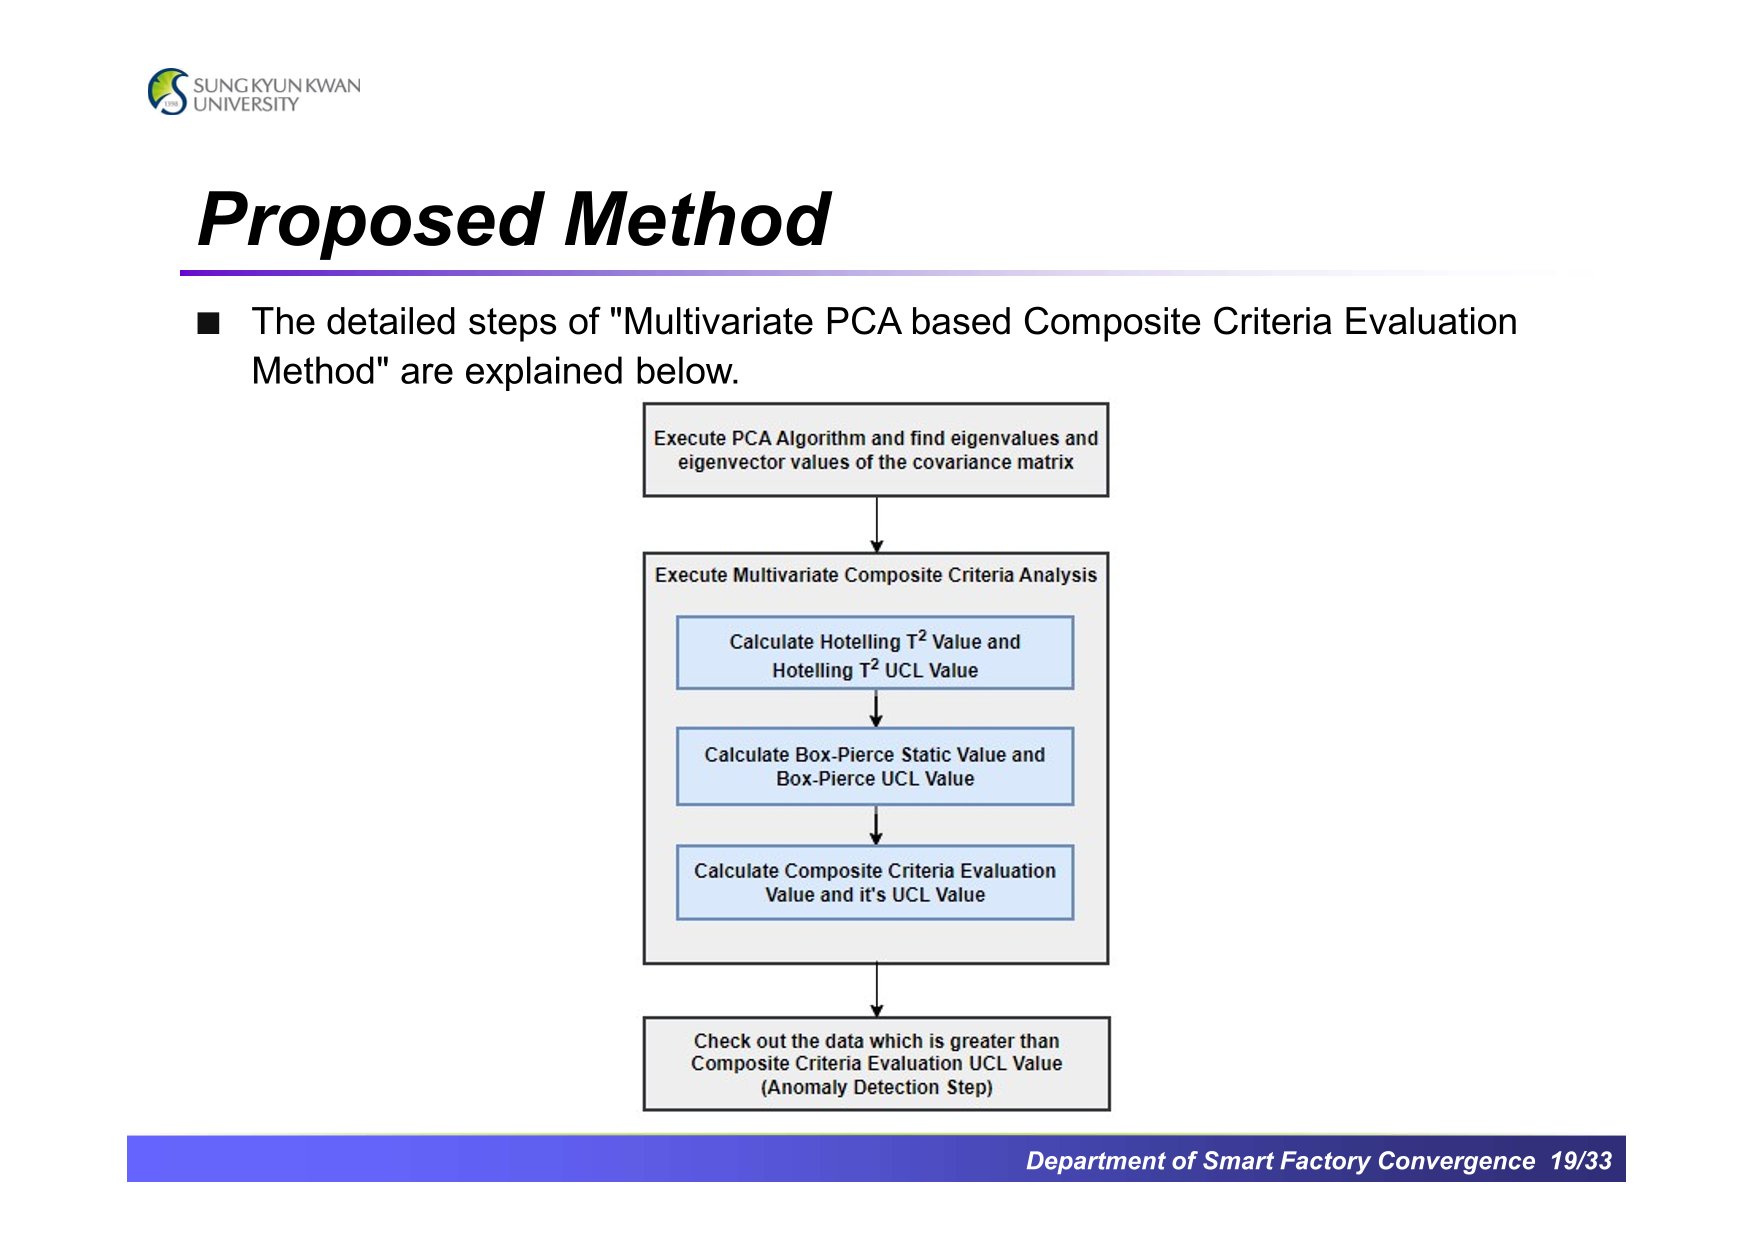 |
The following figure shows how to detect anomalies with proposed "Multivariate PCA-based Composite Criteria Evaluation Method".
|
|
ICACT20240049 Slide.18
[Big slide for presentation]
|
Chrome Text-to-Speach Click!! |
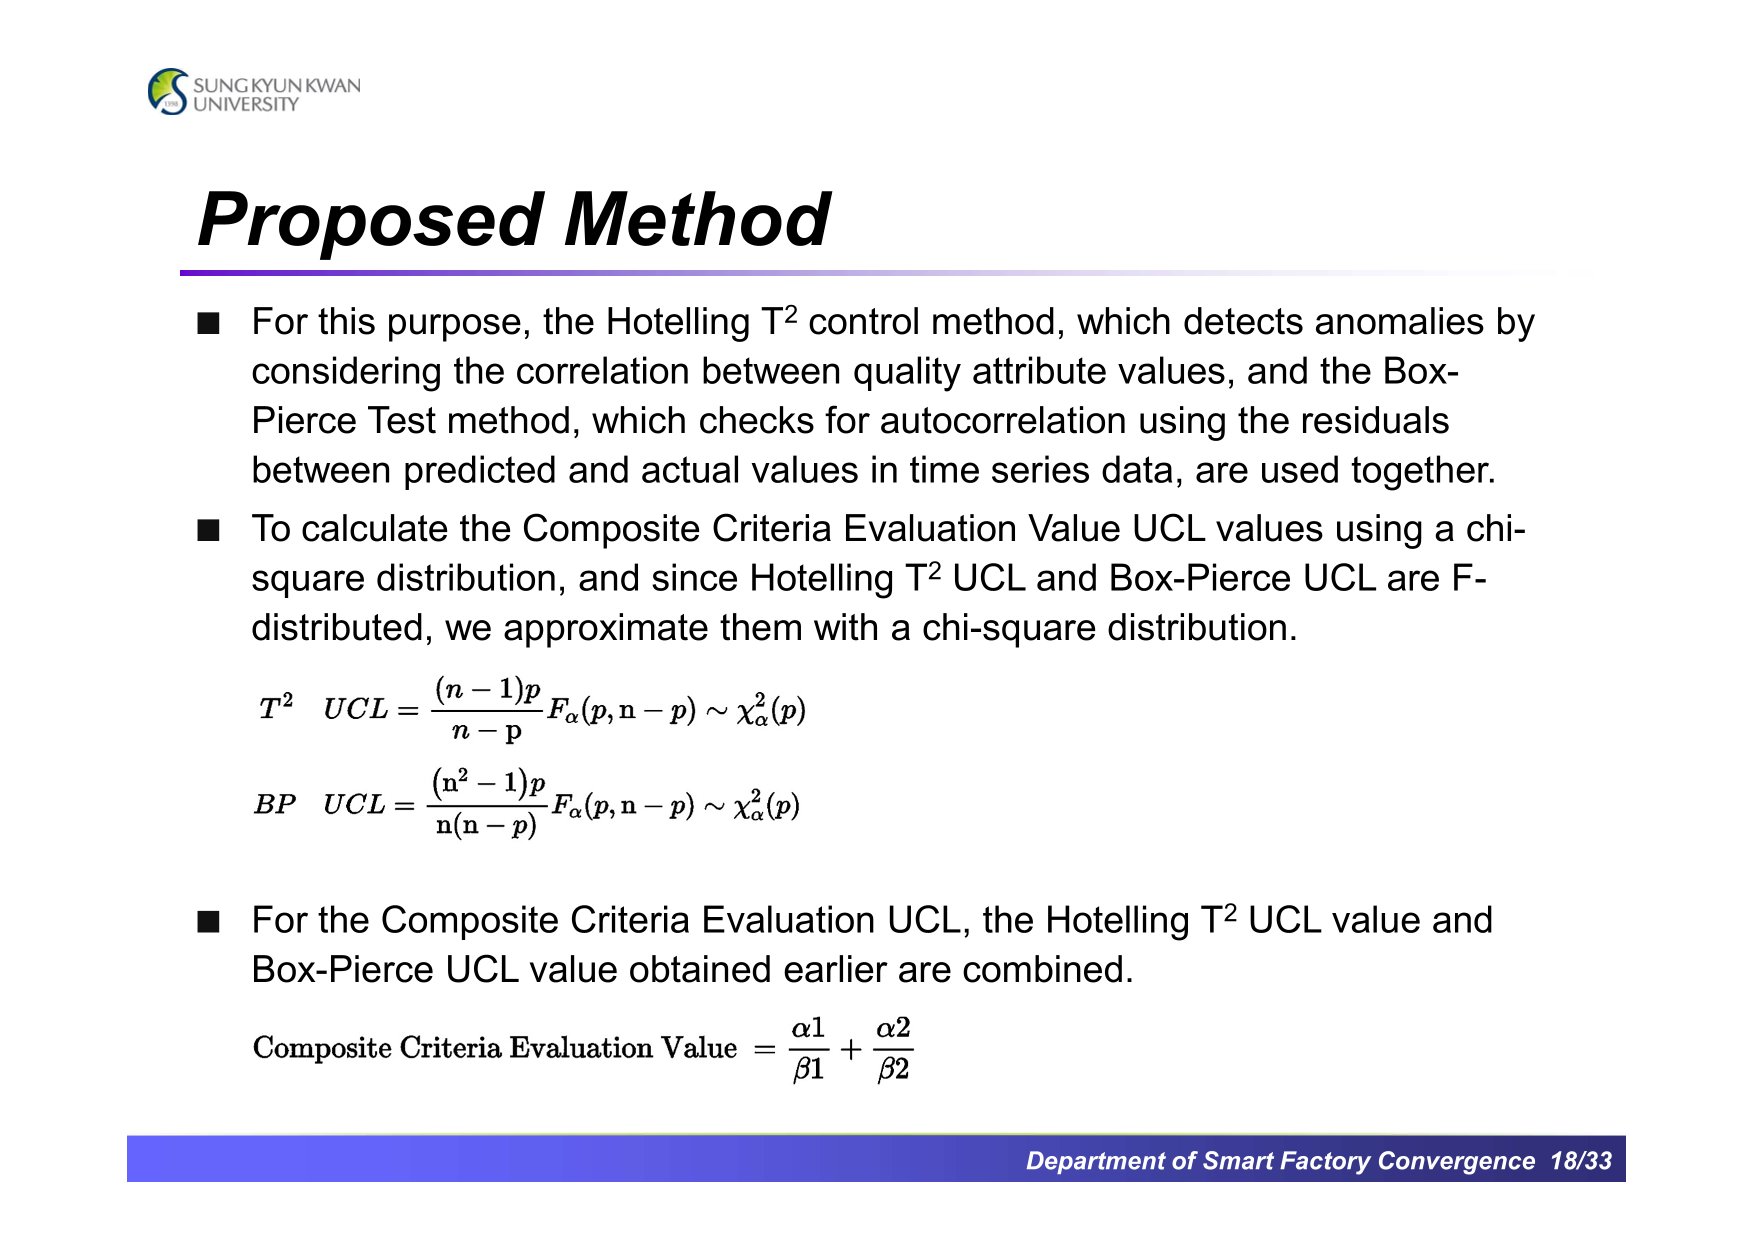 |
The existing Hotelling T2 control chart and Box-Pierce test have upper control limit values that can detect anomalies. And, the proposed method uses these two UCL values to calculate a new control limit value to determine the anomaly. By using this new control limit value, the reliability is improved by raising the standard to determine anomalies, and the frequency of anomalies could be reduced.
|
|
ICACT20240049 Slide.17
[Big slide for presentation]
|
Chrome Text-to-Speach Click!! |
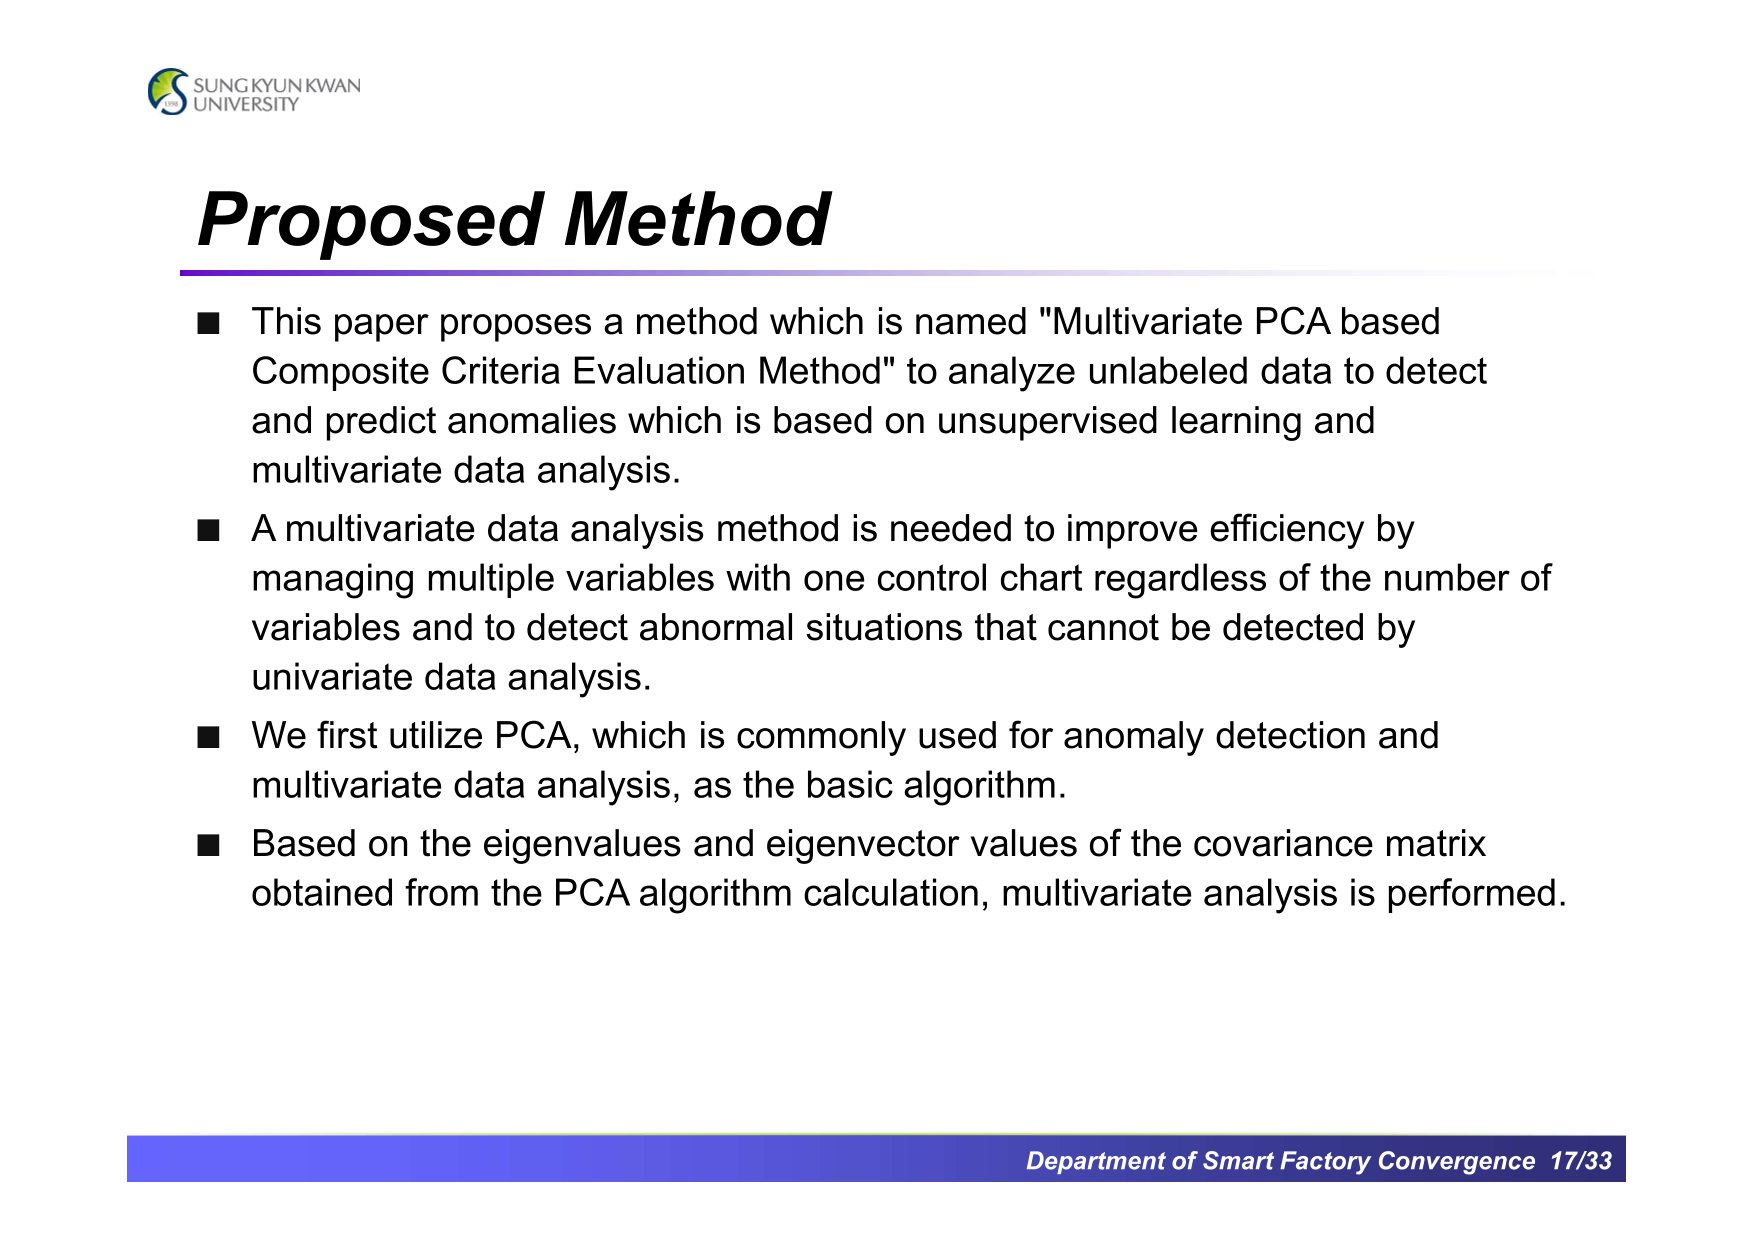 |
In this paper, we propose a "Multivariate PCA based Composite Criteria Evaluation Method" using the Principal Component Analysis algorithm and two statistical techniques, Hotelling T2 control chart and Box-Pierce test. This method can analyze unlabeled time series data to detect anomalies based on unsupervised learning.
|
|
ICACT20240049 Slide.16
[Big slide for presentation]
|
Chrome Text-to-Speach Click!! |
 |
Let me introduce the proposed method.
|
|
ICACT20240049 Slide.15
[Big slide for presentation]
|
Chrome Text-to-Speach Click!! |
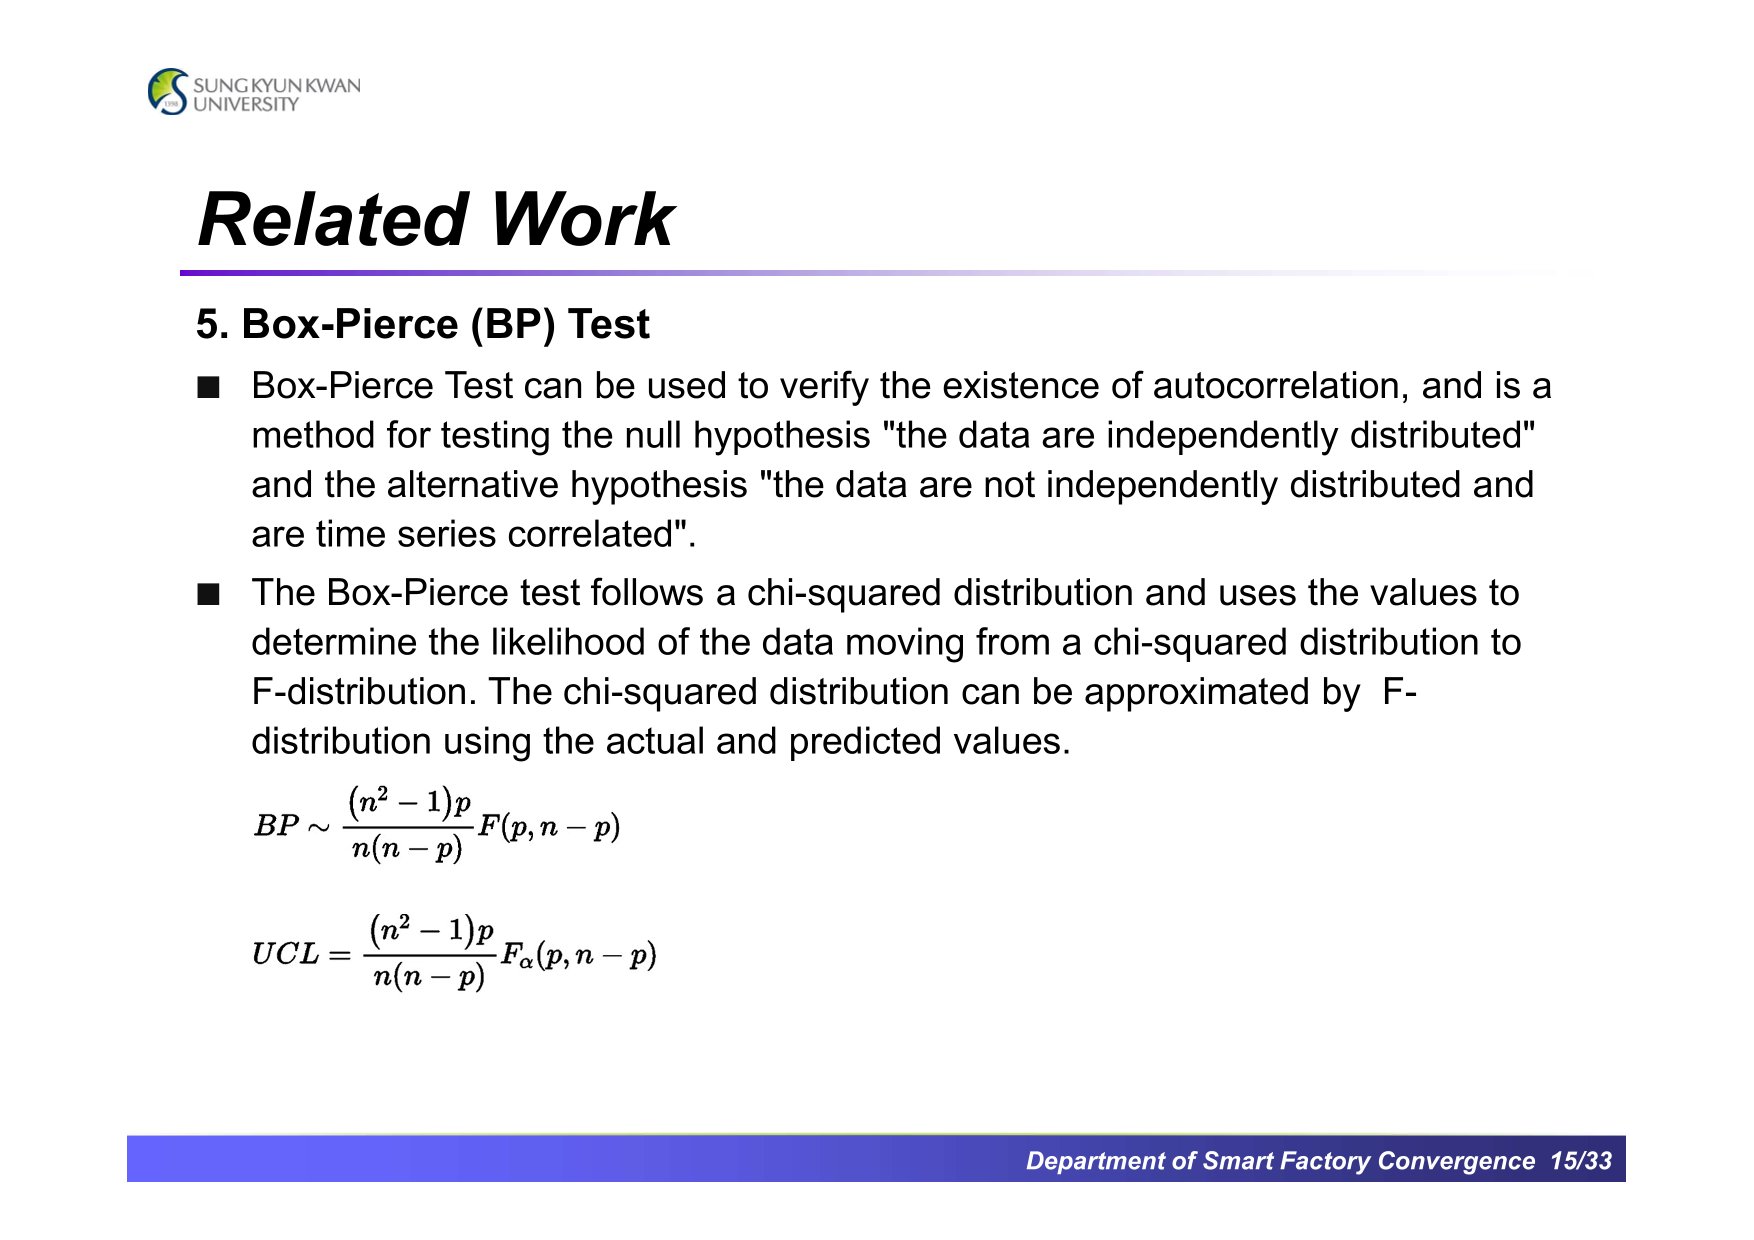 |
The Box Pierce Test is a simple statistical technique and a test method for determining the relationship and independence of data.
Both statistical techniques provide an upper control limit value to determine whether a value is abnormal.
|
|
ICACT20240049 Slide.14
[Big slide for presentation]
|
Chrome Text-to-Speach Click!! |
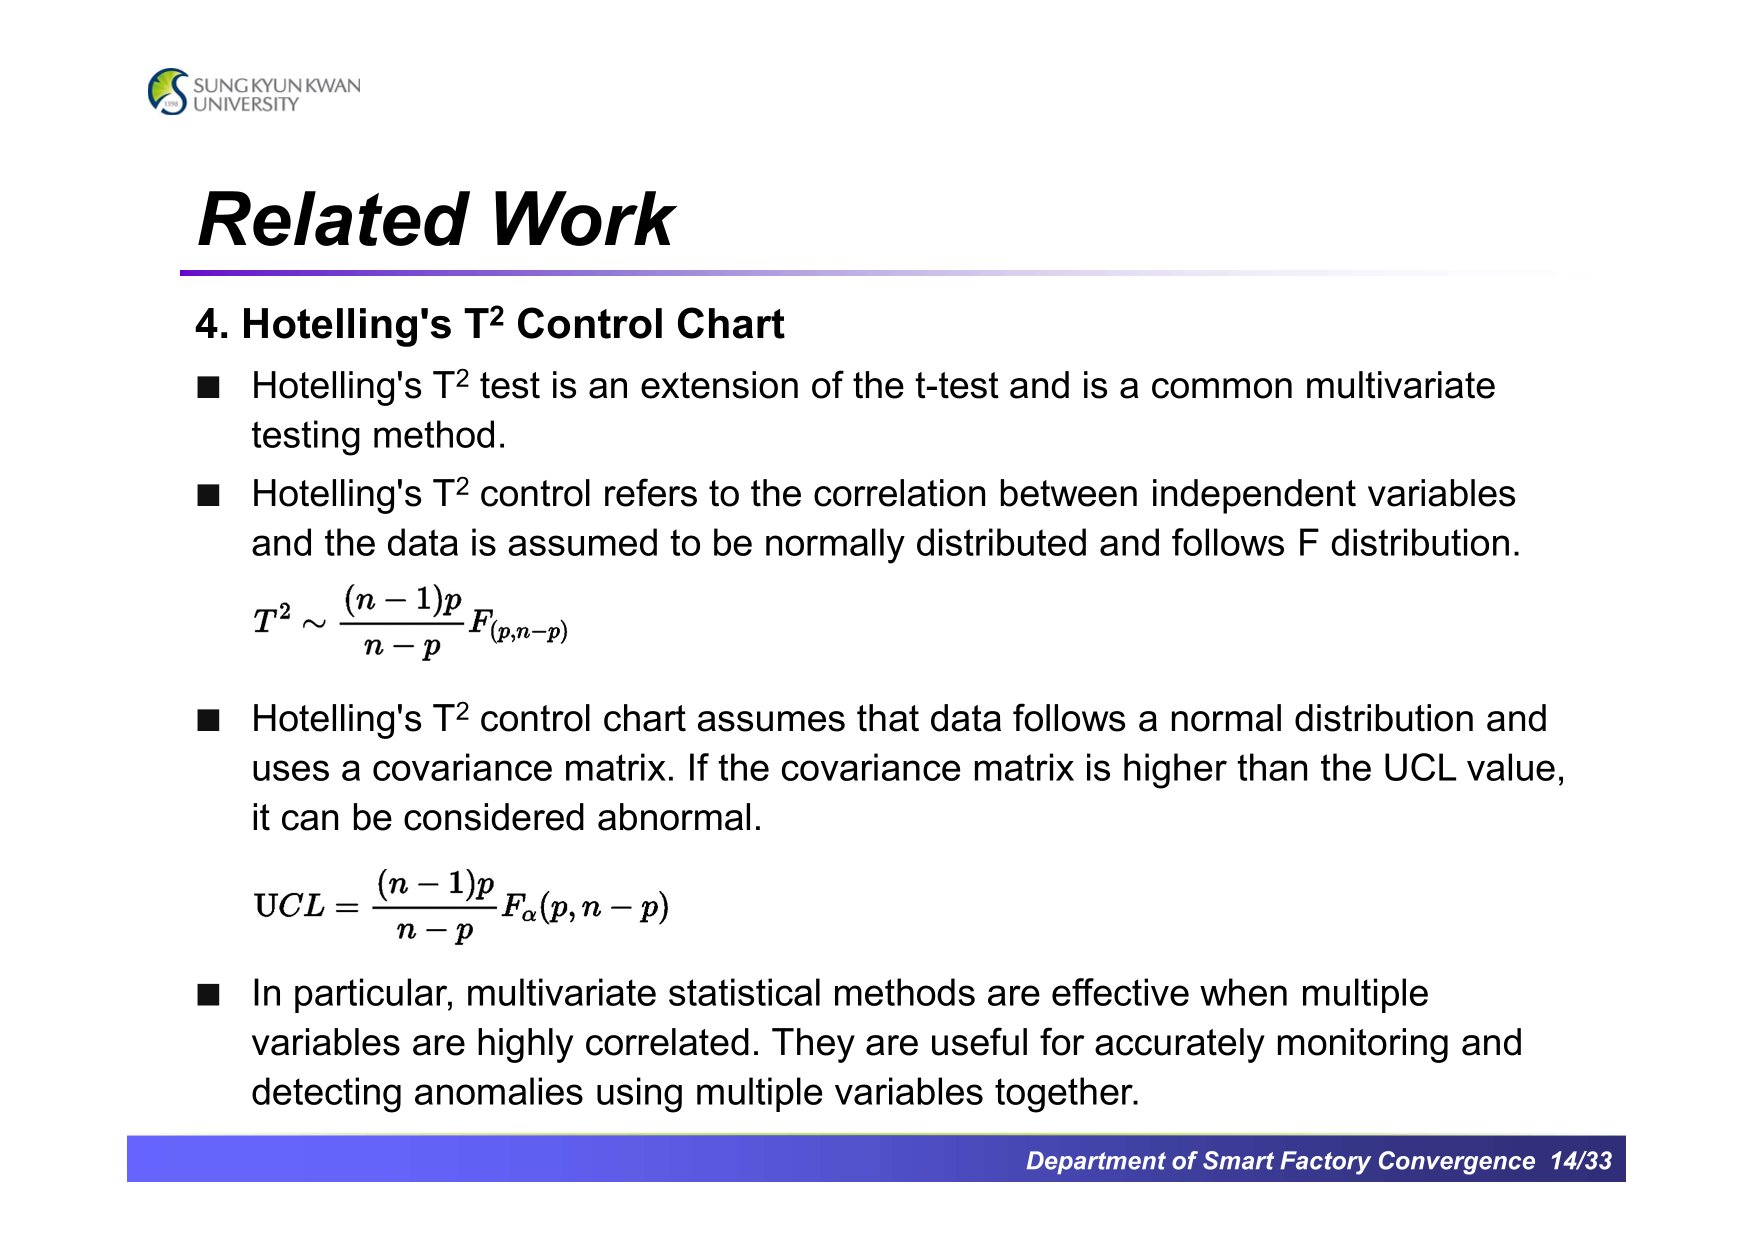 |
Hotelling's T2 Control Chart is a statistical analysis method that is useful for analyzing multivariate data.
|
|
ICACT20240049 Slide.13
[Big slide for presentation]
|
Chrome Text-to-Speach Click!! |
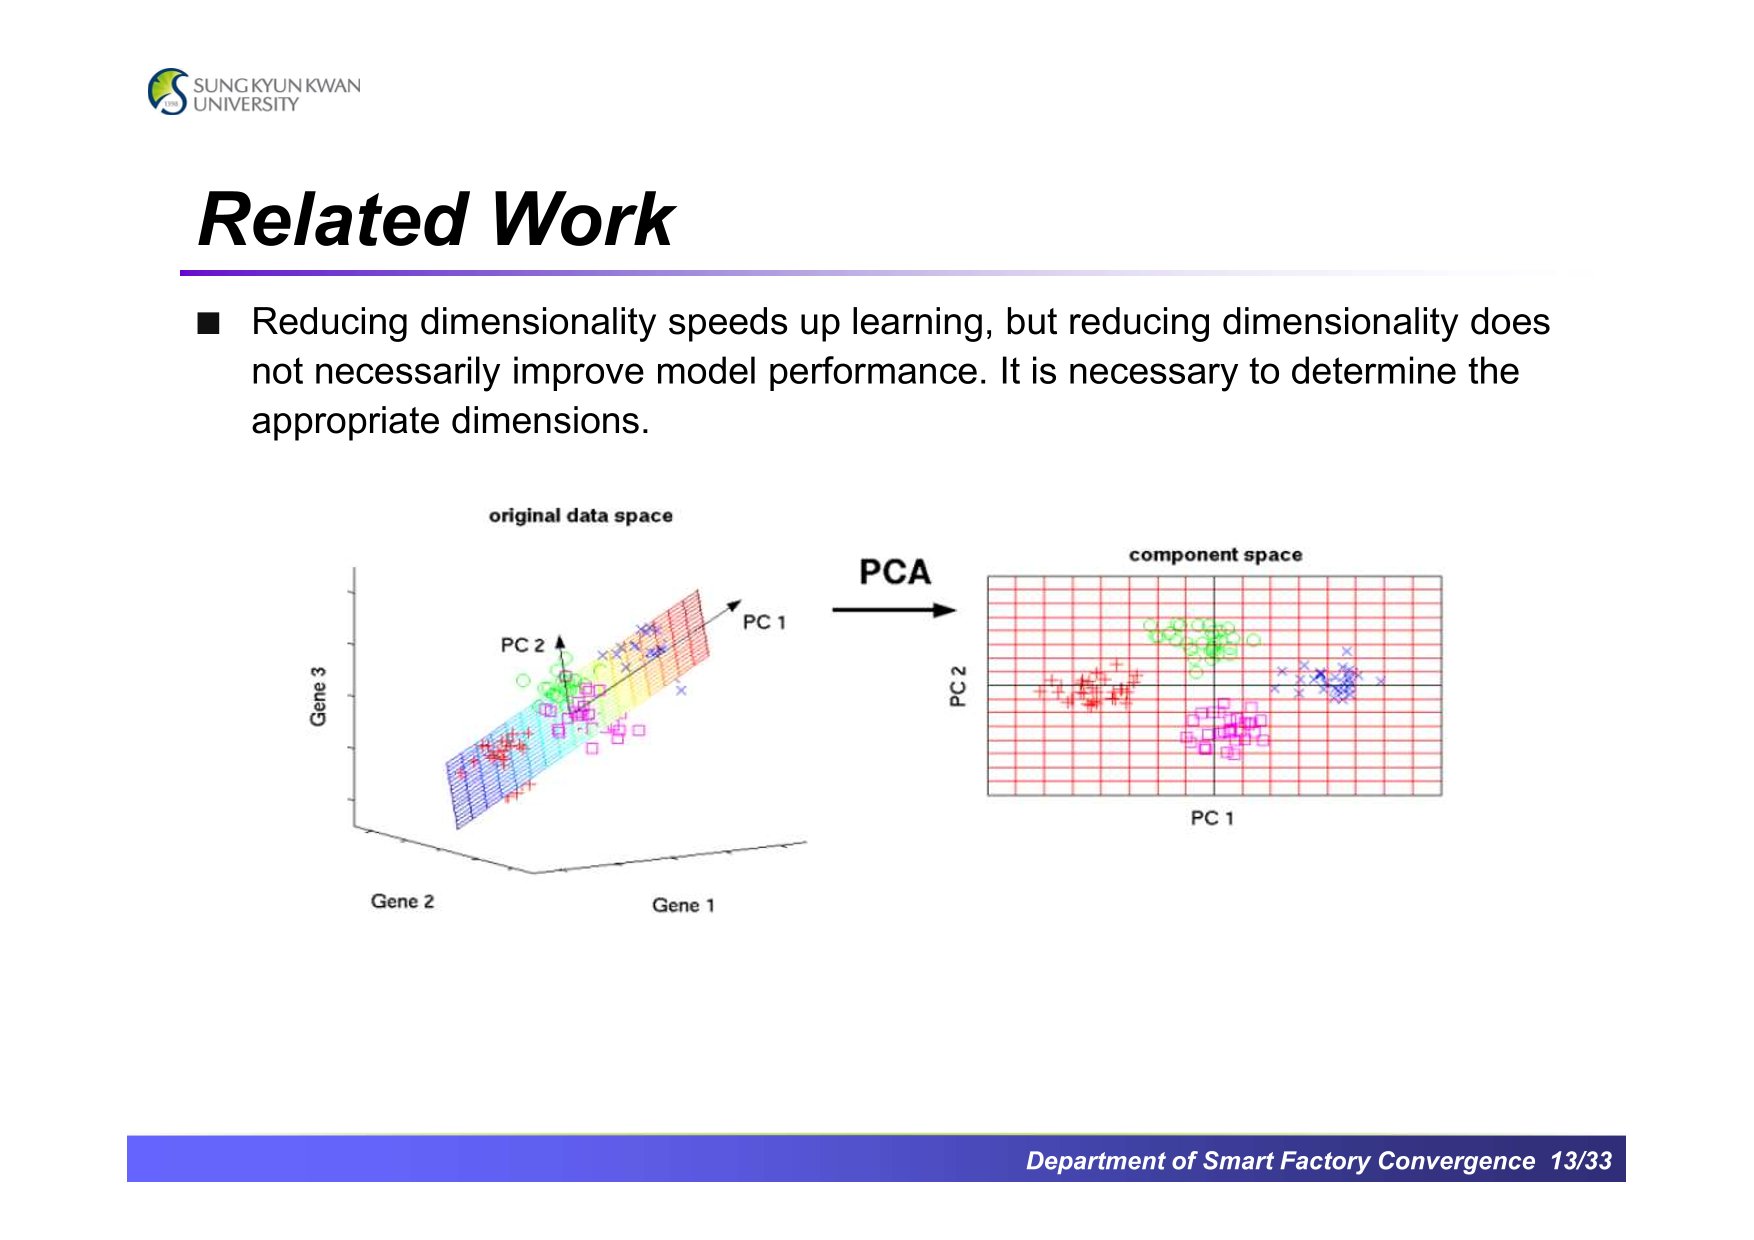 |
The Principal Component Analysis algorithm is one of the machine learning algorithms, that is useful to find the meaning of data by reducing the dimensions.
|
|
ICACT20240049 Slide.12
[Big slide for presentation]
|
Chrome Text-to-Speach Click!! |
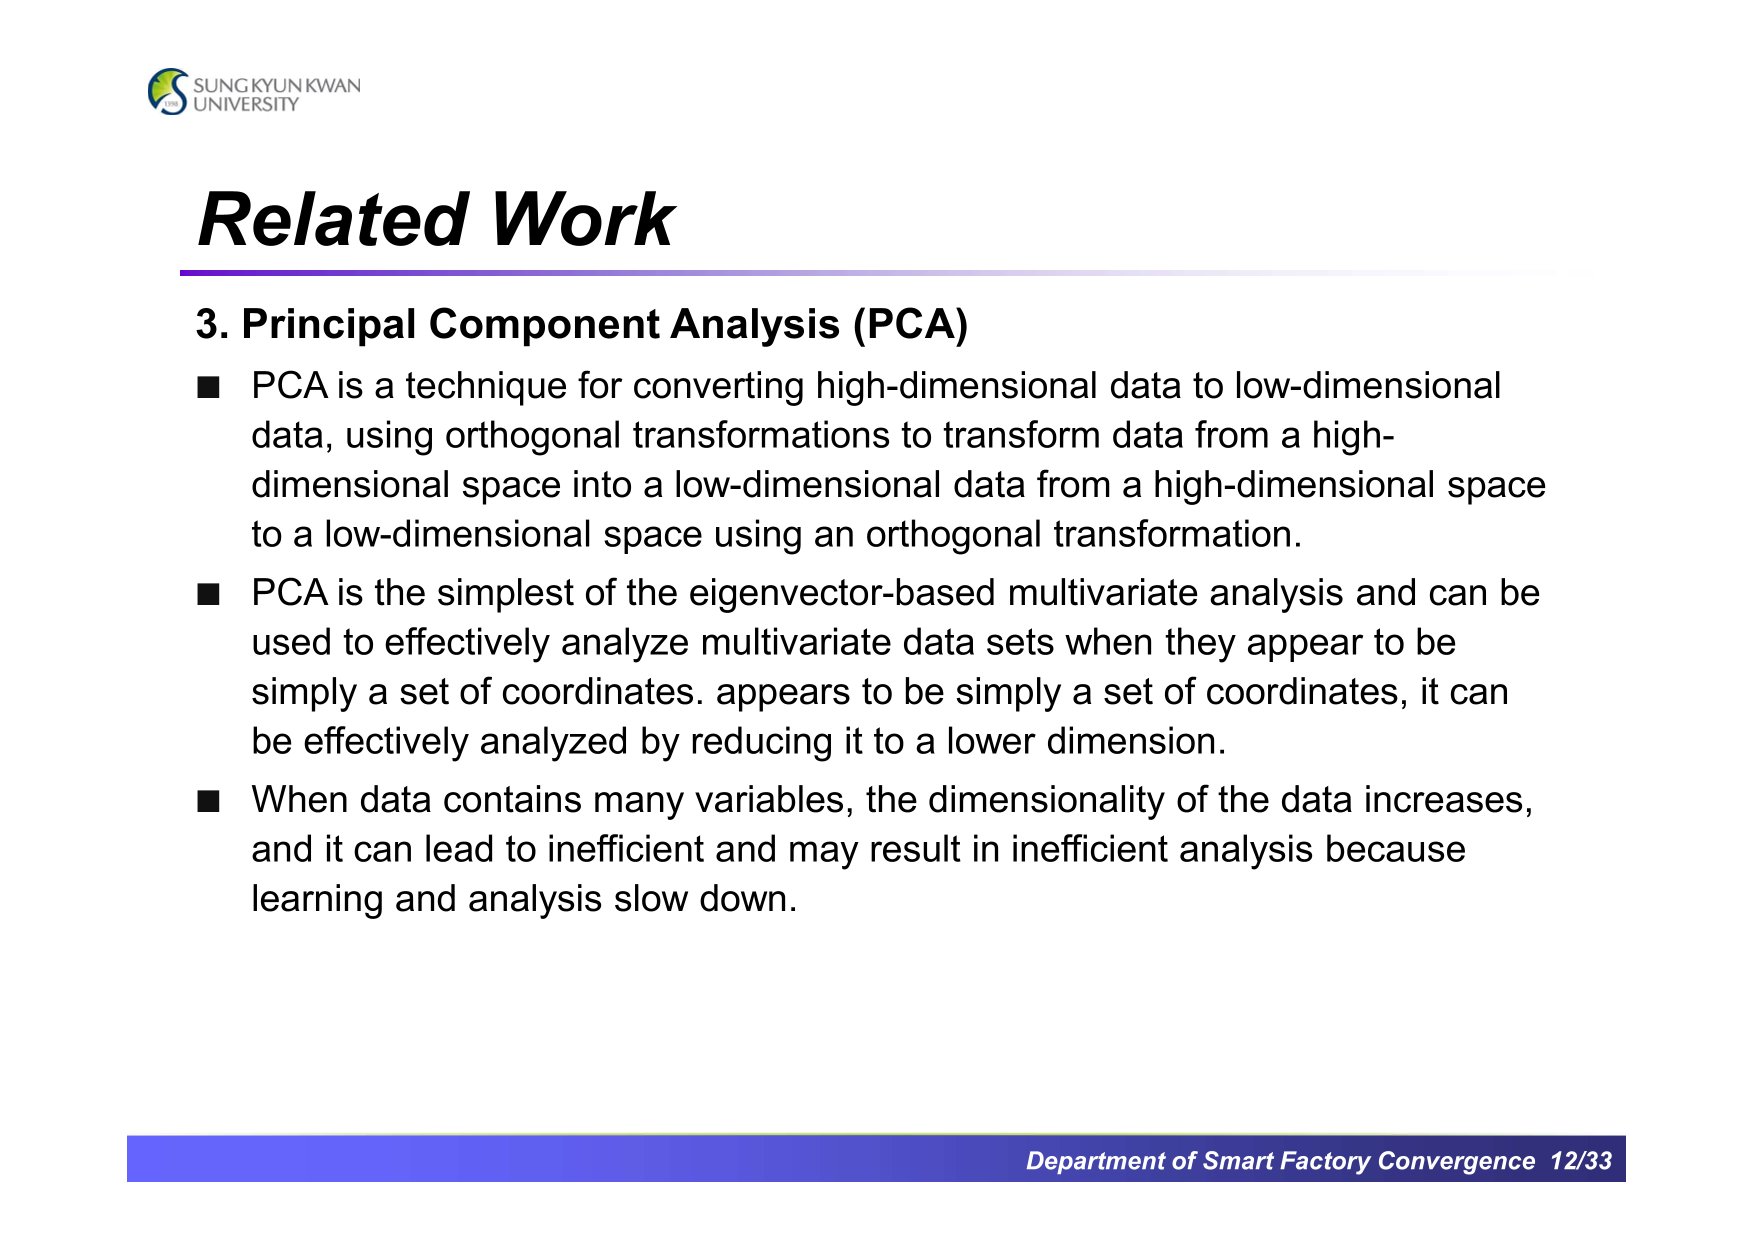 |
We investigated methods for both multivariate data analysis and anomaly detection. We found the PCA algorithm is used to utilize in multivariate data analysis and anomaly detection.
|
|
ICACT20240049 Slide.11
[Big slide for presentation]
|
Chrome Text-to-Speach Click!! |
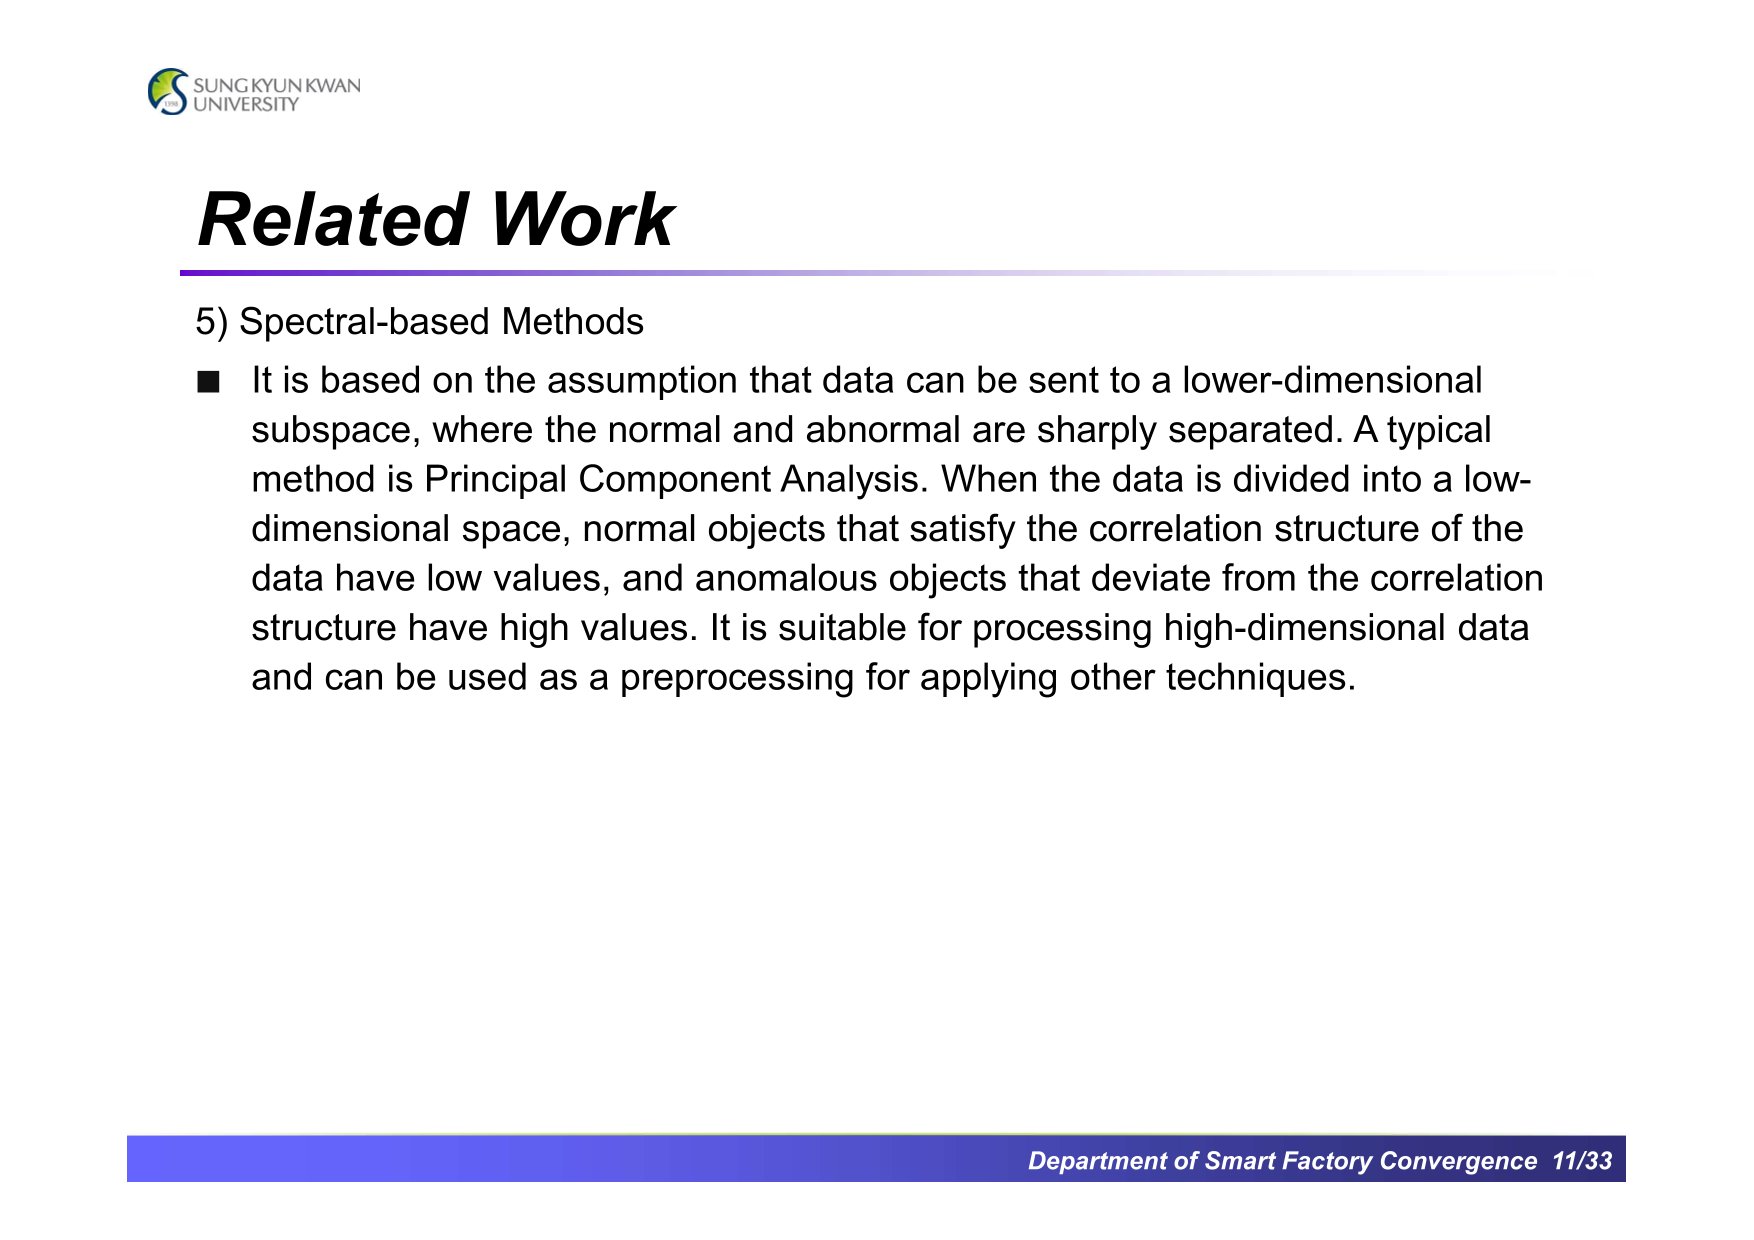 |
Spectral-based methods, ...
|
|
ICACT20240049 Slide.10
[Big slide for presentation]
|
Chrome Text-to-Speach Click!! |
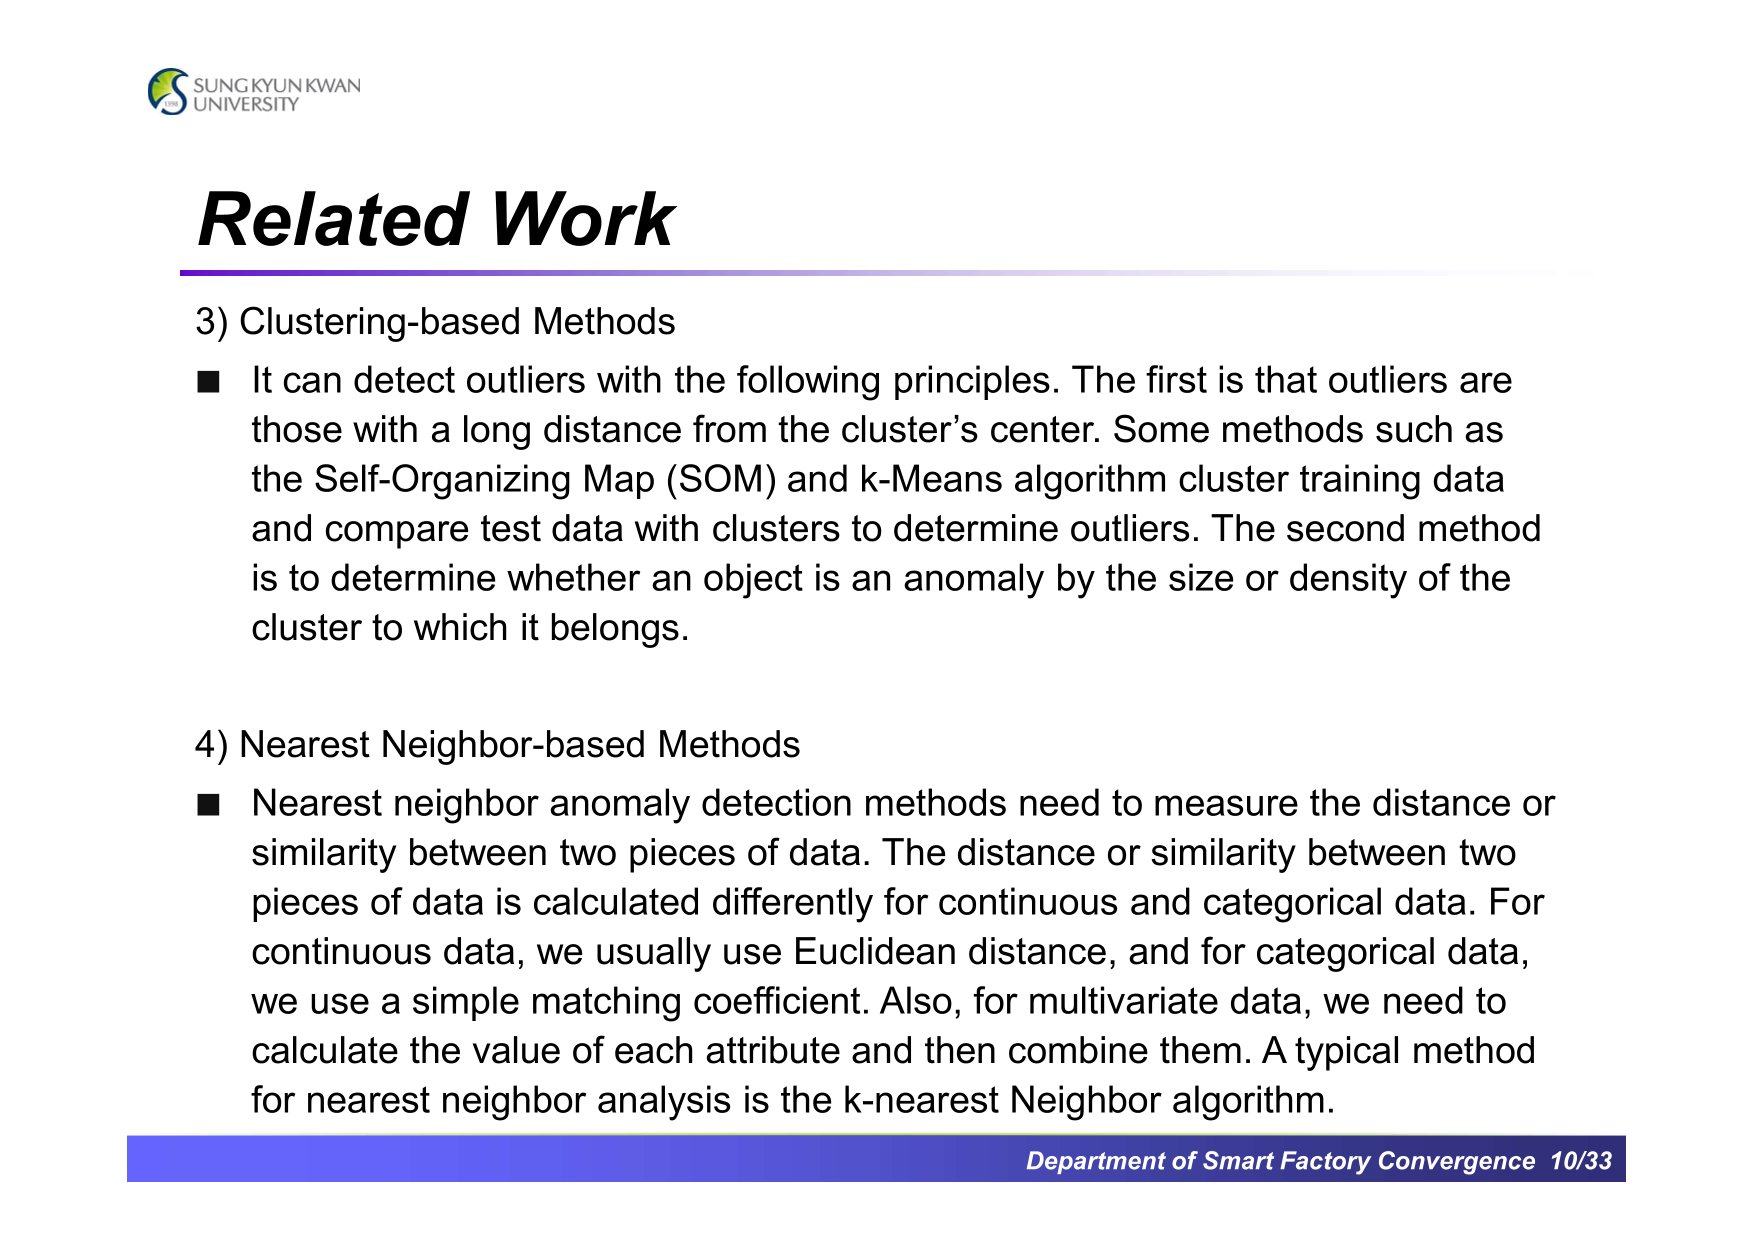 |
Cluster-based methods, Nearest Neighbor-based methods, ....
|
|
ICACT20240049 Slide.09
[Big slide for presentation]
|
Chrome Text-to-Speach Click!! |
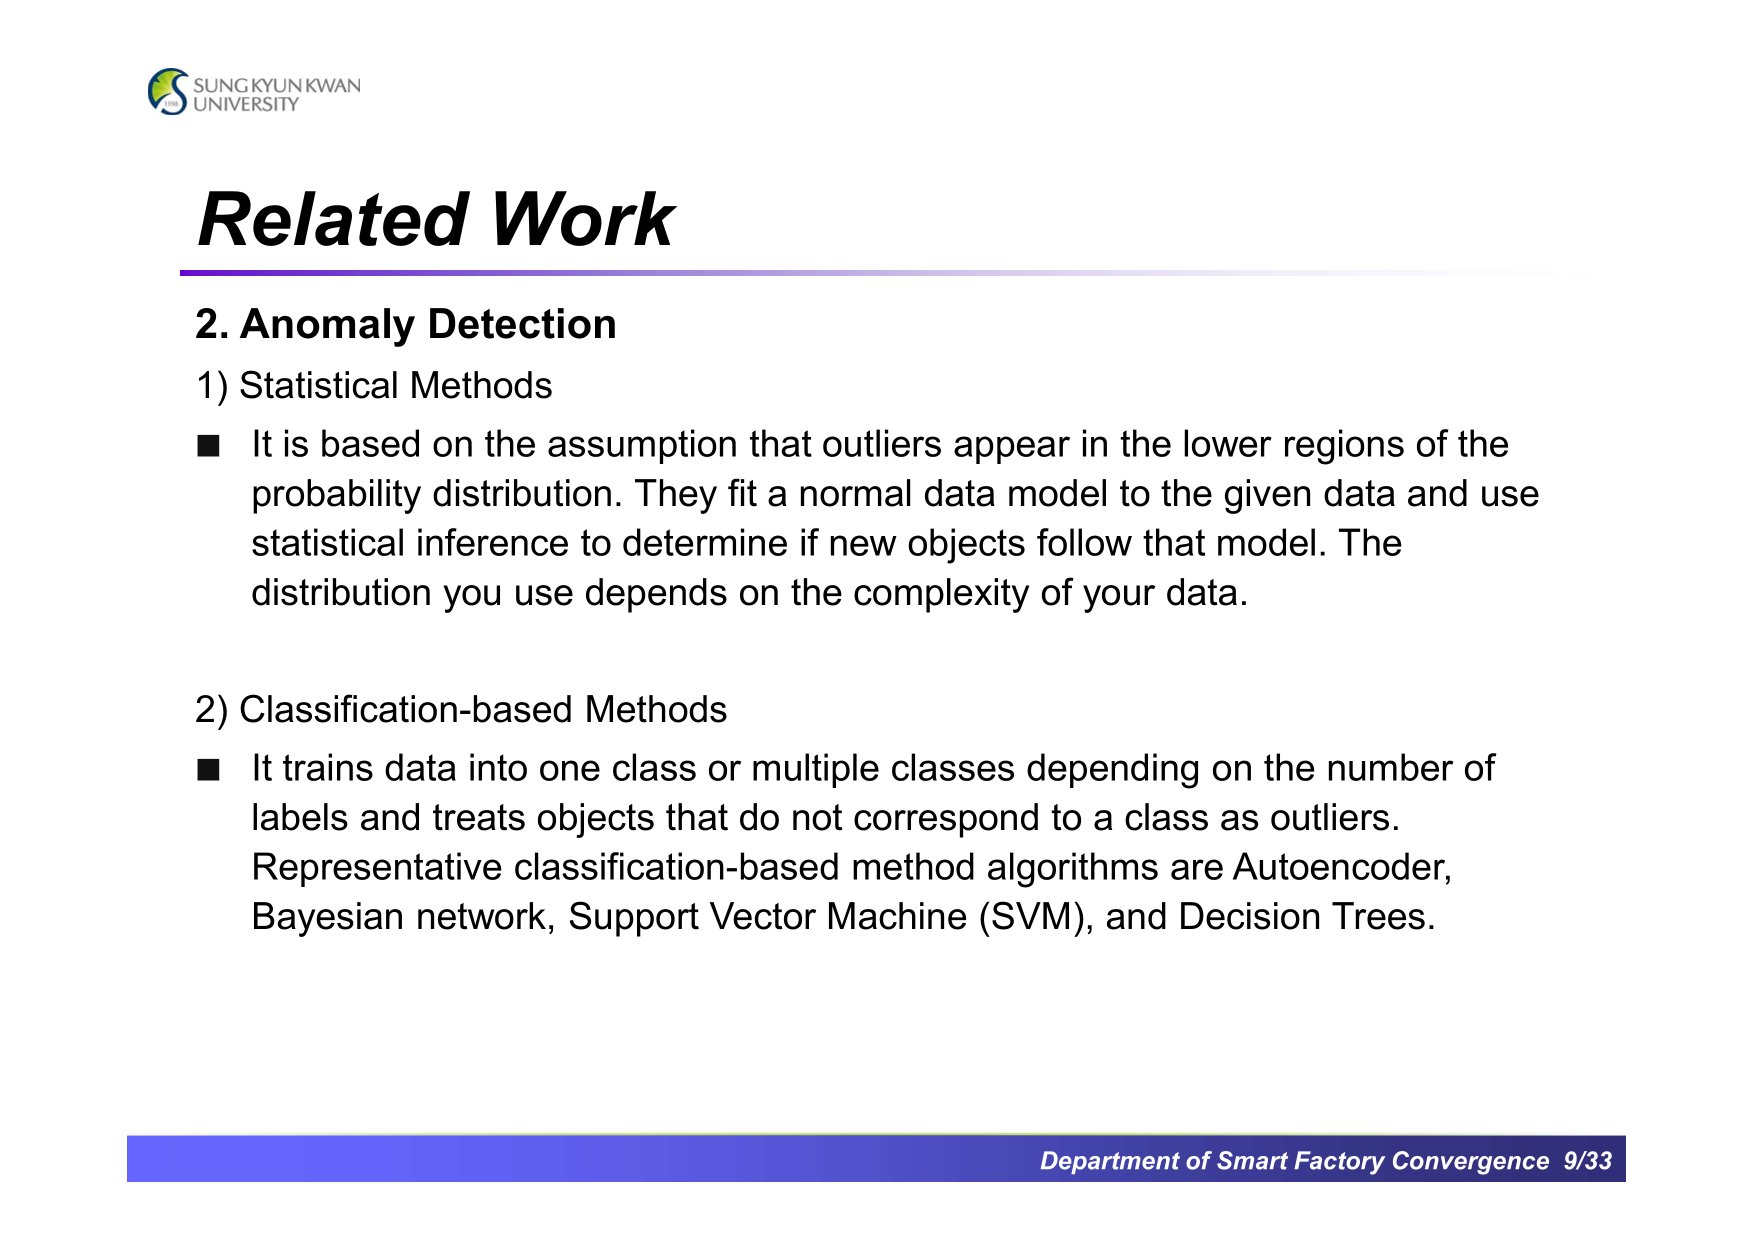 |
We also checked anomaly detection methods.
There are Statistical methods, Classification-based methods,...
|
|
ICACT20240049 Slide.08
[Big slide for presentation]
|
Chrome Text-to-Speach Click!! |
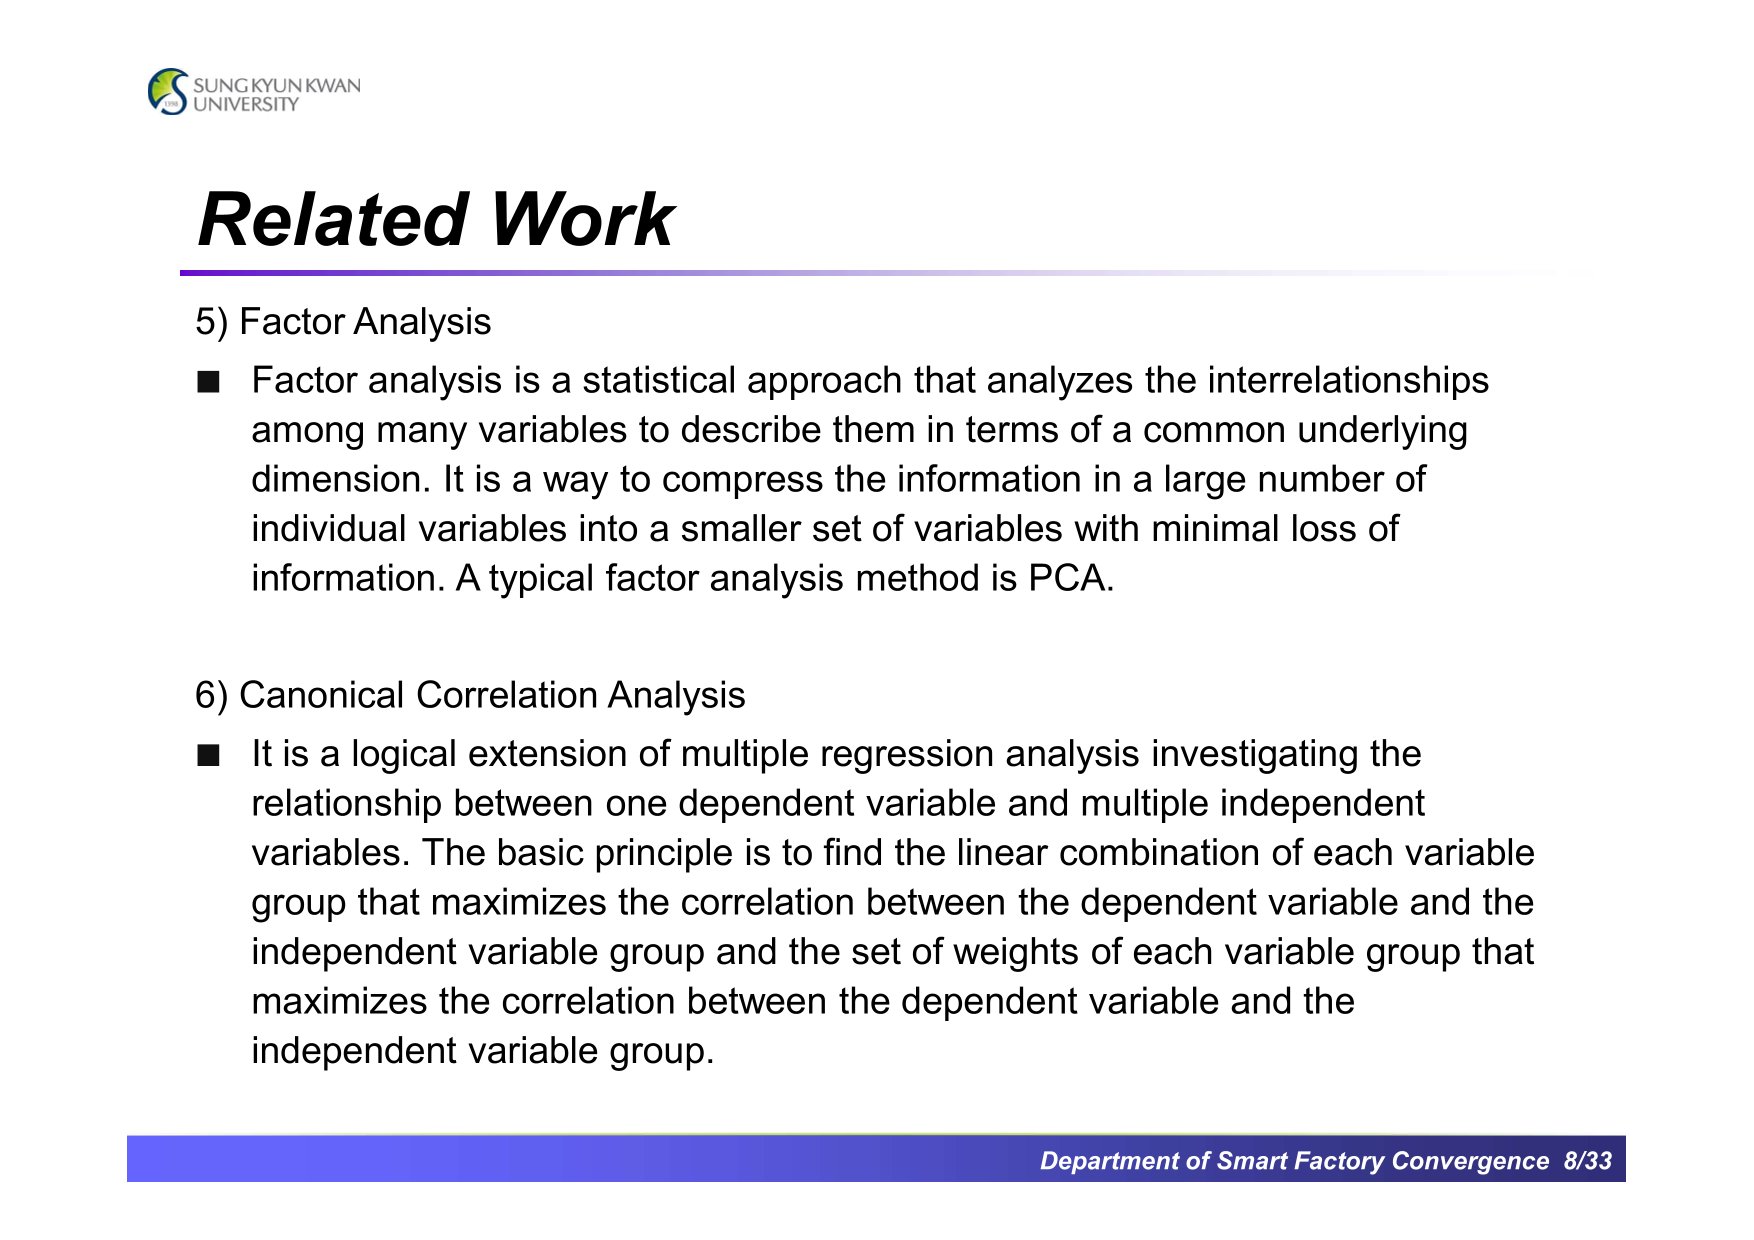 |
Factor Analysis, Correlation Analysis ...
|
|
ICACT20240049 Slide.07
[Big slide for presentation]
|
Chrome Text-to-Speach Click!! |
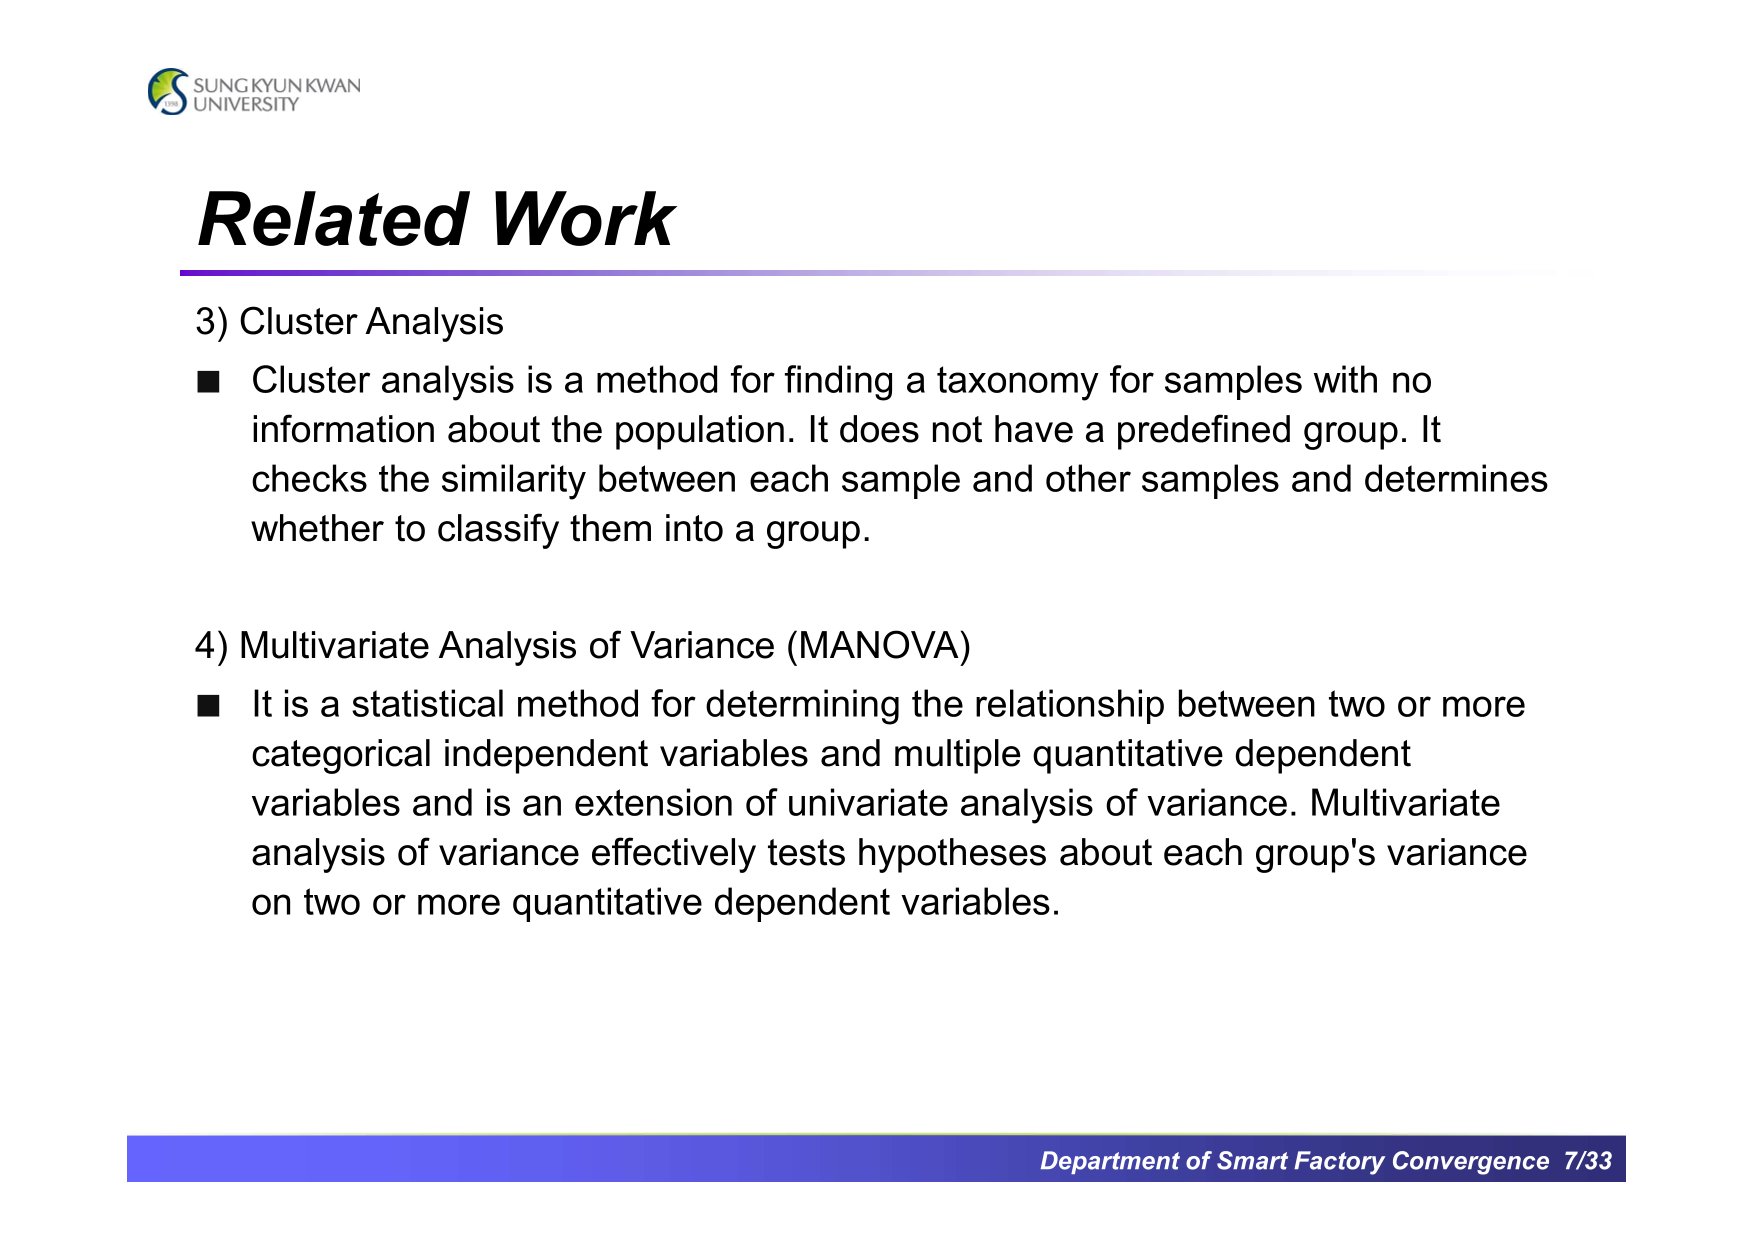 |
Cluster Analysis, MANOVA, ...
|
|
ICACT20240049 Slide.06
[Big slide for presentation]
|
Chrome Text-to-Speach Click!! |
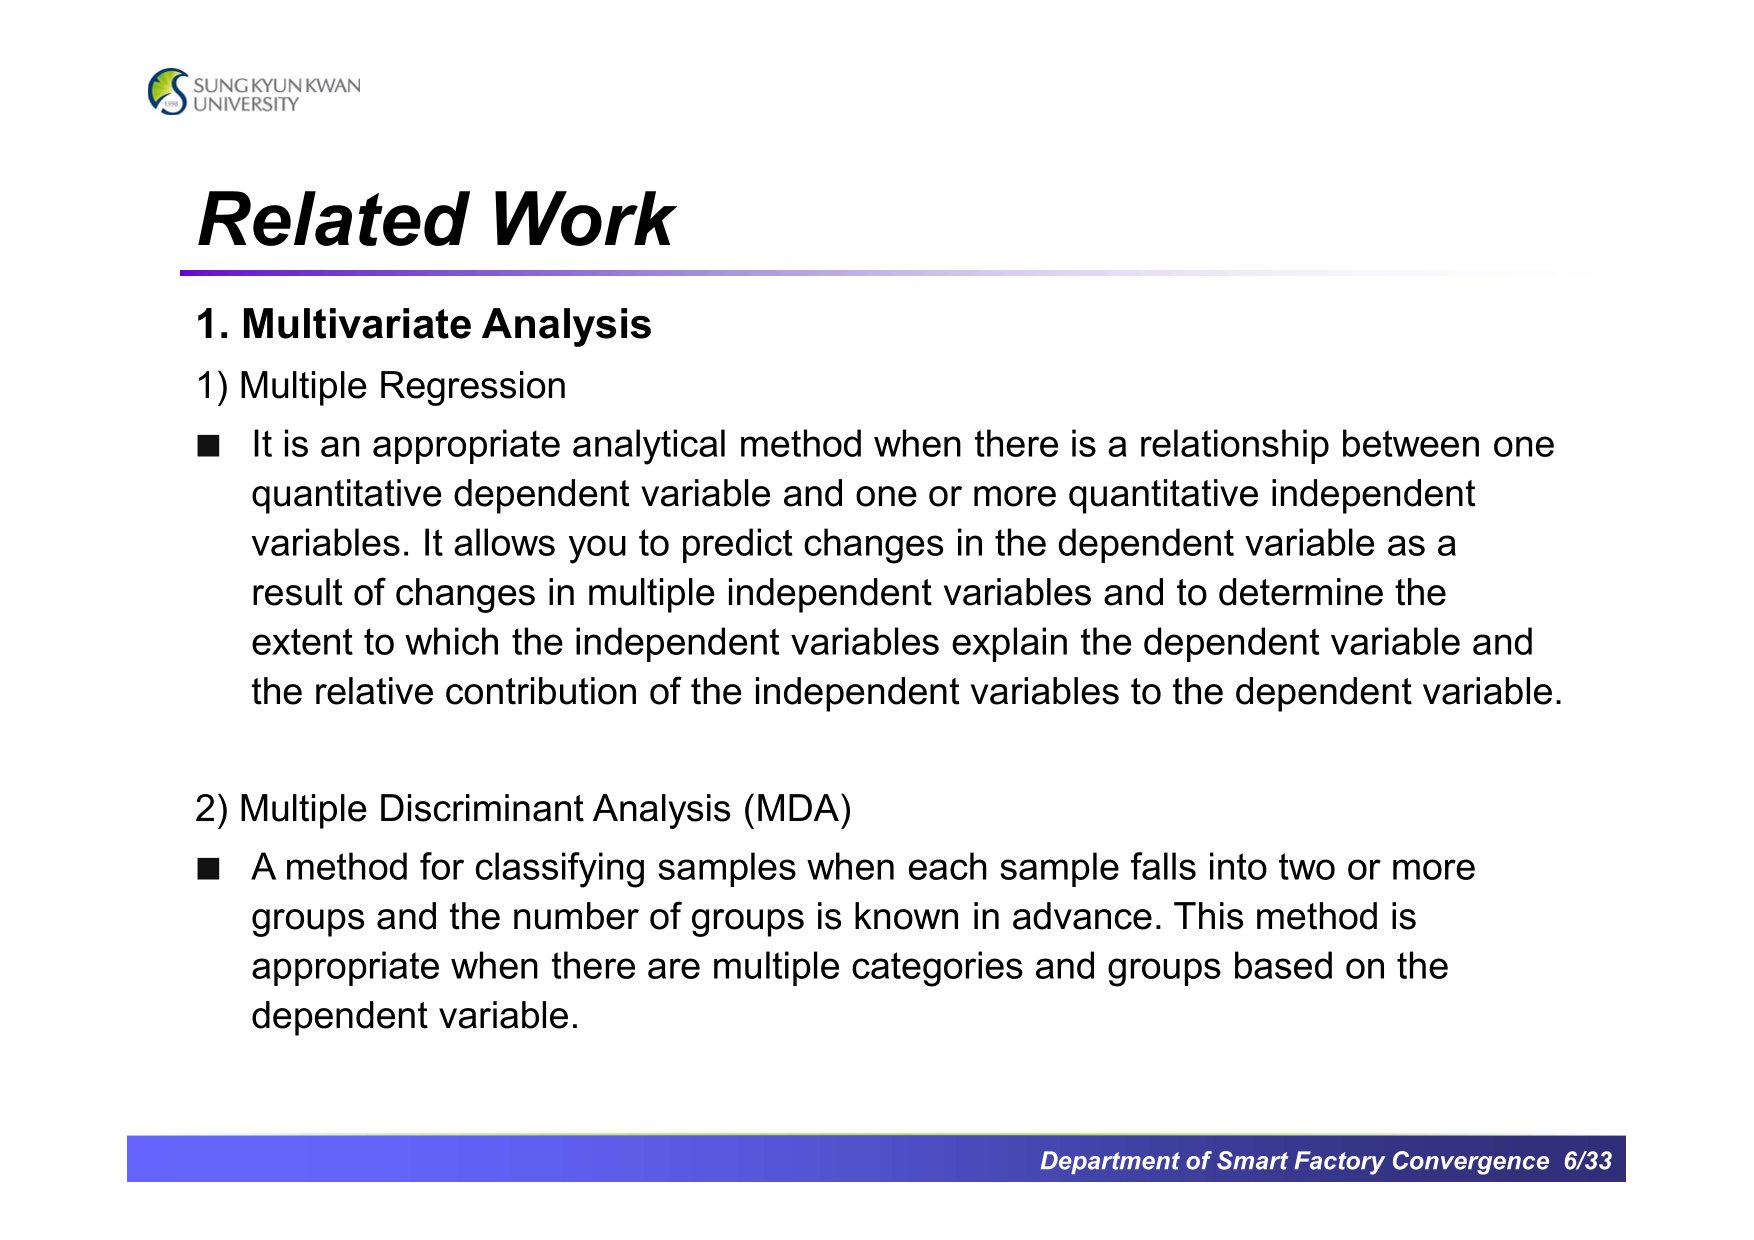 |
First, we checked the multivariate analysis methods.
Methods are Multiple Regression, MDA, ...
|
|
ICACT20240049 Slide.05
[Big slide for presentation]
|
Chrome Text-to-Speach Click!! |
 |
Related work
|
|
ICACT20240049 Slide.04
[Big slide for presentation]
|
Chrome Text-to-Speach Click!! |
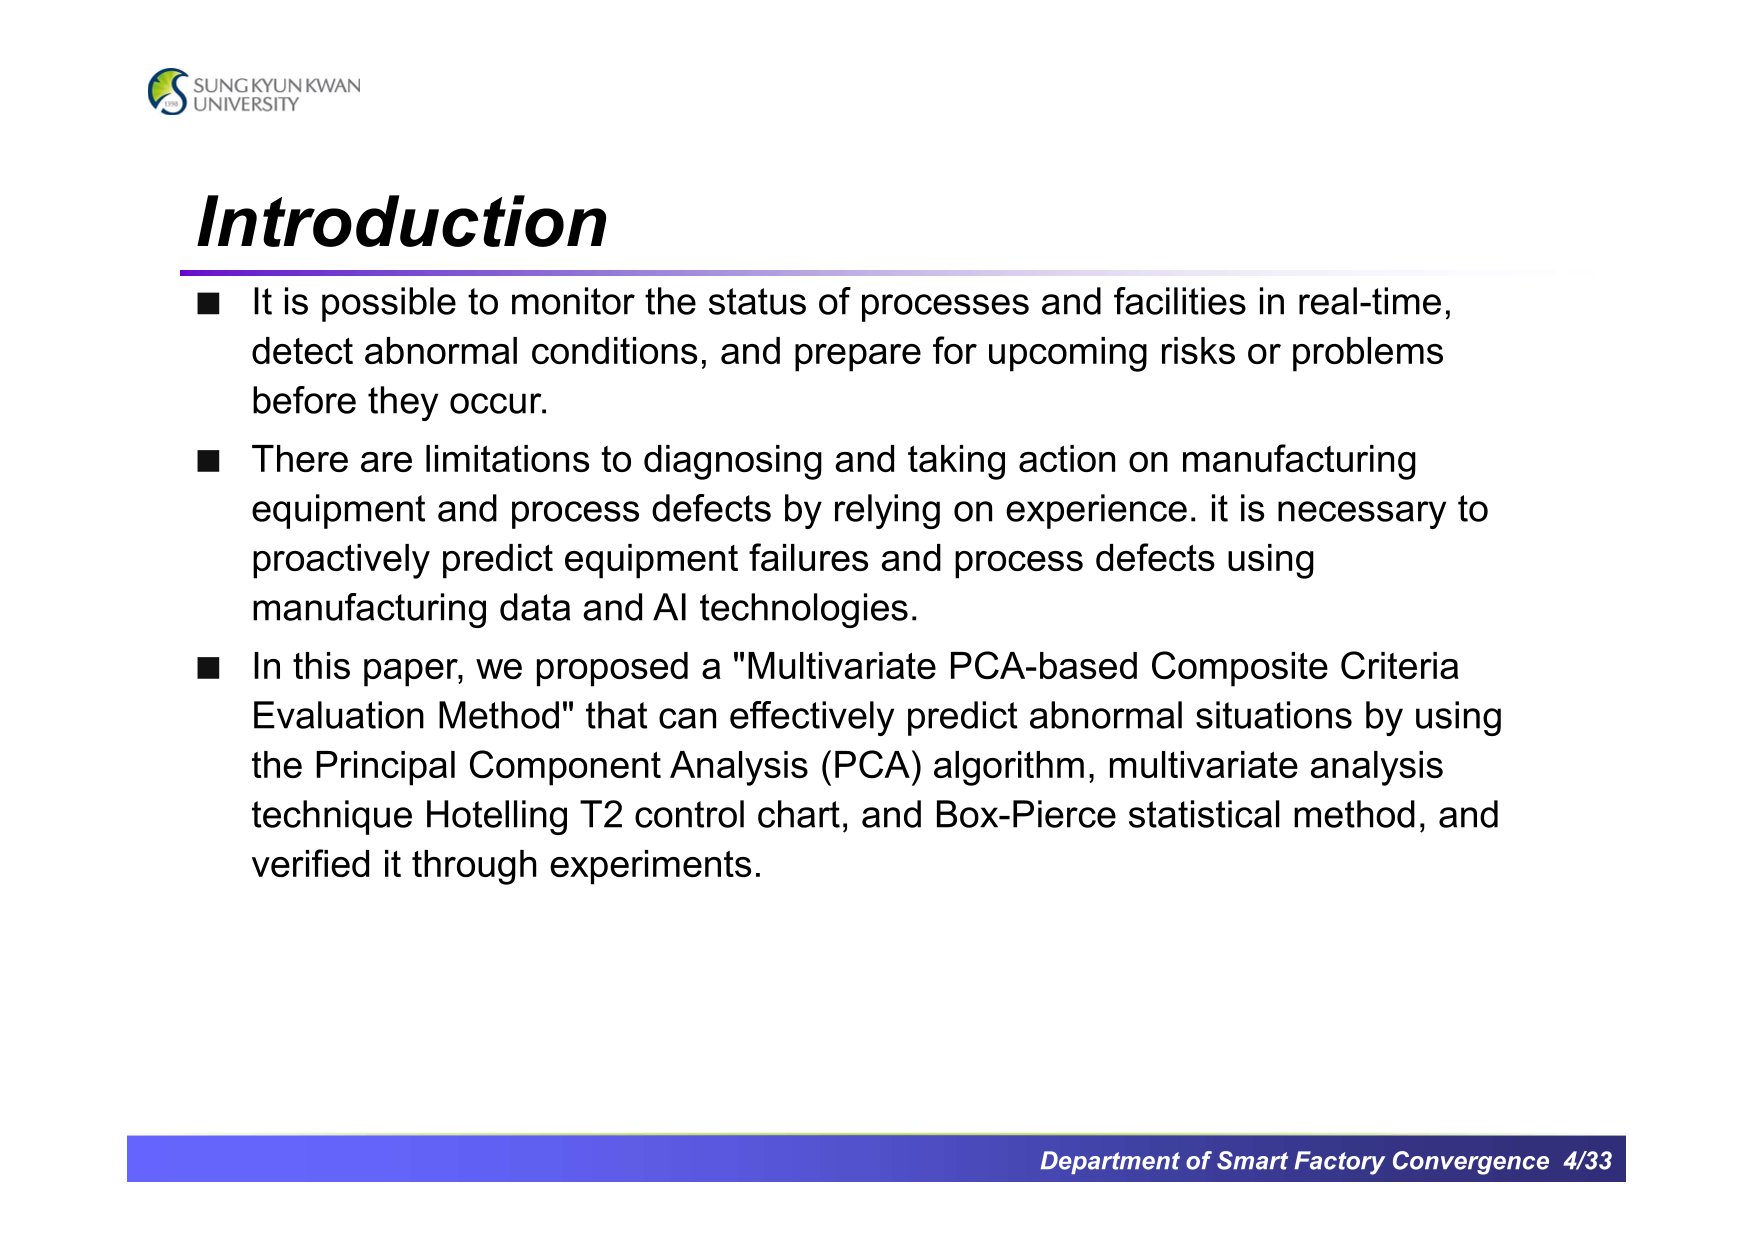 |
In manufacturing, it's very expensive to do something for equipment or processes after they go wrong. Therefore, it is important to predict problems before they occur and take action to prevent them from happening. To do this, you need to monitor data from the manufacturing site, and if you expect an abnormal situation, you need to check and take necessary actions before the problem occurs. To do this, the following technologies are required. First, an unsupervised learning-based data analysis can be considered to analyze raw data from the field immediately; second, a multivariate analysis is required to analyze many data variables with comprehensive results; and third, an anomaly detection method is required. The paper proposes and validates a method "Multivariate PCA-based Composite Criteria Evaluation Method" for unsupervised learning-based anomaly detection using a combination of Principal Component Analysis algorithm and two kinds of statistical techniques Hotelling T2 control chart and Box-Pierce test. The proposed method has been applied to a product called THiRA Analytics and has been validated in a semiconductor factory and conducted many PoCs for various industries.
|
|
ICACT20240049 Slide.03
[Big slide for presentation]
|
Chrome Text-to-Speach Click!! |
 |
Introduction ..
|
|
ICACT20240049 Slide.02
[Big slide for presentation]
|
Chrome Text-to-Speach Click!! |
 |
The presentation was organized as follows.
|
|
ICACT20240049 Slide.01
[Big slide for presentation]
|
Chrome Text-to-Speach Click!! |
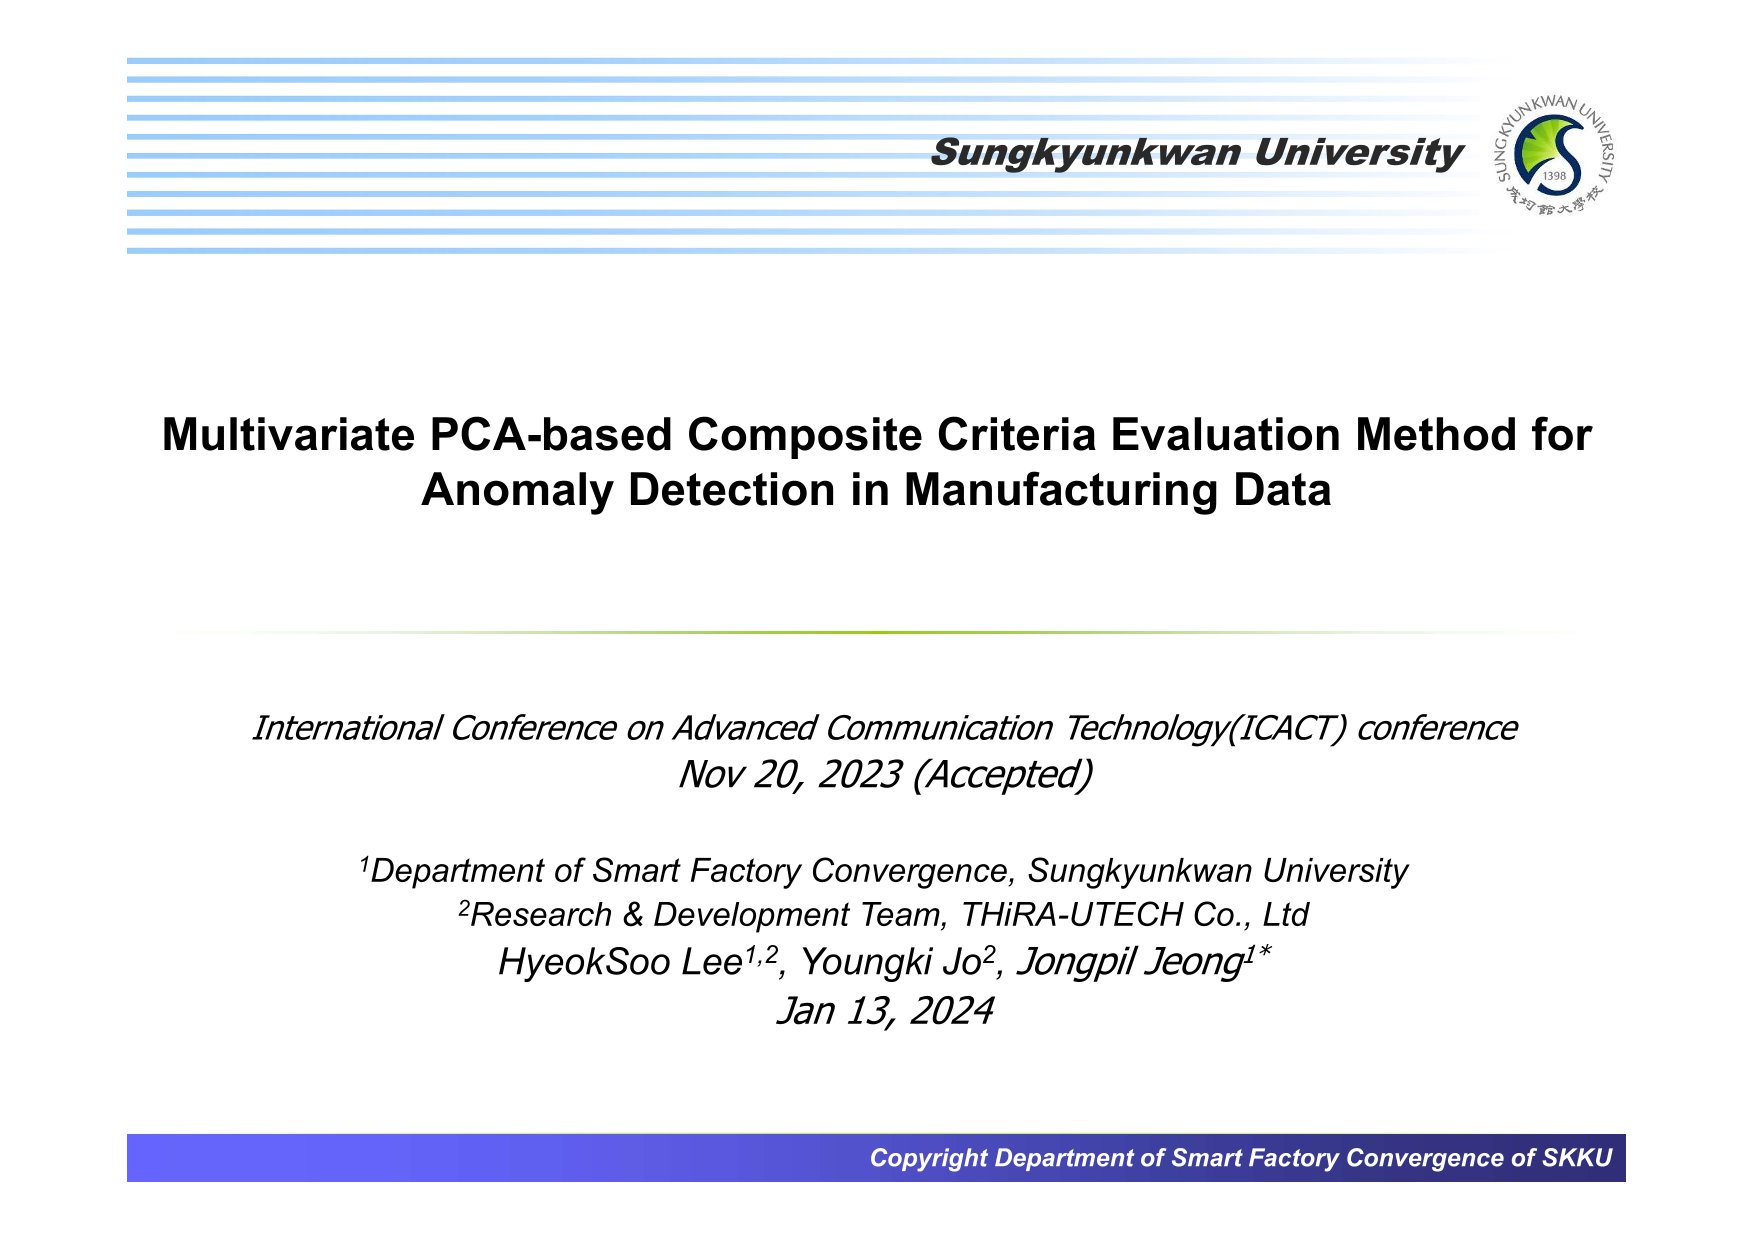 |
Good afternoom. It is a great honor to present our paper in front of you at ICACT 2024. The paper I am presenting today was prepared with two other people. One is HyeokSoo Lee, the first author of this paper, who is currently in charge of the R&D team at THiRA-UTECH and is a PhD student at Sungkyunkwan University's Department of Smart Factory Convergence. The other person is Prof. Jongpil Jung, Department of Smart Factory Convergence, Sungkyunkwan University. My name is Youngki Jo, and I am working for AI in the R&D team at THiRA-UTECH. Initially, the first author was planned to have this presentation, but due to an important schedule at his job, he was unable to attend, so I would like to have this presentation on his behalf.
THiRA-UTECH is a professional company in smart factory and factory automation, we have various software products required for smart factories and factory automation. We are recently expanding our business areas such as robotics and logistics.
|
|
ICACT20240049 Slide.00
[Big slide for presentation]
|
Chrome Text-to-Speach Click!! |

















