 ICACT20240043 Slide.16
[Big slide for presentation] |
Chrome Text-to-Speach Click!! |
 |
Thanks!
|
|
ICACT20240043 Slide.15
[Big slide for presentation]
|
Chrome Text-to-Speach Click!! |
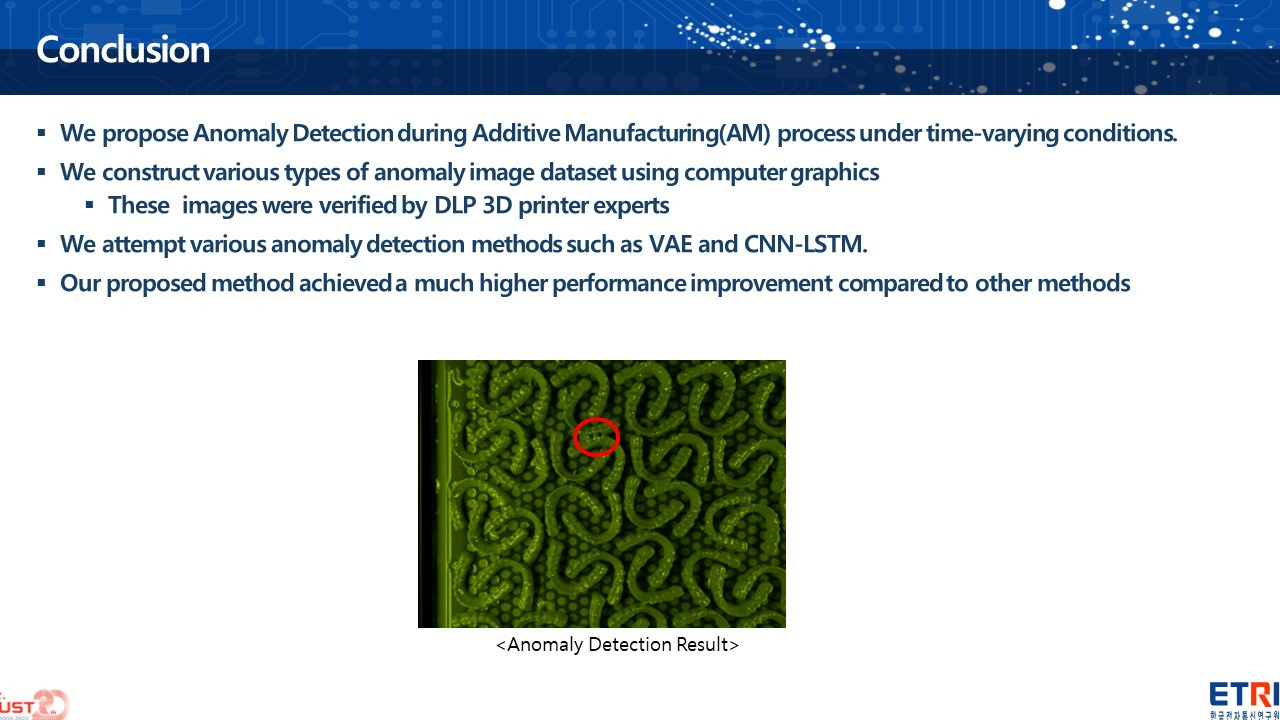 |
In conclusion, our research aimed to advance Anomaly Detection in the Additive Manufacturing process, especially under the complexities of time-varying conditions. We have successfully constructed a diverse set of anomaly images using computer graphics, which were further validated by experts in DLP 3D printing.
We explored various anomaly detection methods, including Variational Autoencoders and CNN-LSTMs, to tackle the challenge. However, it was our proposed CNN model that stood out, achieving a substantial improvement in performance with an accuracy of 97.45%, as demonstrated in our experimental results.
The image below highlights the efficacy of our method, where an anomaly detected by our system is circled in red. This validates our approach and offers a promising direction for future research in ensuring the quality and reliability of 3D printed products.
|
|
ICACT20240043 Slide.14
[Big slide for presentation]
|
Chrome Text-to-Speach Click!! |
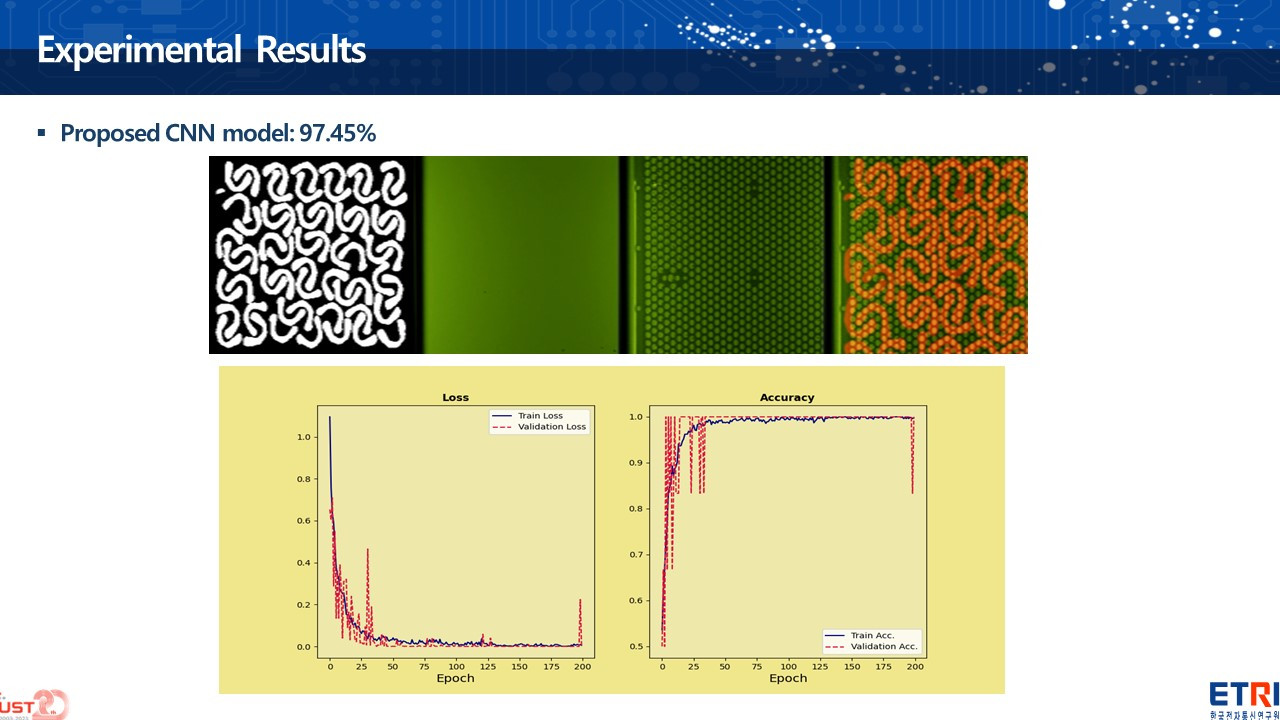 |
This slide presents the experimental results for a proposed CNN model, which achieved a high accuracy of 97.45%. The top of the slide displays four images, representing input data. Below, two graphs chart the model's performance over 200 epoch.
Compared to the previously mentioned VAE and CNN-LSTM models, this proposed CNN model shows superior performance based on the accuracy metric provided.
|
|
ICACT20240043 Slide.13
[Big slide for presentation]
|
Chrome Text-to-Speach Click!! |
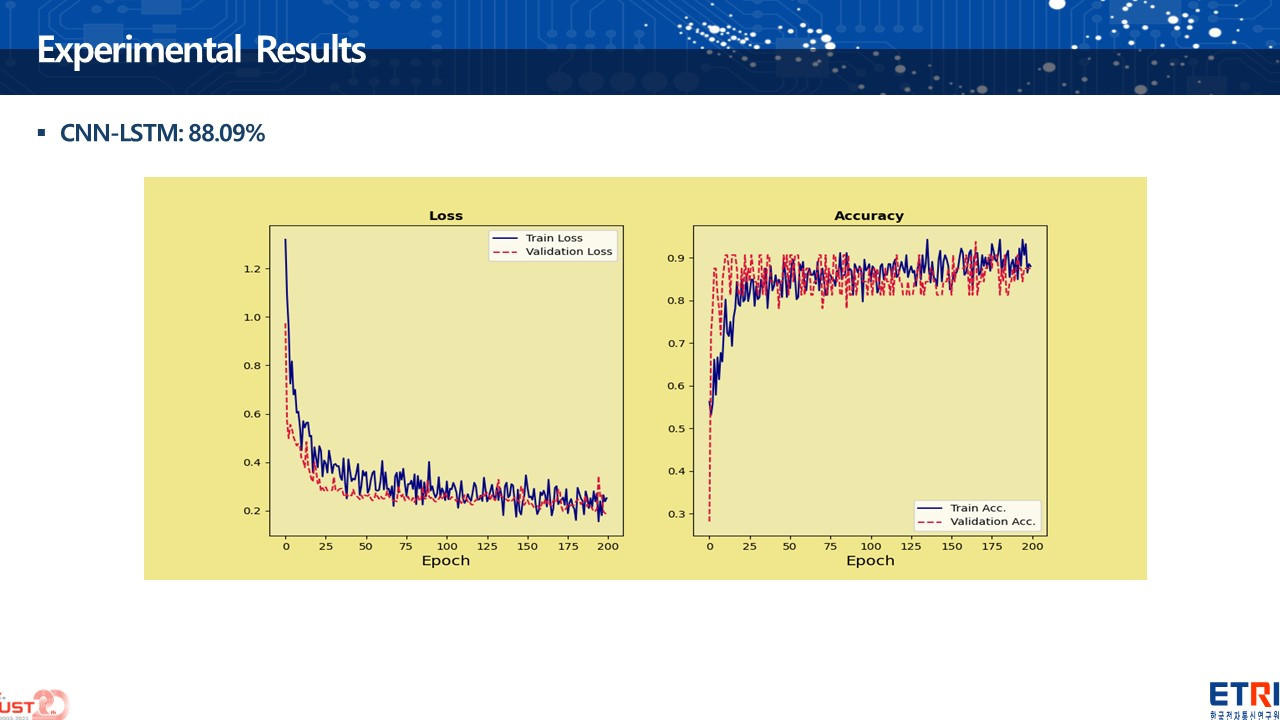 |
This slide presents the experimental results for a CNN-LSTM model, which achieved an accuracy of 88.09%. The graphs depict the model's performance over 200 epochs. The left graph shows the training and validation loss decreasing over time, indicating the model is learning effectively. The right graph displays the training and validation accuracy, both of which stabilize at high levels as the epochs increase, demonstrating that the model is performing well at classifying the data. Compared to the previous VAE model, the CNN-LSTM shows a significant improvement in accuracy, suggesting it is better suited for this particular anomaly detection task.
|
|
ICACT20240043 Slide.12
[Big slide for presentation]
|
Chrome Text-to-Speach Click!! |
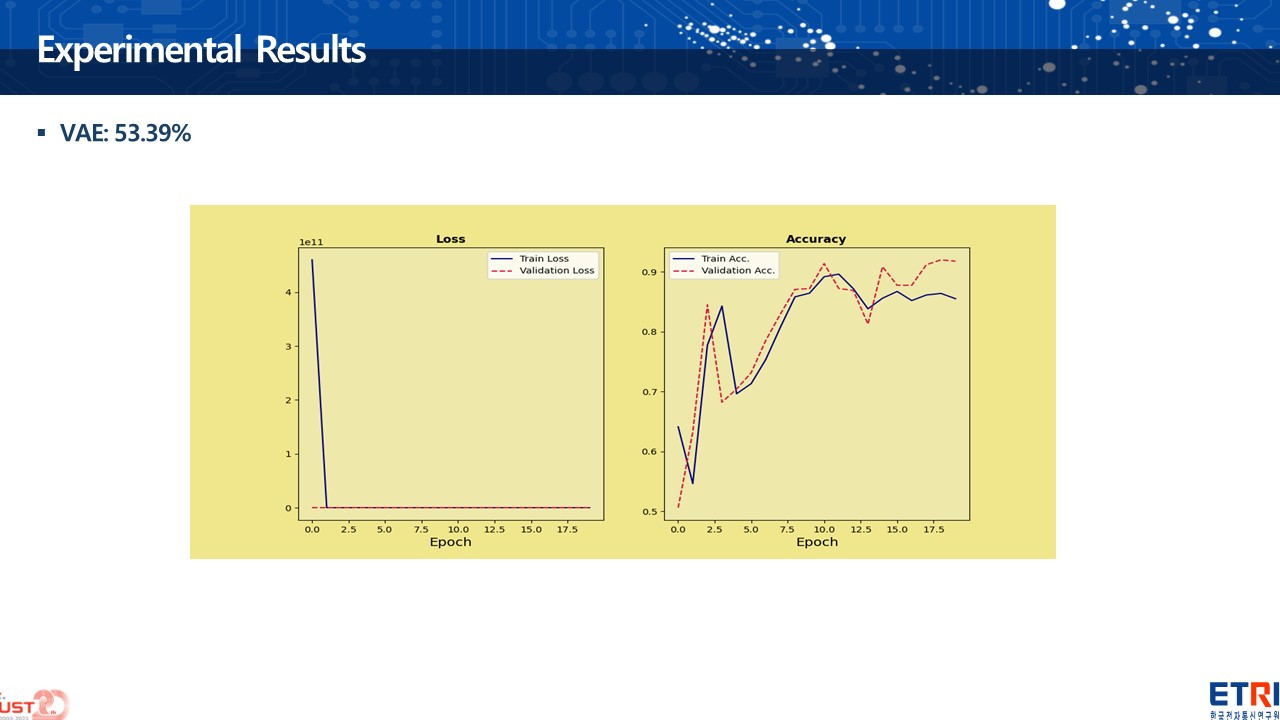 |
This slide presents experimental results for a Variational Autoencoder (VAE) model with a final accuracy of 53.39%.
The aim of two graphs is to evaluate the performance of the VAE over time, with the goal of minimizing loss and maximizing accuracy.
|
|
ICACT20240043 Slide.11
[Big slide for presentation]
|
Chrome Text-to-Speach Click!! |
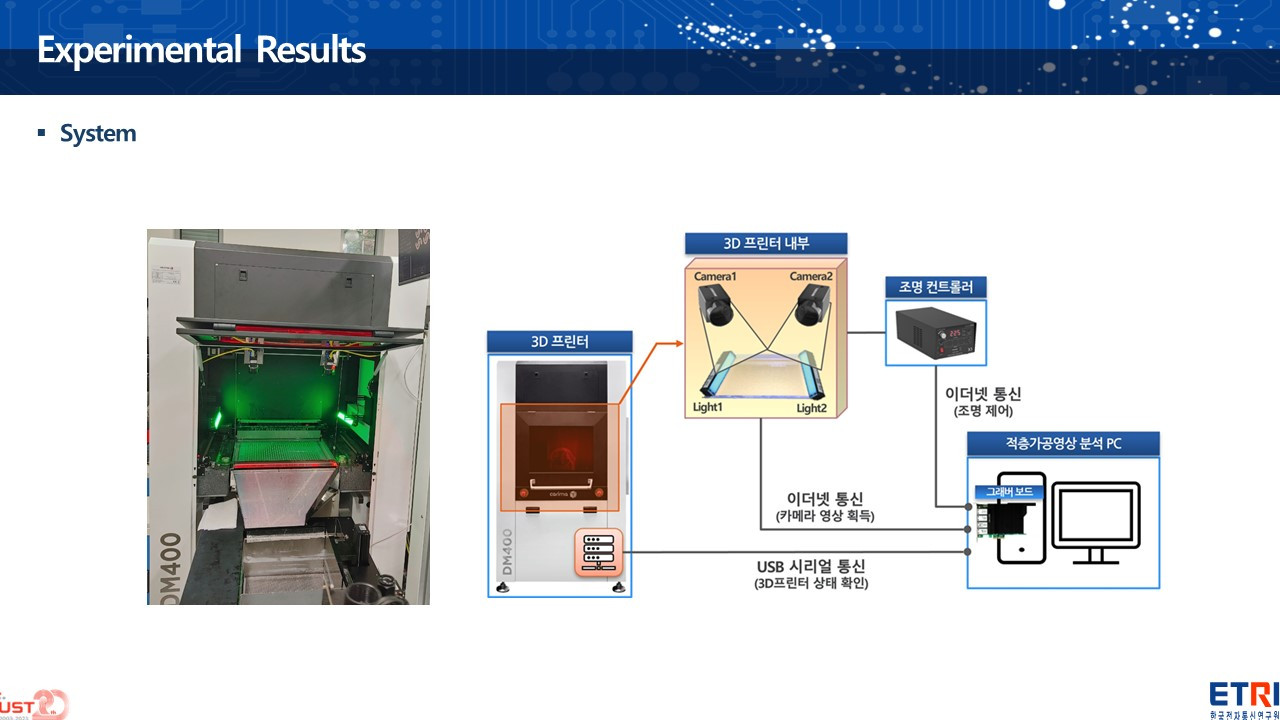 |
This slide appears to show the setup of a system used for experimental results in this study involving DLP 3D printing. The left part of the slide features an real DLP printing system.
On the right, a schematic represents the internal components and layout of the 3D printer setup of the real system. We equip two cameras and two lights positioned inside the printer, for monitoring and quality control purposes during the printing process. The data collected by the cameras are sent to a control computer, as indicated by the diagram showing connections to a main control unit and an interface computer, which are used for processing the data or controlling the printer's operations.
The system is designed to detect anomalies during the printing process
|
|
ICACT20240043 Slide.10
[Big slide for presentation]
|
Chrome Text-to-Speach Click!! |
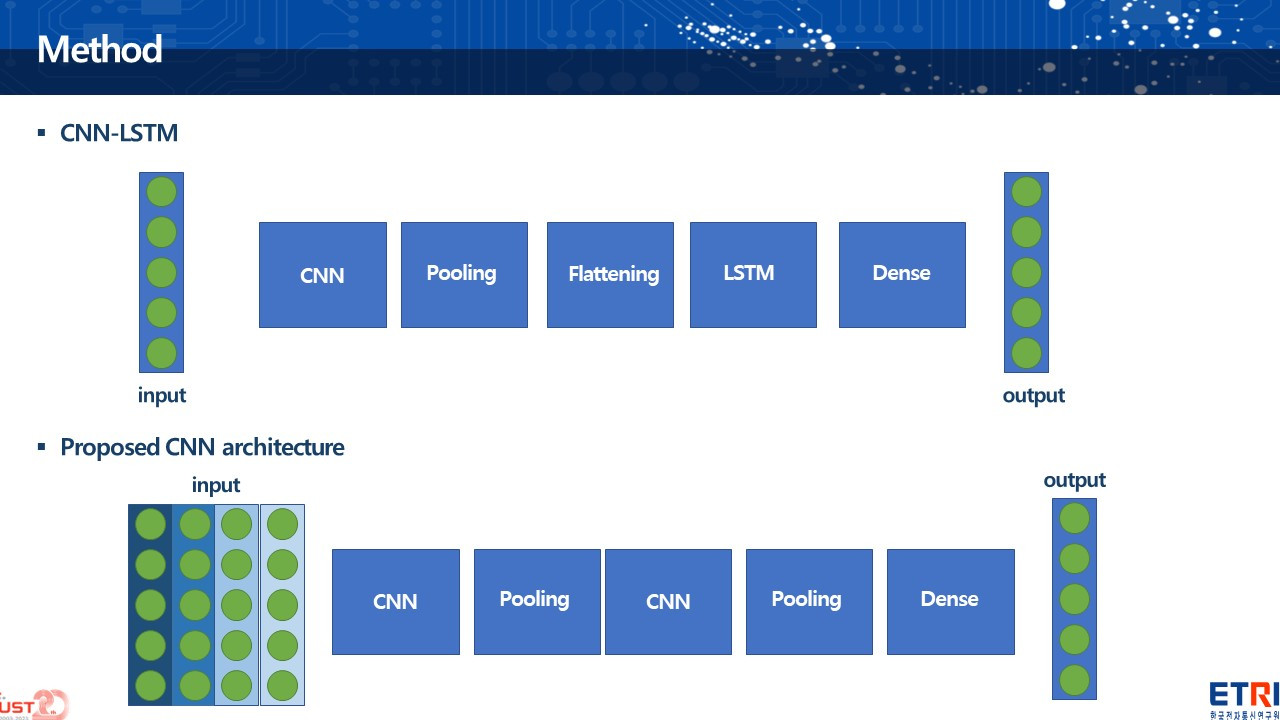 |
This slide presents two neural network architectures for processing sequential or time-series data:
CNN-LSTM Architecture: This combines Convolutional Neural Networks (CNNs) and Long Short-Term Memory (LSTM) networks. The architecture takes an input, processes it through CNN layers to extract spatial features, which are then downsampled by pooling layers. The data is flattened and passed through LSTM layers to capture temporal dependencies before a final dense layer outputs the results.
Proposed CNN Architecture: The second architecture is our proposed CNN model, consisting of alternating convolutional and pooling layers that process the input, extract features, and downsample them to reduce dimensionality. This is followed by a dense layer for output generation.
The most important thing is the input of this architecture. Our inputs consist of four images, not only one image, which enables us to represent time series data.
|
|
ICACT20240043 Slide.09
[Big slide for presentation]
|
Chrome Text-to-Speach Click!! |
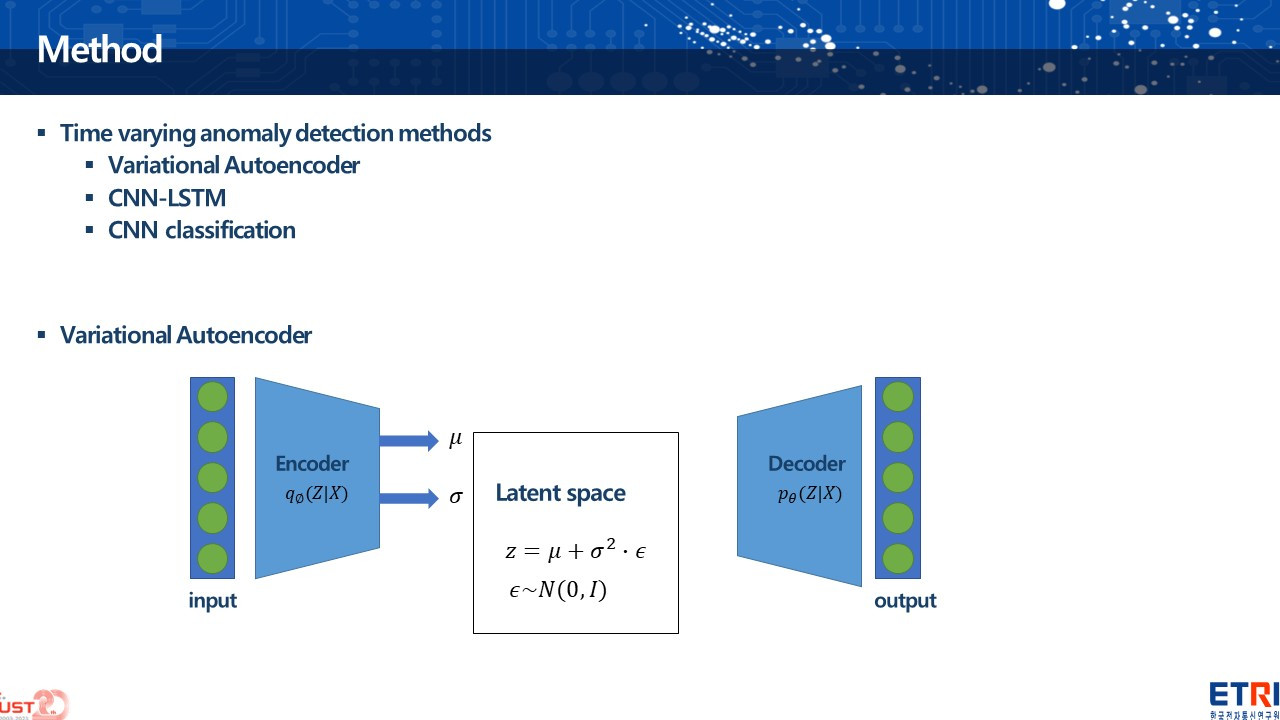 |
This slide outlines various methods for detecting time-varying anomalies. It mentions three anomaly detection methods:
Variational Autoencoder: A generative model that learns to encode input data into a lower-dimensional latent space and then decode it back to the original dimensionality with the goal of capturing the most salient features of the data.
CNN-LSTM: A combination of Convolutional Neural Networks (CNNs) and Long Short-Term Memory (LSTM) networks, likely used to capture both spatial and temporal features in data.
CNN classification: A method that employs CNNs for feature extraction and classification tasks.
The diagram illustrates the VAE, which consists of two main components: an encoder that maps the input data to the latent space and a decoder that reconstructs the data from the latent space. The encoder produces two outputs for each input: a mean (µ) and a standard deviation (σ), which are used to sample from the latent space assuming a normal distribution (ε~N(0,I)). This sampled point is then fed into the decoder to generate the output, which is the reconstruction of the original input. This process allows the VAE to not only learn the most essential features but also to generate new data by sampling from the latent space.
|
|
ICACT20240043 Slide.08
[Big slide for presentation]
|
Chrome Text-to-Speach Click!! |
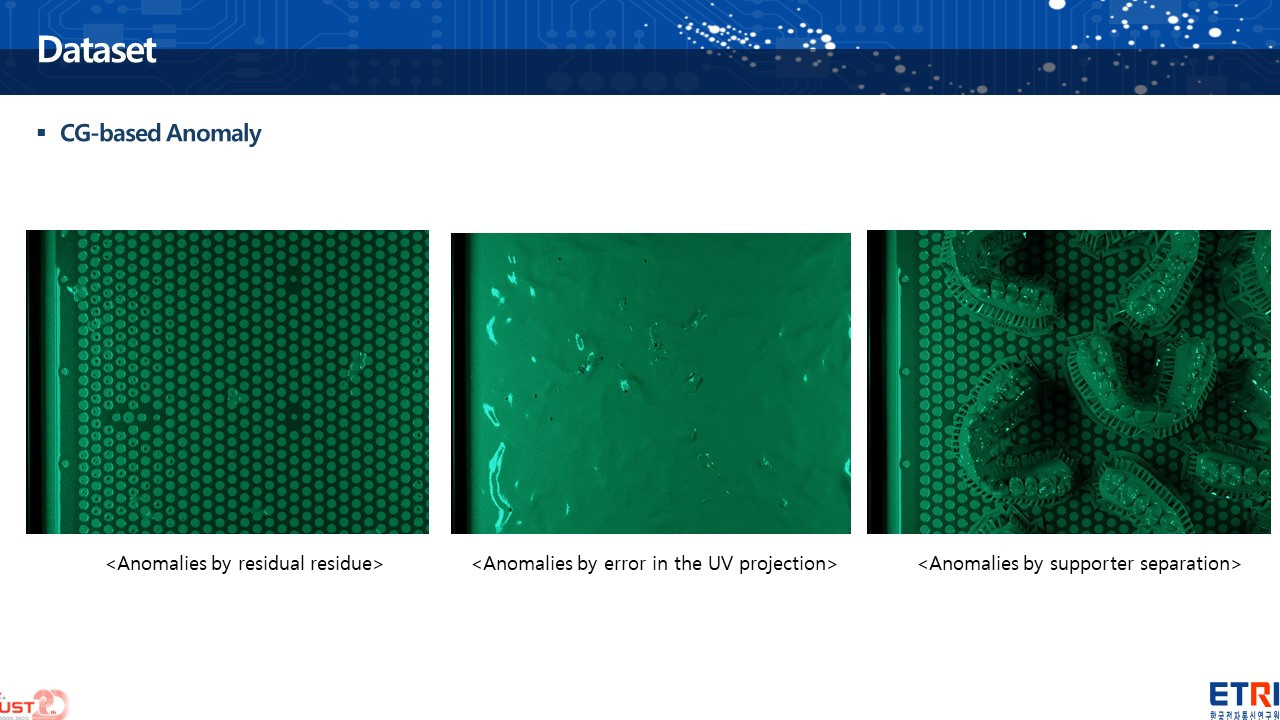 |
This slide also showcases a dataset featuring anomalies in 3D printing, created using computer graphics (CG). There are three images, each depicting a different type of anomaly:
The first image on the left shows anomalies caused by residual residue, likely representing leftover material from the printing process that didn't get cleaned up properly.
The middle image illustrates anomalies caused by errors in the UV projection, which could be due to inaccuracies in the light source or its interaction with the photosensitive resin.
The third image on the right shows anomalies due to the separation of the support structure from the actual print, which can occur if the support isn't constructed properly or if there's a failure during the printing process.
These CG-based visualizations are used to help identify and analyze potential defects in 3D printing processes.
|
|
ICACT20240043 Slide.07
[Big slide for presentation]
|
Chrome Text-to-Speach Click!! |
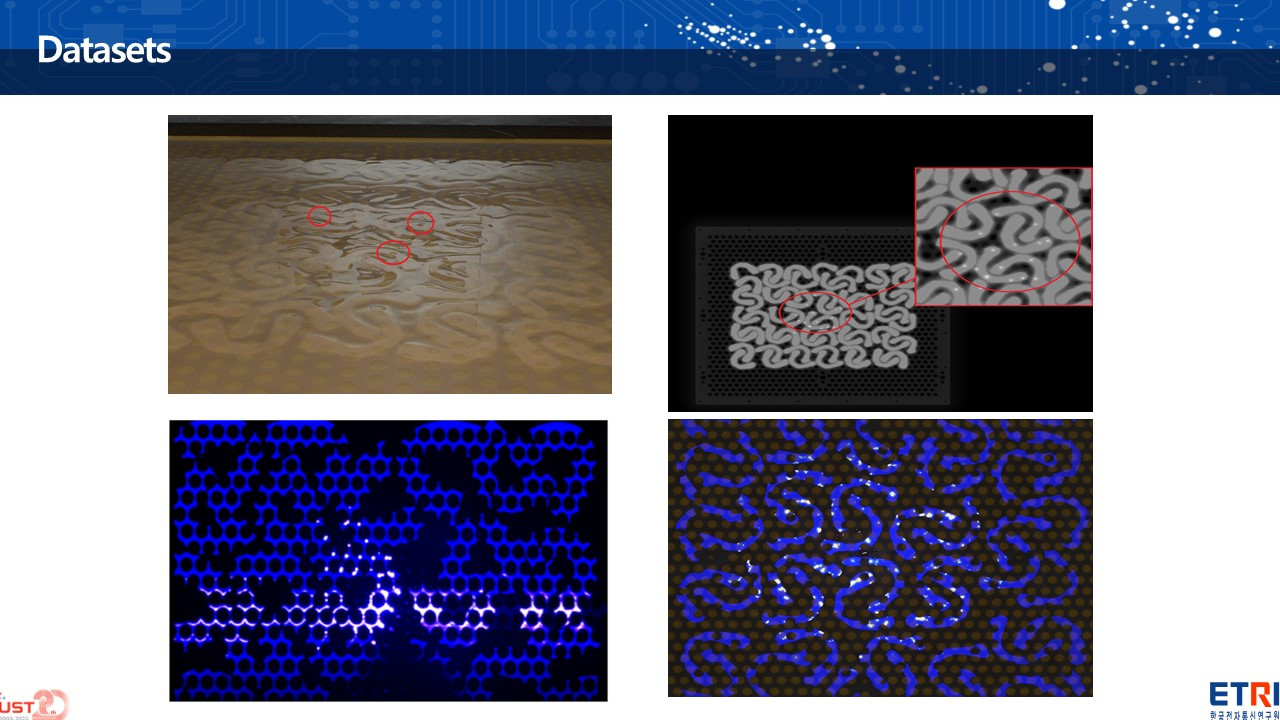 |
The virtual data shown in the previous slide represented an upward building approach of a DLP printer. These images here depict virtual data of a dental model being constructed using a top-down DLP printing method. Contaminants and anomalies in UV light exposure have been realistically simulated in these virtual images to mimic actual conditions.
|
|
ICACT20240043 Slide.06
[Big slide for presentation]
|
Chrome Text-to-Speach Click!! |
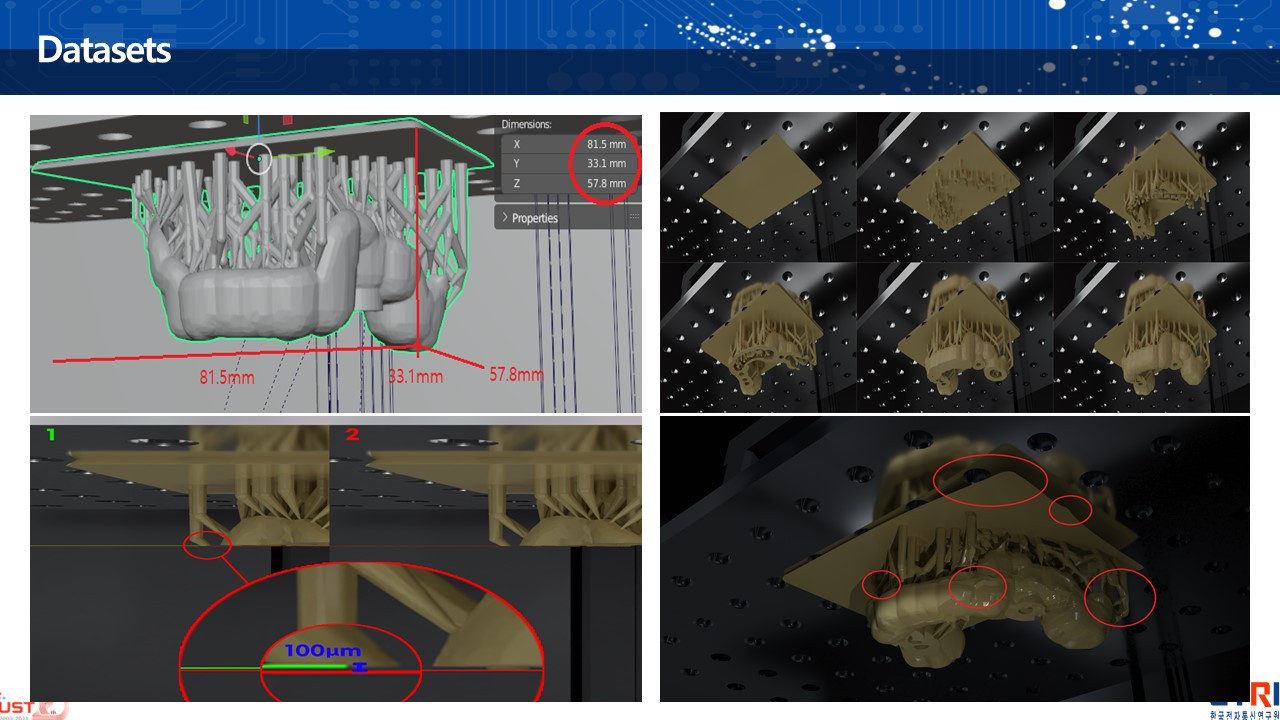 |
The DLP virtual data, as you can see on the left, has been implemented to match the actual size of the physical counterpart. The image on the top right represents a simulated example of the layering process that progresses over time, while the image on the bottom right illustrates anomalous data that occurred during the layering process.
|
|
ICACT20240043 Slide.05
[Big slide for presentation]
|
Chrome Text-to-Speach Click!! |
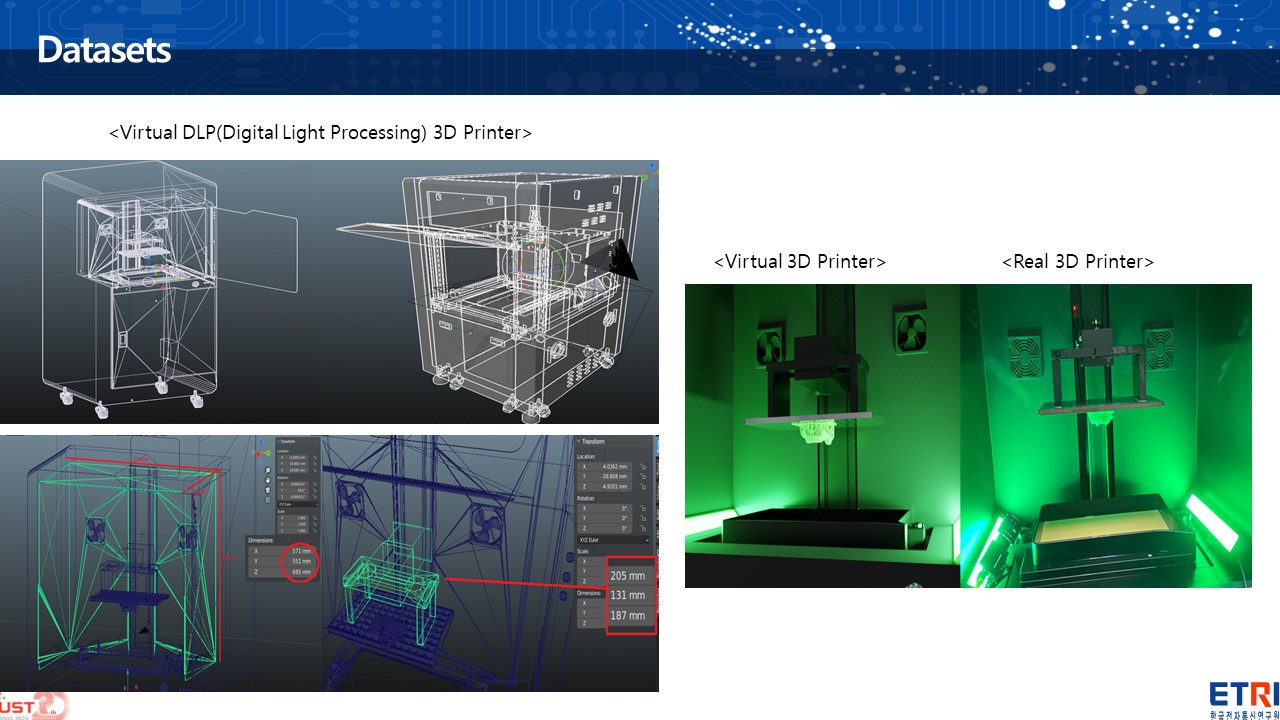 |
This slide presents a comparison between virtual and real 3D printers within the context of creating datasets for anomaly detection. On the left, there are wireframe models of a virtual DLP (Digital Light Processing) 3D printer, which appears to be designed or simulated using computer-aided design (CAD) software. These virtual models help in simulating and understanding the 3D printing process in a controlled environment.
On the right, there is a photo of a real 3D printer illuminated in green, likely capturing the operational environment and the actual printing process.
The contrast between the virtual and real 3D printers underscores the importance of simulating the printing process to generate data, which can then be validated against real-world scenarios. This slide is probably used to discuss the methodology for generating synthetic data for training machine learning models, illustrating the Sim2Real gap mentioned in the previous slide.
|
|
ICACT20240043 Slide.04
[Big slide for presentation]
|
Chrome Text-to-Speach Click!! |
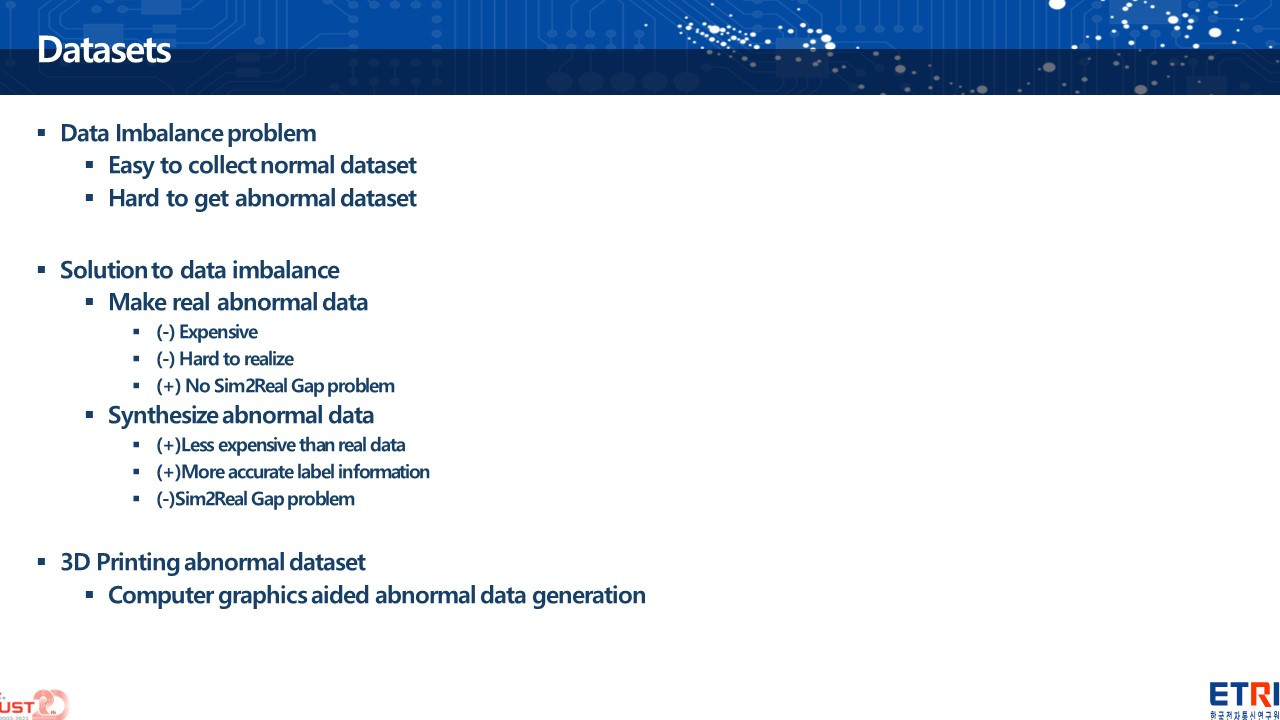 |
This slide addresses the issue of data imbalance in datasets used for anomaly detection in additive manufacturing. It's easier to collect normal data compared to abnormal data, which is scarce and harder to gather. The slide suggests two solutions to this problem:
Making real abnormal data, which although effective, is expensive and challenging to realize. However, it does not suffer from the simulation-to-reality (Sim2Real) gap, which is the difference between simulated and real-world data.
Synthesizing abnormal data, which is less expensive and provides more accurate label information but comes with the downside of the Sim2Real gap problem.
Finally, the slide proposes using computer graphics to aid in the generation of abnormal datasets for 3D printing, which can help to mitigate the data imbalance issue by creating realistic abnormal data without the associated high costs or practical difficulties of capturing real-world anomalies.
|
|
ICACT20240043 Slide.03
[Big slide for presentation]
|
Chrome Text-to-Speach Click!! |
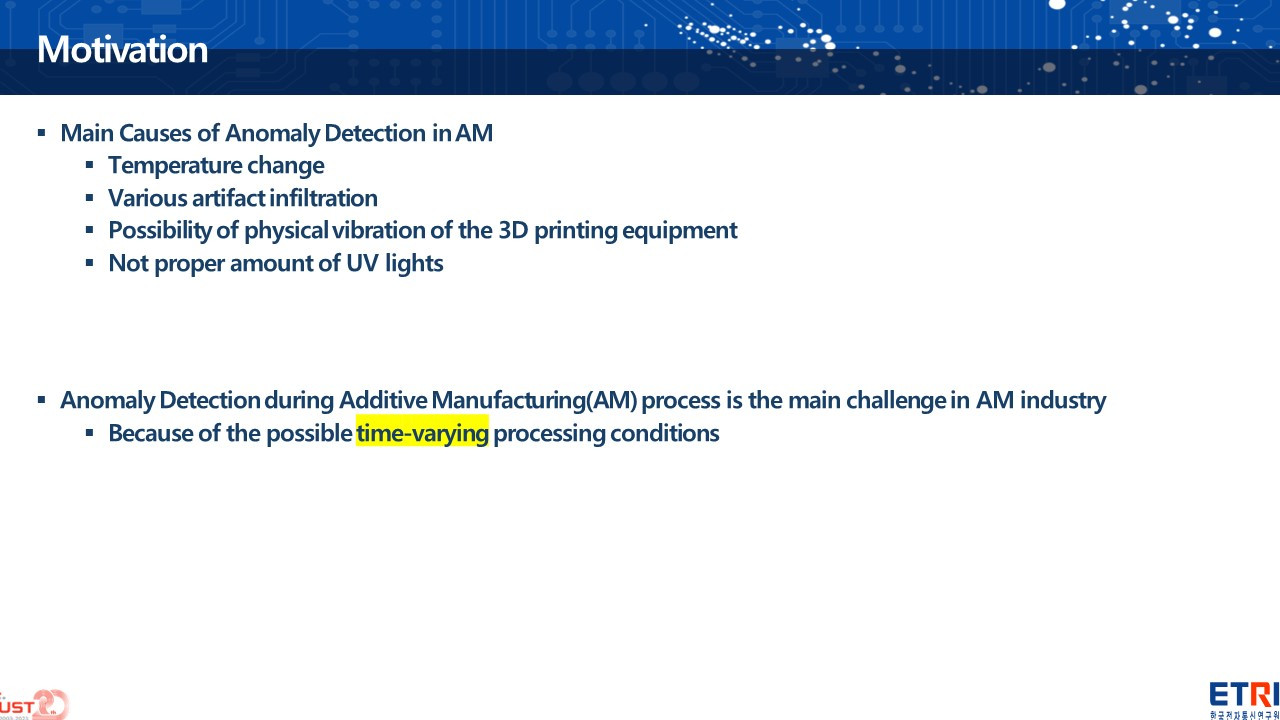 |
This slide outlines the primary reasons why anomaly detection is a critical concern in additive manufacturing (AM). The main causes for anomalies identified are temperature changes, infiltration of artifacts, vibrations of the equipment, and incorrect UV light amounts. These factors can lead to defects in the final product, compromising quality and safety. The slide also emphasizes that the anomaly detection process in AM is challenging due to the time-varying nature of these conditions, which can fluctuate unpredictably during the manufacturing process. Addressing these issues is essential to maintain the integrity and reliability of AM technologies.
|
|
ICACT20240043 Slide.02
[Big slide for presentation]
|
Chrome Text-to-Speach Click!! |
 |
Let’s begin with the motivation behind our research.
We'll explore the fundamental reasons that drive our exploration into additive manufacturing. The remarkable ability of this technology to transcend spatial constraints revolutionizes how we think about production. It offers unprecedented remote control capabilities and simplifies inventory management, thereby streamlining the supply chain.
Furthermore, additive manufacturing excels in producing complex geometries with high precision, granting designers unparalleled flexibility. This facilitates a surge in demand for customized production, tailored to unique customer specifications.
The impact of additive manufacturing extends across various sectors, gaining traction especially in fields that value precision and customization, such as medical applications, aerospace, and defense. These industries stand to benefit immensely from the agility and innovation that additive manufacturing brings.
Our research is propelled by the potential of additive manufacturing to transform these industries, driving us towards developing robust anomaly detection to safeguard the integrity of this transformative process.
|
|
ICACT20240043 Slide.01
[Big slide for presentation]
|
Chrome Text-to-Speach Click!! |
 |
I'll talk about my motivation of this research, and explain how to construct dataset.
In the next slides, I introduce various methods, which are known to solve anomaly detection problem.
I'll explain the experimental results according to each method and conclude my talk.
|
|
ICACT20240043 Slide.00
[Big slide for presentation]
|
Chrome Text-to-Speach Click!! |
 |
Additive manufacturing is gaining attention in various fields such as medical applications, aerospace, defense, and complicated manufacturing industries. This is due to the advantages of additive manufacturing including reduced logistical constraints and the ability to produce customized products. However, the materials used in additive manufacturing are generally expensive and highly sensitive to changes in external
conditions. For these reasons, it is crucial from a productivity standpoint to monitor the additive manufacturing process closely to detect any anomalies early on and decide whether to continue with the layering process.
In this paper, we developed an algorithm that takes camera footage as input to determine the quality of the additive manufacturing output. We achieved an accuracy rate of 99.65%. Additionally, to simulate rare abnormal conditions, we used computer graphics to define nine different abnormal states and generated data for these conditions.
|
















