ICACT20220021 Slide.16
[Big slide for presentation]
ICACT20220021 Slide.16
[Big slide for presentation]
|
Chrome Text-to-Speach Click!! Click!! |
 |
Thank you for your attention
|
|
ICACT20220021 Slide.15
[Big slide for presentation]
|
Chrome Text-to-Speach Click!! |
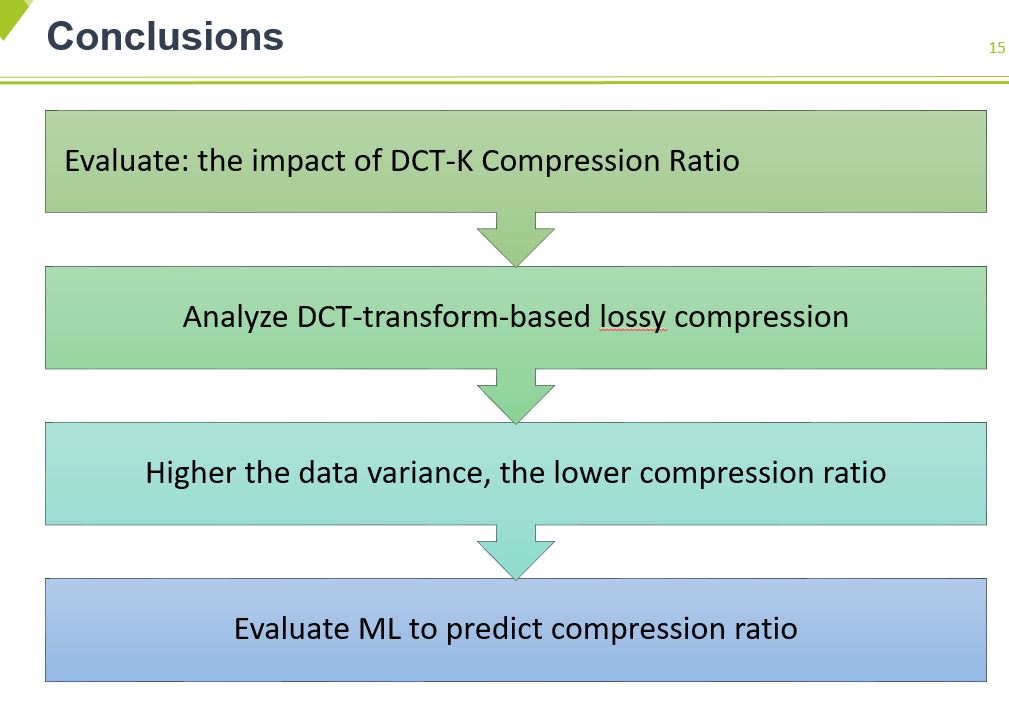 |
Finally, I show conclusion.
Our paper is to analyze recent transform-based lossy compression techniques concerning IoT datasets.
We predict the compression ratio of transformation-based lossy compressors, DCT-K, using characterization data to predict as statistically and use Machine learning such as RF, ANN, and so on.
We learned from Experiments show the higher the data variance, the lower the compression ratio.
|
|
ICACT20220021 Slide.14
[Big slide for presentation]
|
Chrome Text-to-Speach Click!! |
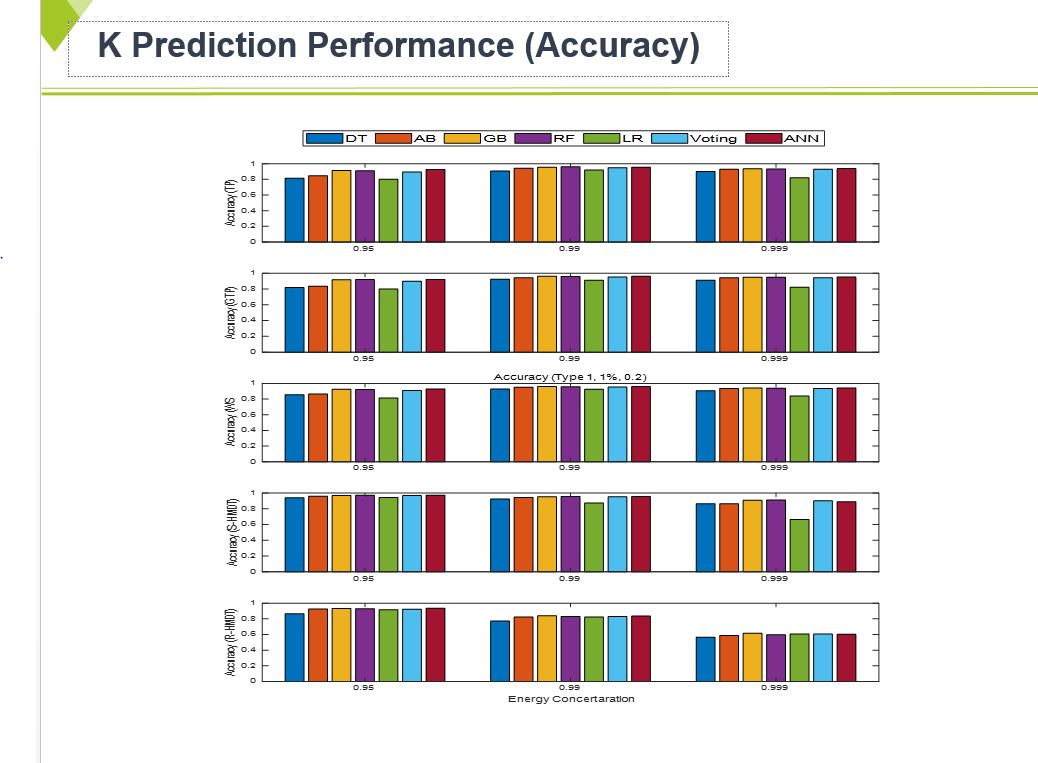 |
We utilize machine learning libraries from scikit-learn to train and evaluate five machine learning algorithms: DT, RF, AB, GB, LR, Voting and ANN.
We set 70% of the data for training and the remaining 30% for the test. This Figure shows the prediction performance on compression ratio for the machine learning model.
As we can see, RF, GB, Voting, and ANN show better performances than others in terms of Accuracy.
|
|
ICACT20220021 Slide.13
[Big slide for presentation]
|
Chrome Text-to-Speach Click!! |
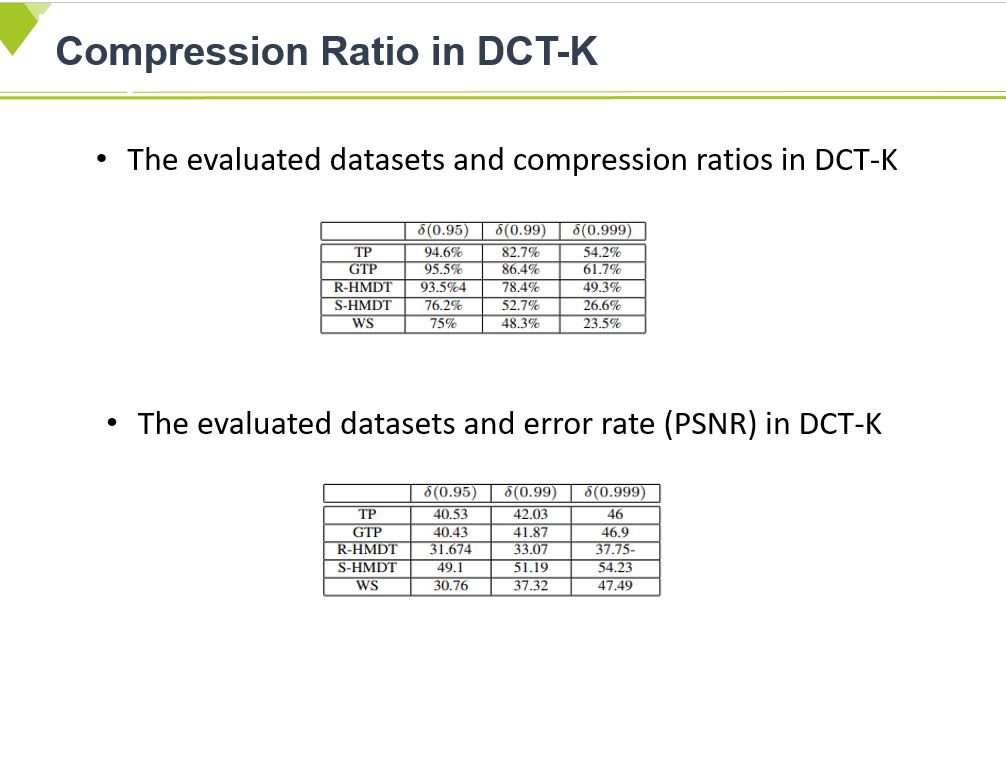 |
These table show the compression ratio and error rate more specially.
As previously mentioned, WS data has r.
Relatively higher k values compared to other data sets
|
|
ICACT20220021 Slide.12
[Big slide for presentation]
|
Chrome Text-to-Speach Click!! |
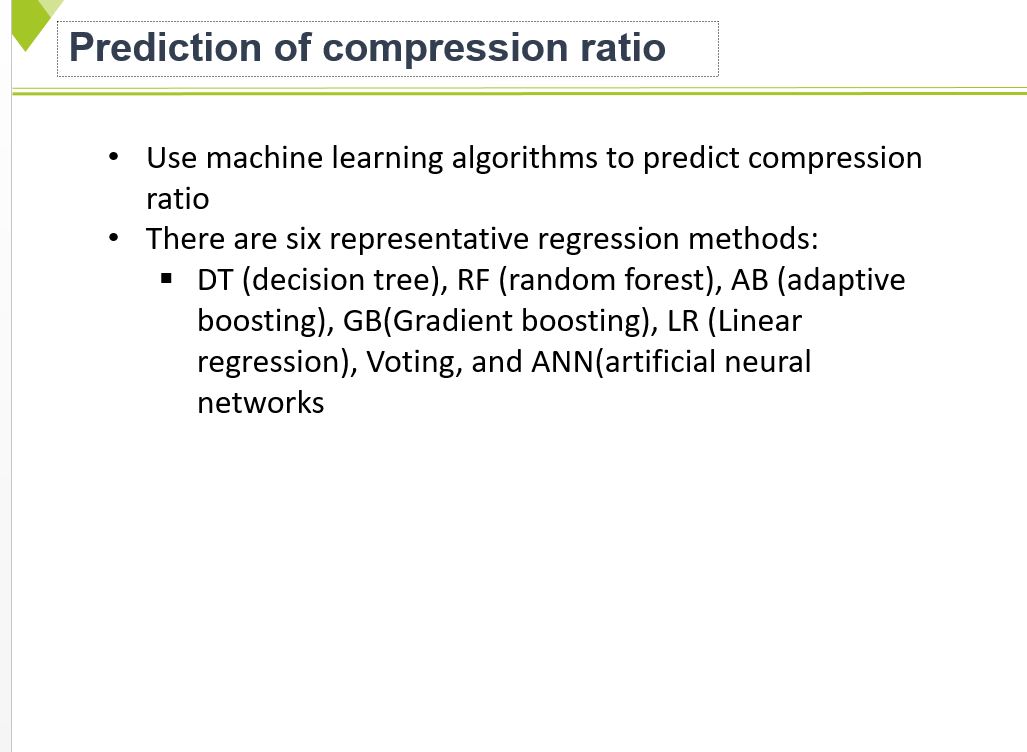 |
we use machine learning algorithmss to predict compression ratio. There are six representative regression methods:
DT (decision tree), RF (random forest), AB (adaptive boosting), GB(Gradient boosting), LR (Linear regression), Voting, and ANN(artificial neural networks).
And then evaluate five representative regression methods: DT, RF, AB, GB, LR, and ANN. Additionally, we add Voting algorithms against DT, AB, and RF to balance out their mechanisms
|
|
ICACT20220021 Slide.11
[Big slide for presentation]
|
Chrome Text-to-Speach Click!! |
 |
This able shows the variation in k values using DCT-K. We use the fixed information compaction rate of 95%, 99% and 99.9%.
The periods with higher variance require more components to approximate data maintained by the same amount of energy,
hence resulting in a lower approximation ratio. The WS data has relatively higher k values compared to other data sets. Therefore, the CRK values in this Table are inferior to different data sets.
|
|
ICACT20220021 Slide.10
[Big slide for presentation]
|
Chrome Text-to-Speach Click!! |
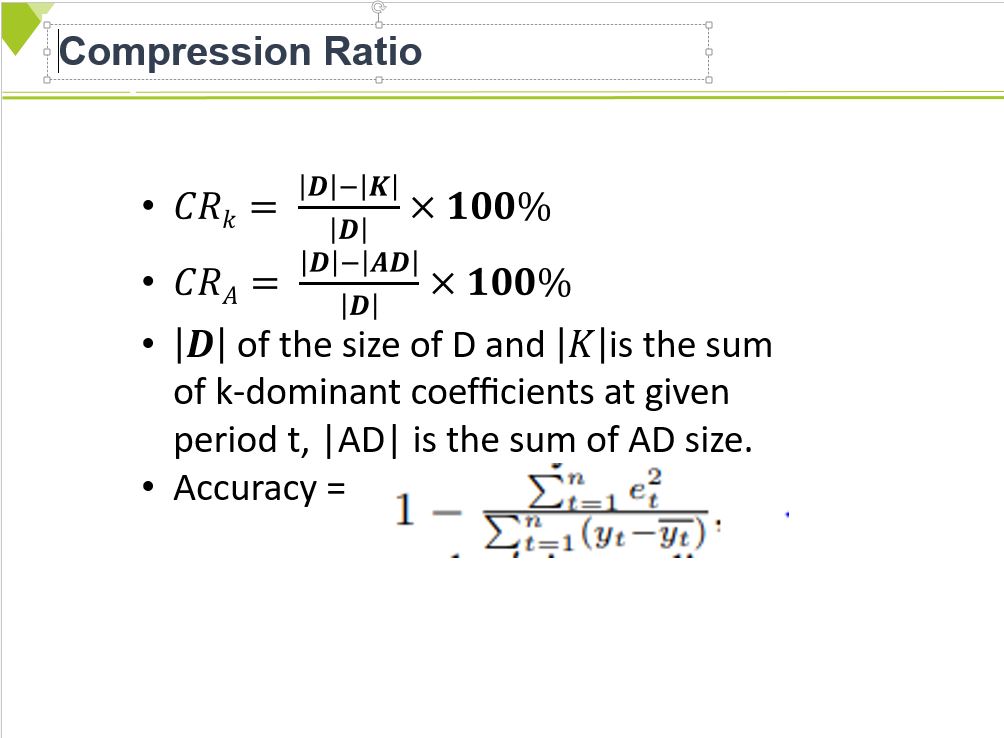 |
I want to show you the performance metrics, including the compression ratio and error rates.
The compression ratio is obtained by a compression method as the previous equation.
We have two types of measuring compression. One is computed by the number of k-dominant coefficients ,
Then, we measure the peak signal-to-noise ratio (PSNR), a commonly used average error metric.
The accuracy of the prediction is defined as the following equation.
|
|
ICACT20220021 Slide.09
[Big slide for presentation]
|
Chrome Text-to-Speach Click!! |
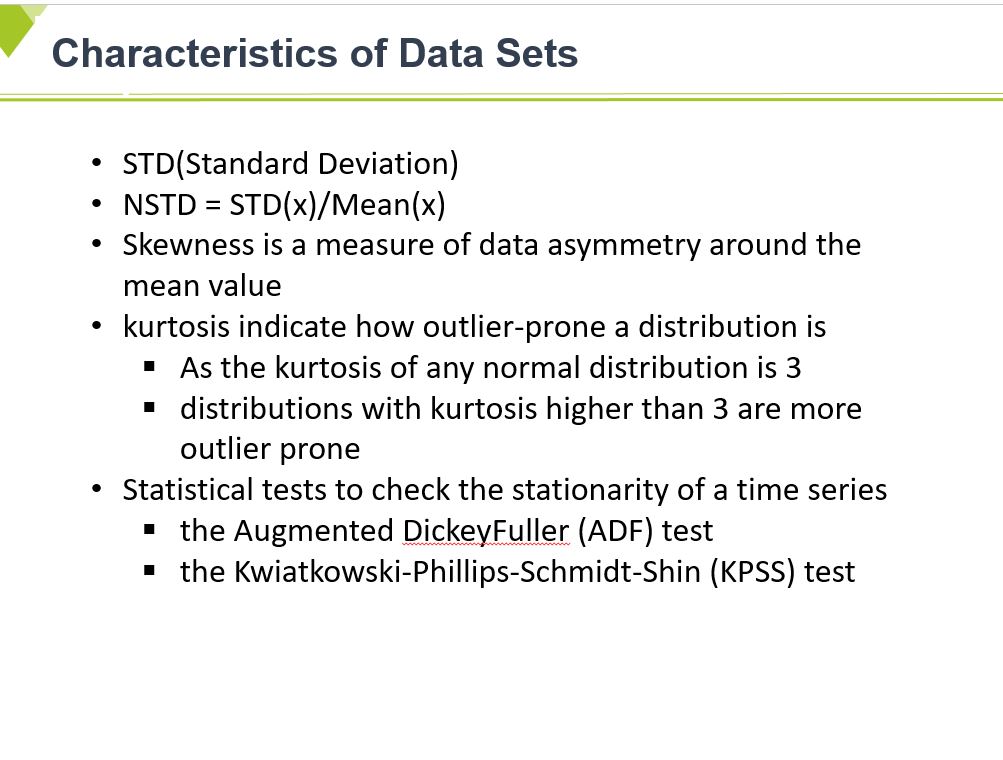 |
To select features for characterizing datasets and related to the transformation compression, we choose the following metrics to assess the characterization of the datasets to be compressed.
There are Variance (x), mean (x) and median (x), skewness (x) and kurtosis (x) of datasest.
Stationarity means that the statistical properties of a time series do not change over time.
Therefore, determine whether a time series is stationary and make effective and precise predictions.
We use two statistical tests to check the stationarity of a time series-the Augmented DickeyFuller (ADF) test and the Kwiatkowski-Phillips-Schmidt-Shin (KPSS) test.
|
|
ICACT20220021 Slide.08
[Big slide for presentation]
|
Chrome Text-to-Speach Click!! |
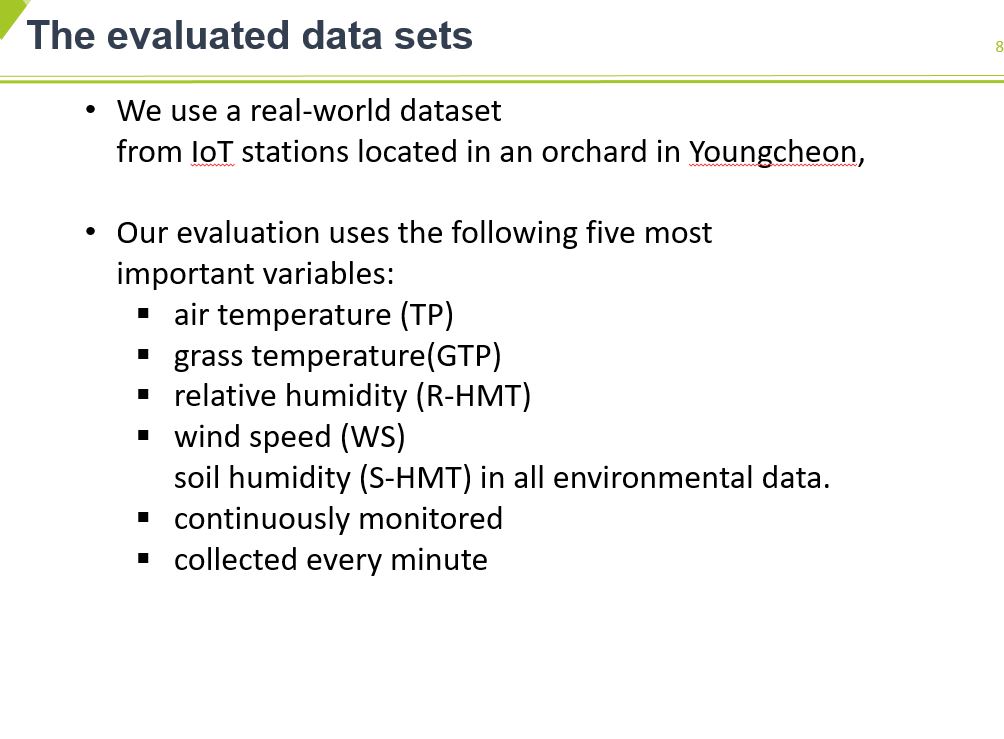 |
In evalution, we use a real-world dataset from IoT stations located in an orchard in Youngcheon, South Korea.
Datasets include 15types of environ-mental factors. Among 15 environmental data,
Our evaluation uses the following five most important variables: air temperature (TP), grass temperature(GTP), relative humidity (R-HMT), wind speed (WS), andsoil humidity (S-HMT) in all environmental data.
The data were continuously monitored and collected every minute using measuring (or sampling) periods.
|
|
ICACT20220021 Slide.07
[Big slide for presentation]
|
Chrome Text-to-Speach Click!! |
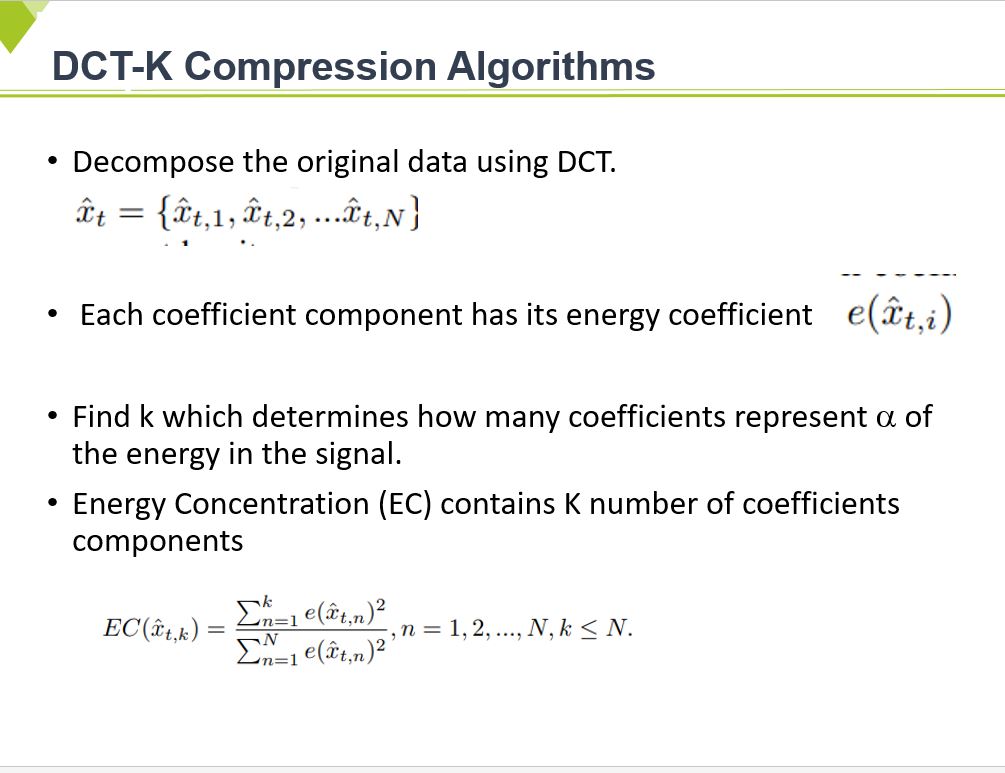 |
First, we transform the original data using DCT signal transformation for the compressing data.
After changing, the actual data consists of transformation coefficients. We define energy for each coefficient because each coefficient component has its energy.
Next, we fond k, which determines how many coefficients represent the energy in the data in terms of energy concentration.
To achieve a higher compression ratio, we ignore the non-significant components other than the k-dominant ones.
Consequently, in our compression method, it is possible to achieve a higher compression ratio if the number of dominant coefficients is sufficiently smaller.
We need K-dominant components and their indices only as approximation datasets. In the reconstruction steps, their indexes are used to make forms the same size if the original data.
|
|
ICACT20220021 Slide.06
[Big slide for presentation]
|
Chrome Text-to-Speach Click!! |
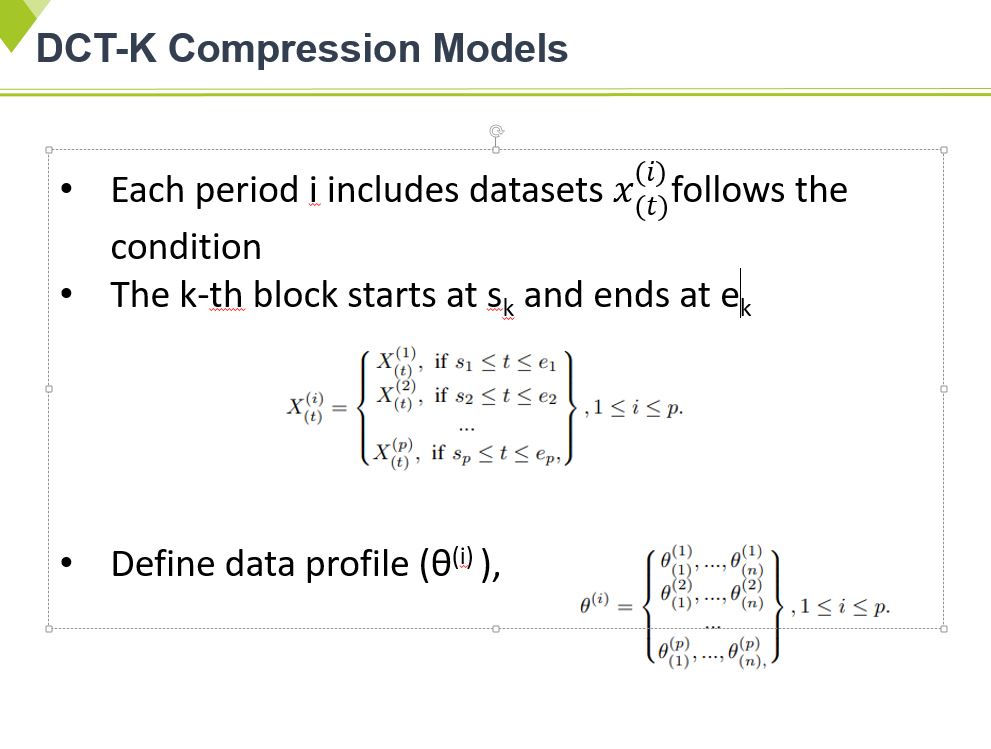 |
To describe our prediction model, we assume that the data point, we assume data domains.
And t and i are the relative time in compressed periods (ultimately decomposed block in our case.
It also requires a parameter, θ (i) , which characterizes data points in the compressed period.
Each compressed period i has a series of data points during time t.
We next define the data profile (θ (i) ), which depends on whether the block under consideration is associated with data of typical or abnormal behavior.
θ (i) is characterizing data points for each block i.
|
|
ICACT20220021 Slide.05
[Big slide for presentation]
|
Chrome Text-to-Speach Click!! |
 |
Under these backgrounds, high-performance computing systems also produce a large volume of data.
However, it is practically infeasible to send all raw data to the remote site for processing.
We should need a new approach to manage data efficiently and reliably data management. We have four stages for data management. The first is to collect data.
The second is to compress data. The third is to save data. Last is to reconstruct data from data compression.
We compress datasets using lossy compression algorithms based on three transformations, namely, discrete cosine transform (DCT).
Consequently, the objectives of my presentation are to evaluate the effect of lossy compression and present a model for the prediction of compression ratio.
From now, I will talk in detail about the impact of lossy compression-based DCT-transform in point data compression.
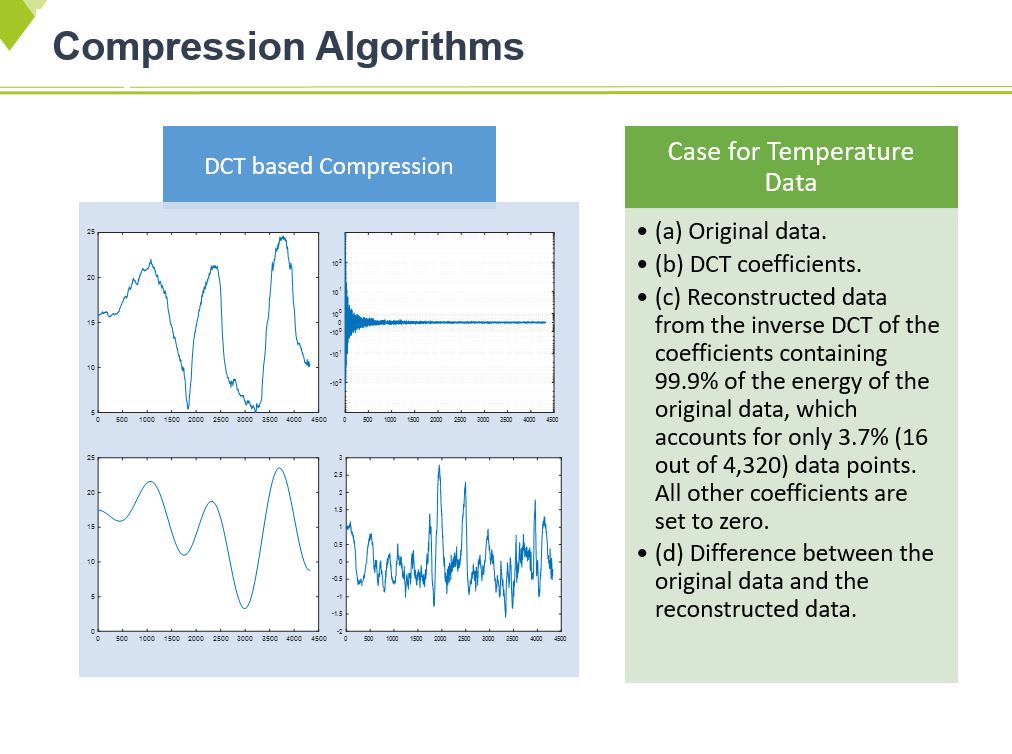
These pictures show the example of DCT transformation.
As previously mentioned, we use DCT signal transformation approaches for compressing data.
As you know, this is a standard signal processing algorithm. So I do not explain the detailed algorithms
But, I will explain how to compress using this in the next slide.
|
|
ICACT20220021 Slide.04
[Big slide for presentation]
|
Chrome Text-to-Speach Click!! |
 |
We evaluate DCT transform-based lossy compression, namely DCT-K.
And we analyze the characteristics of DCT transform-based lossy compression and present relationships between compression ratio and data characteristics to use an effective lossy compression algorithm.
|
|
ICACT20220021 Slide.03
[Big slide for presentation]
|
Chrome Text-to-Speach Click!! |
 |
Various application domains have benefited from IoT. Generally, IoT application has a large volume of data collected by various deployed IoT devices.
Also, the size and complexity of high-performance computing systems keep growing. It has been raised to a problem in dramatically increasing storage and processing.
Therefore, it's desirable to find the solution for efficiently managing big data sets. So, we focus on the compression of HPC datasets to reduce communication overhead and resource usage.
Lossy compression reduces the size significantly, but it has data loss. Finding an optimal balance between data reduction and information loss is challenging.
|
|
ICACT20220021 Slide.02
[Big slide for presentation]
|
Chrome Text-to-Speach Click!! |
 |
The contents of the presentation include as follows
Even though, most of you already know, it is important to recognize
about HPC data and lossy compression in order to understand my presentation more clearly
So, I would like to introduce briefly compression algorithms for big datasets
Then I will explain the compression algorithms related to our research.
We focus on the experiment results for a DCT transform-based lossy compression algorithm.
Finally, I will show you the conclusions.
|
|
ICACT20220021 Slide.01
[Big slide for presentation]
|
Chrome Text-to-Speach Click!! |
 |
Hello
I’m Aekyung Moon and I’m working for developing IOT technologies for a variety of applications such as smart farms and healthcare in
Electronics Telecommunication Research Insti.
Thank you for giving me a chance to introduce the result of our research.
The title of our paper is “Prediction of Compression Ratio for transform-based Lossy Compression in Time-series Datasets”
We focus on the analytics of impact of lossy compression approach for collected smart farm Datasets, shortly, HPC datasets
|