 ICACT20250136 Slide.20
[Big slide for presentation]
[YouTube] |
Chrome Text-to-Speach Click!! |
 |
Thank you for your attention!
|
|
ICACT20250136 Slide.19
[Big slide for presentation]
|
Chrome Text-to-Speach Click!! |
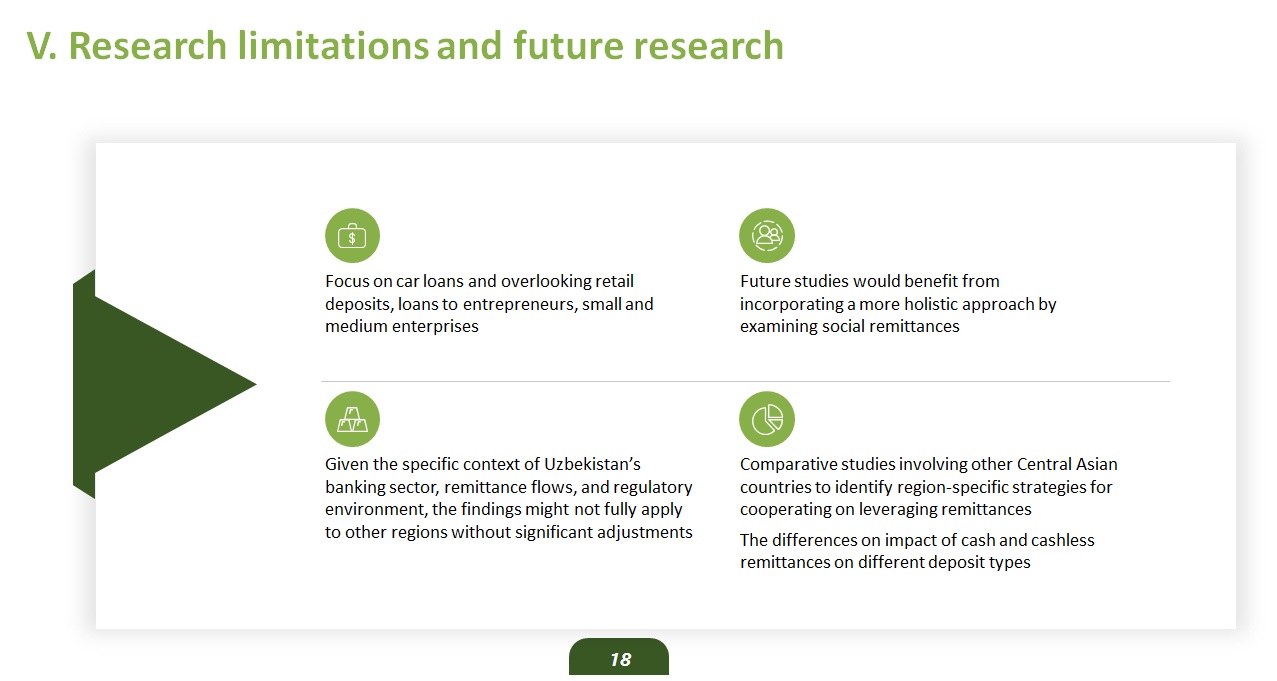 |
A limitation of this study is the lack of consideration for external factors such as changes in loan regulations or exchange rates. These factors can significantly influence consumer behavior and adoption decisions regarding retail loans. However, this limitation suggests the direction for future research. Another future direction is to analyze the differences in the spending behavior of online and offline remittance recipients.
|
|
ICACT20250136 Slide.18
[Big slide for presentation]
|
Chrome Text-to-Speach Click!! |
 |
Among the algorithms considered, the DT and RF show superior overall performance, with accuracy, recall, precision, and F1-scores. The consistent cross-validation scores across folds indicate that there is no overfitting. Consequently, these models are recommended as the optimal choice for building a car loan cross-selling prediction model with the imbalanced data of remittance transactions used in this study.
|
|
ICACT20250136 Slide.17
[Big slide for presentation]
|
Chrome Text-to-Speach Click!! |
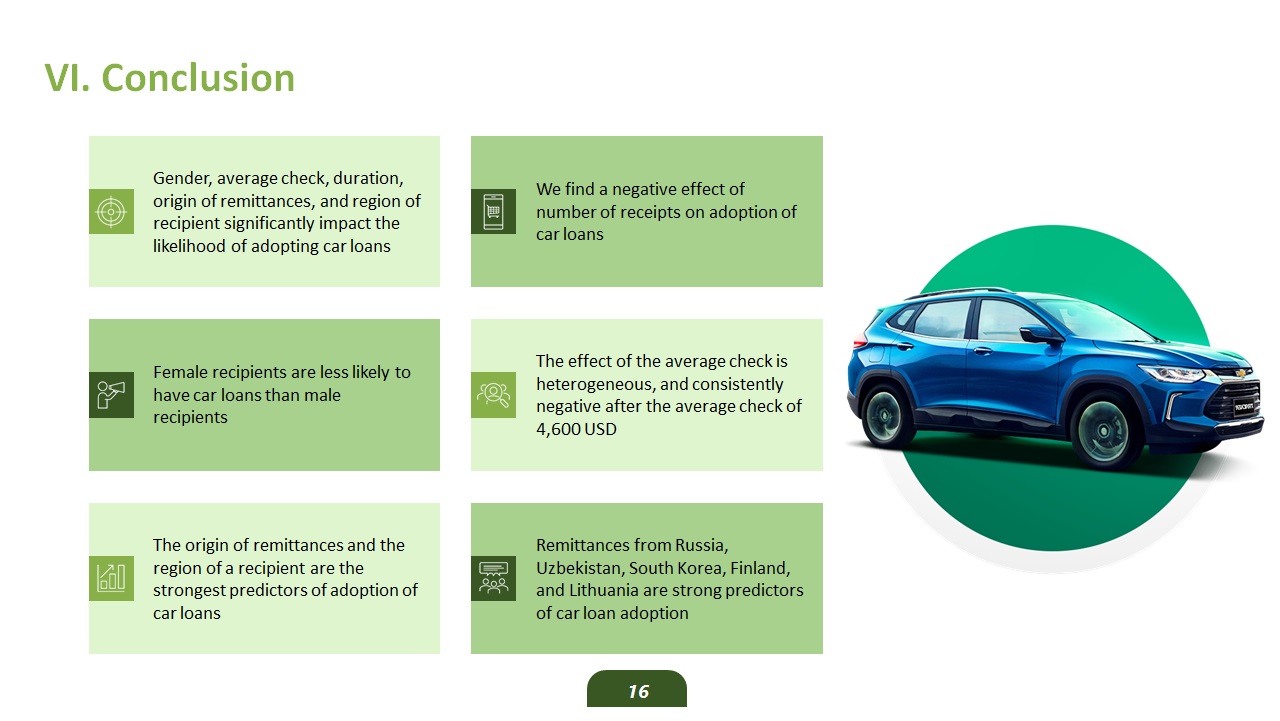 |
Financial institutions can use these models to target car loan products based on remittance origin, recipient region, and sender and receiver gender. However, targeting based on average check amounts of remittances should be approached with caution
|
|
ICACT20250136 Slide.16
[Big slide for presentation]
|
Chrome Text-to-Speach Click!! |
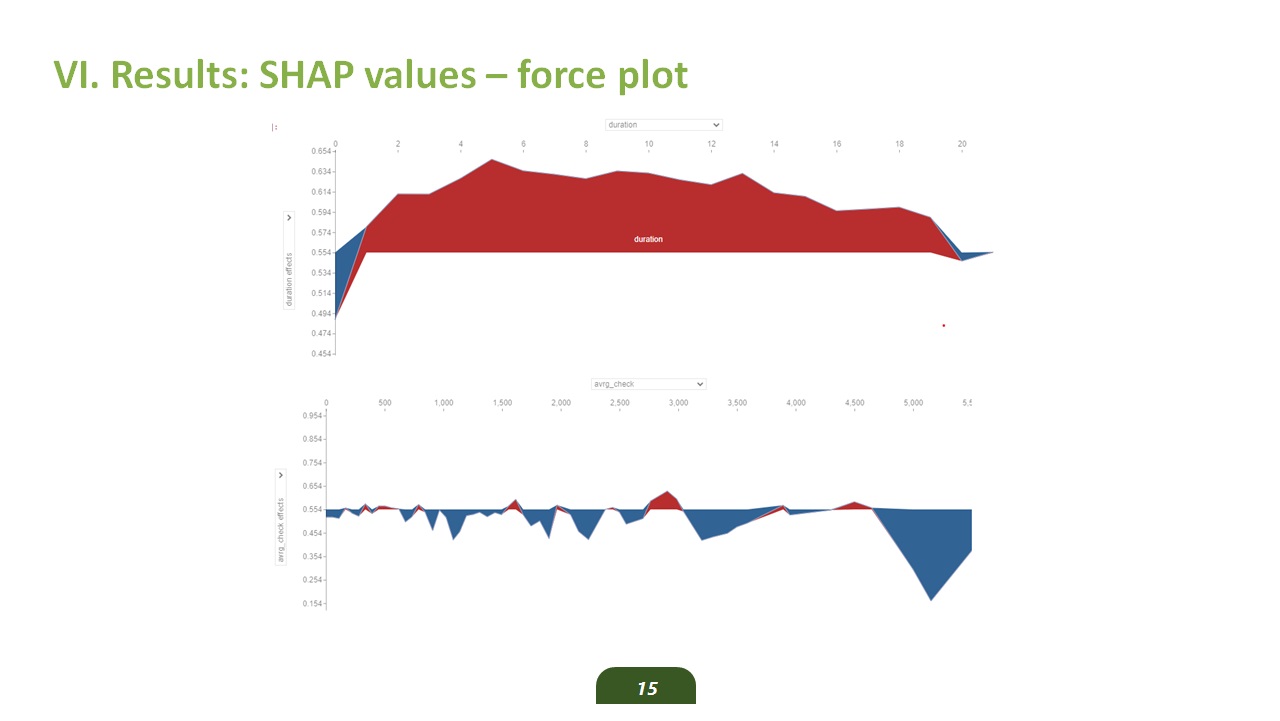 |
The force plot for duration (Figure a) shows its effect increasing after three months, peaking at the fifth month, and gradually declining until the 19th month. This trend may reflect that longer remittance durations build trust between recipients and banks. However, 1.5 years is typically sufficient for acquiring a car, and after this period, migrants or remittance-recipients tend to shift their focus to other goals, such as purchasing real estate. The effect of the average check (Figure b) is highly heterogeneous. Positive impacts are observed for intervals such as $300–400, $1500–1600, $2700–3100, and $4300–4600, while values above $4600 show a continuous negative effect.
|
|
ICACT20250136 Slide.15
[Big slide for presentation]
|
Chrome Text-to-Speach Click!! |
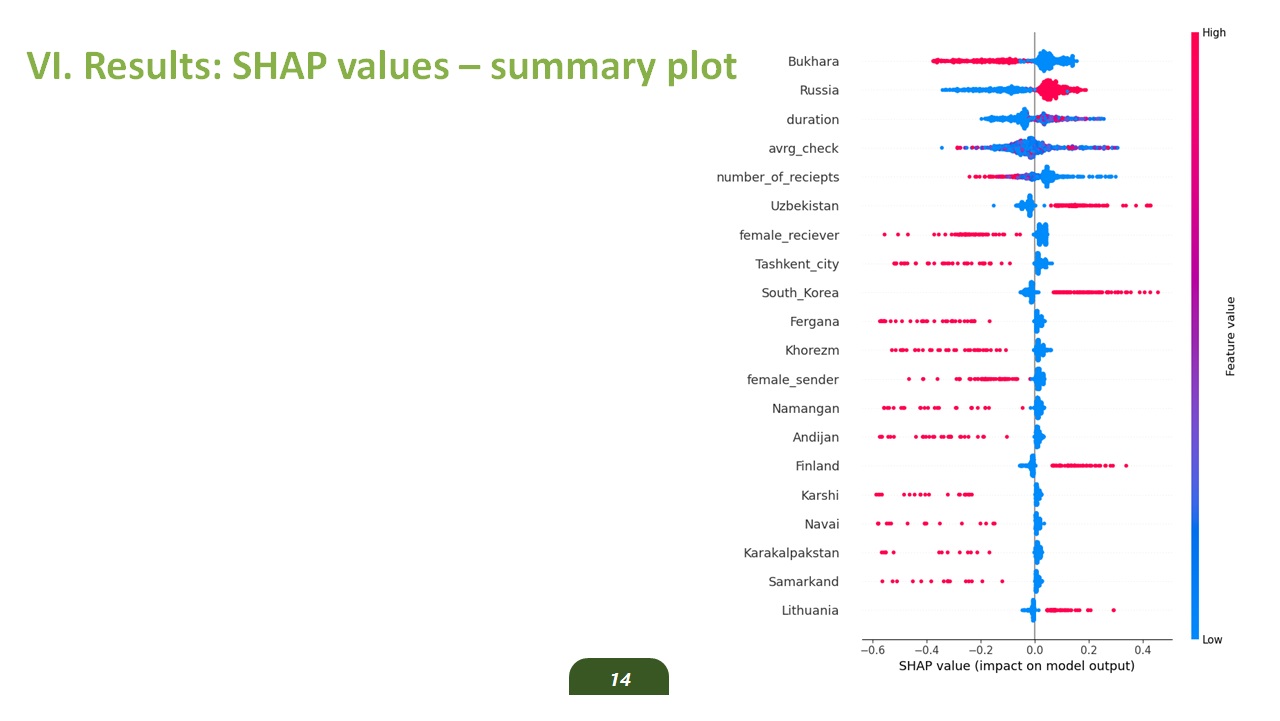 |
This slide presents the summary plot of SHAP values. Higher values for variables such as Russia, Uzbekistan, South Korea, Finland, and Lithuania positively impact the outcome. In contrast, variables like Bukhara and the number of receipts show a negative effect, decreasing the likelihood of car loan adoption. Duration and average check have mixed effects, prompting further visualization using force plots.
|
|
ICACT20250136 Slide.14
[Big slide for presentation]
|
Chrome Text-to-Speach Click!! |
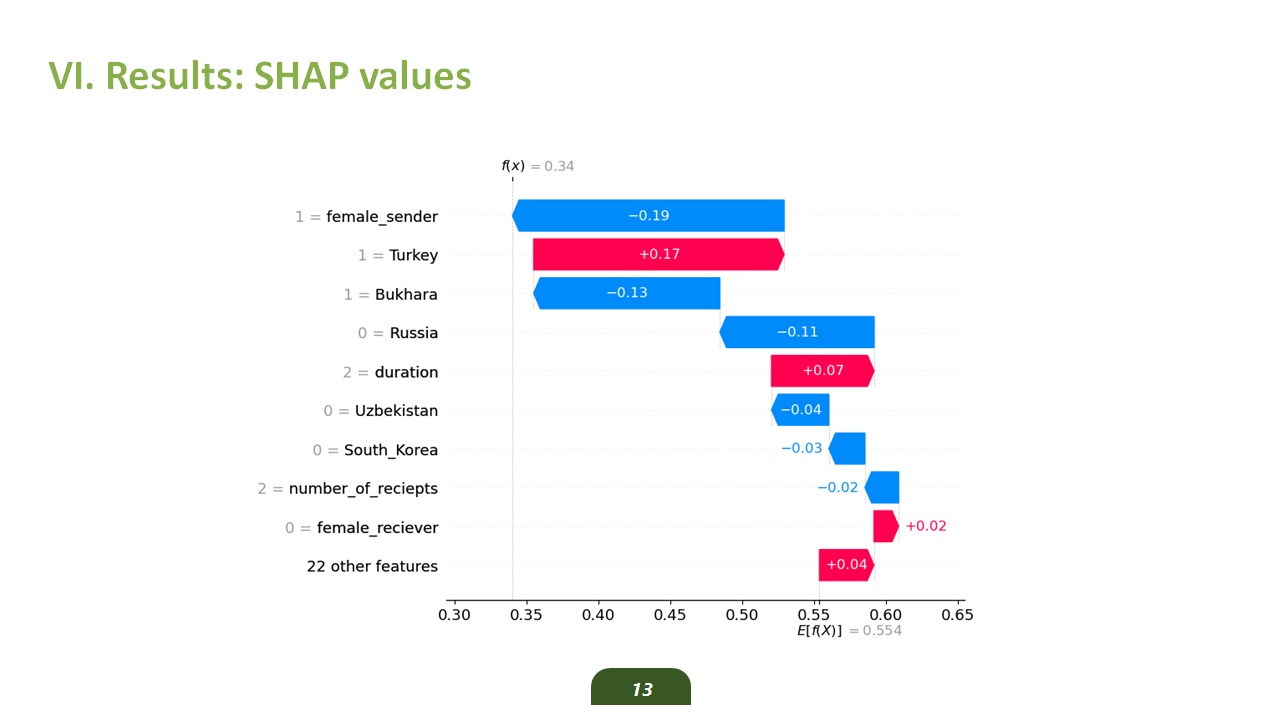 |
For this particular outcome, the likelihood of car loan adoption is 34%. It is positively influenced by remittances from Turkey, a duration (value=2 months), a male receiver, and 22 other features. However, the female sender has the most substantial negative effect on the outcome.
|
|
ICACT20250136 Slide.13
[Big slide for presentation]
|
Chrome Text-to-Speach Click!! |
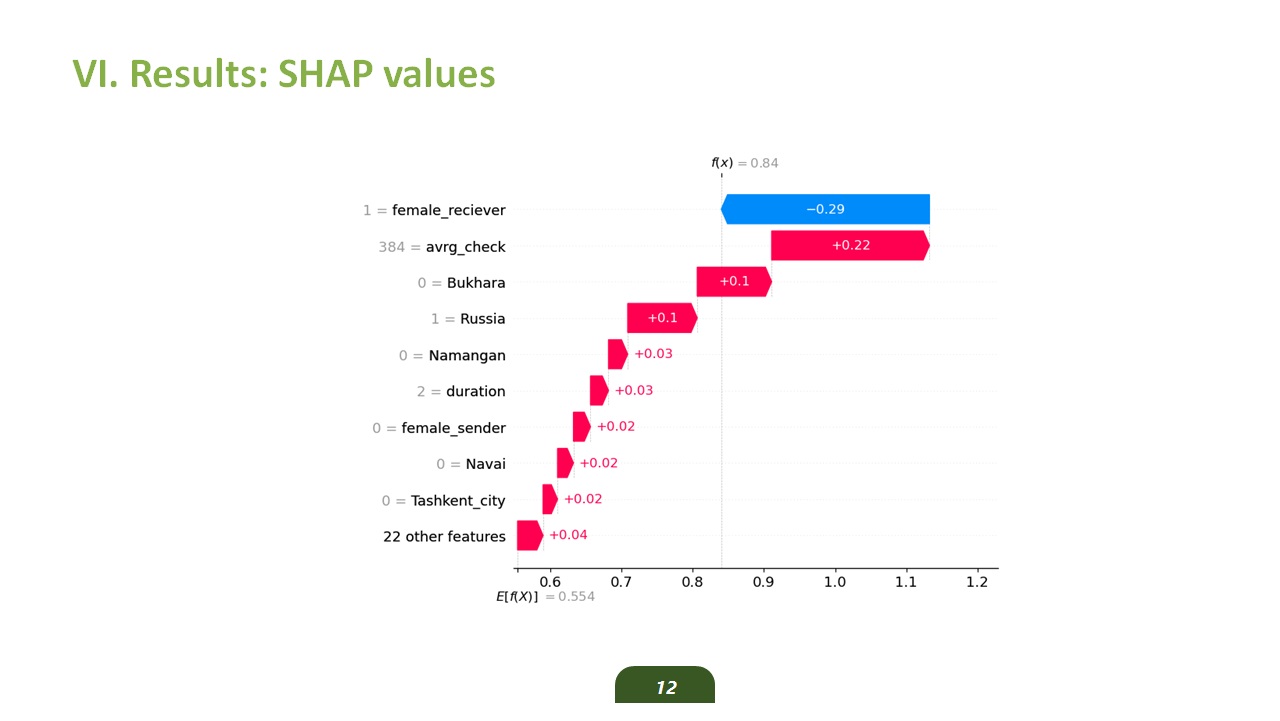 |
In the next step, we calculated Shapley Additive Explanations (SHAP) values for the RF model to understand how each feature contributes to the final prediction. This slide presents the feature contributions in predicting “0”. Positive contributions, represented in red, push the prediction toward the outcome “1”. Negative contributions, shown in blue, pull the prediction toward the “0” outcome. The base value E[f(X)] represents the starting point. The number next to each variable name indicates its value for the specific instance. The number inside the red or blue box denotes the contribution of that variable’s value to the prediction outcome. The value f(x) represents the predicted probability of the outcome based on the model’s function.
For this particular outcome, the likelihood of this client adopting a car loan is 84%. All variables except the female receiver positively contribute to this outcome. A female receiver (value = 1) reduces the likelihood of adoption to 29%. In Figure (b), the likelihood of car loan adoption is 34%. It is positively influenced by remittances from Turkey, a duration (value=2 months), a male receiver, and 22 other features. However, the female sender has the most substantial negative effect on the outcome.
|
|
ICACT20250136 Slide.12
[Big slide for presentation]
|
Chrome Text-to-Speach Click!! |
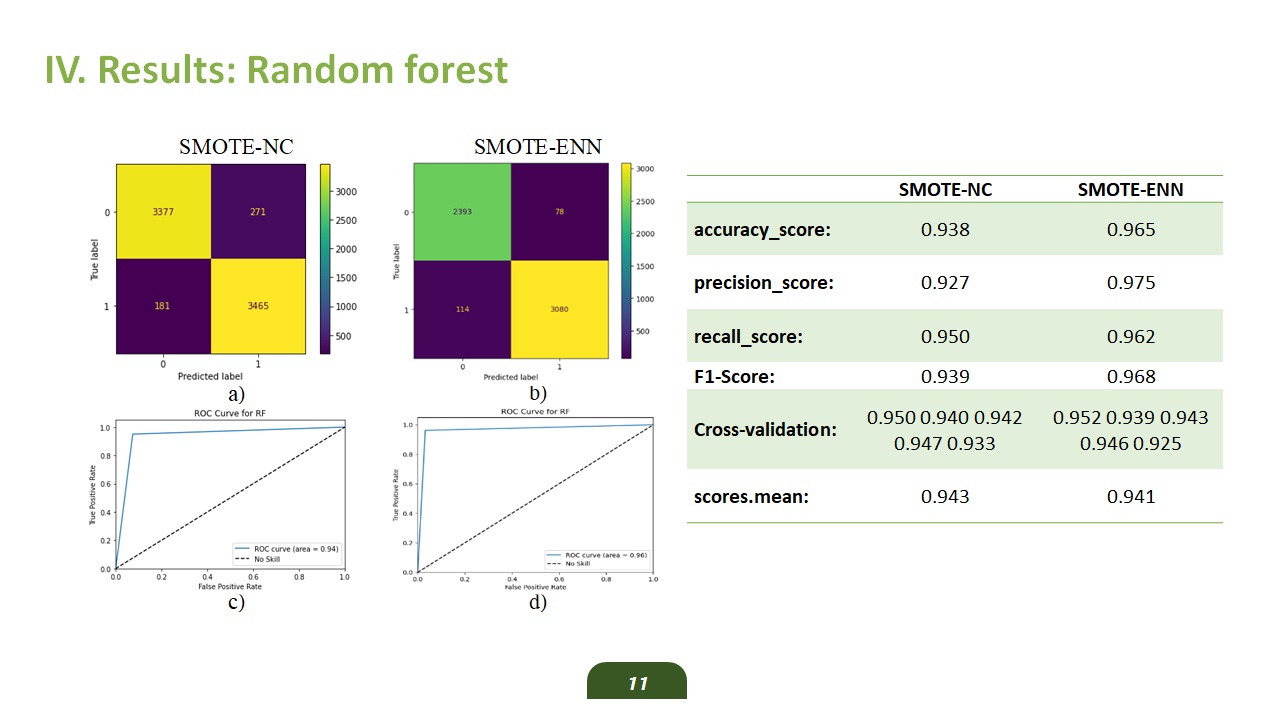 |
On the SMOTE-NC dataset, the RF model correctly predicts 3 465 positive outcomes and 3 377 negative outcomes. The number of false positives and false negatives is 271 and 181, respectively (Figure (a)). The area under curve AUC= 0.56 (Figure (c)). On the SMOTE-ENN dataset, the RF model correctly predicts 3,080 positive outcomes and 2 393 negative outcomes. The number of false positives and false negatives is 78 and 114, respectively (Figure (b)). The area under curve AUC= 0.96 (Figure (d)).
The first column of Table presents the accuracy, precision, recall, and F1-scores of the RF model in SMOTE-NC data. An accuracy score of 0.94, a precision score of 0.93, recall score of 0.95 and an F1-score of 0.94 indicate that the RF model performs very well on the SMOTE-NC dataset. However, the cross-validation scores for the entire SMOTE-NC dataset are not stable across folds and range from 0.93 to 0.95. This slight variation indicates that there is a small overfitting issue.
The second column of Table presents the accuracy, precision, recall, and F1-scores of the RF model on the SMOTE-ENN dataset. An accuracy score of 0.96, precision score of 0.97, recall score of 0.96, and F1-score of 0.97 indicate that the RF model performs very well on the SMOTE-ENN dataset. The cross-validation scores for the entire SMOTE-ENN dataset are slightly unstable across folds and range from 0.924 to 0.952. This variation suggests a potential overfitting issue.
|
|
ICACT20250136 Slide.11
[Big slide for presentation]
|
Chrome Text-to-Speach Click!! |
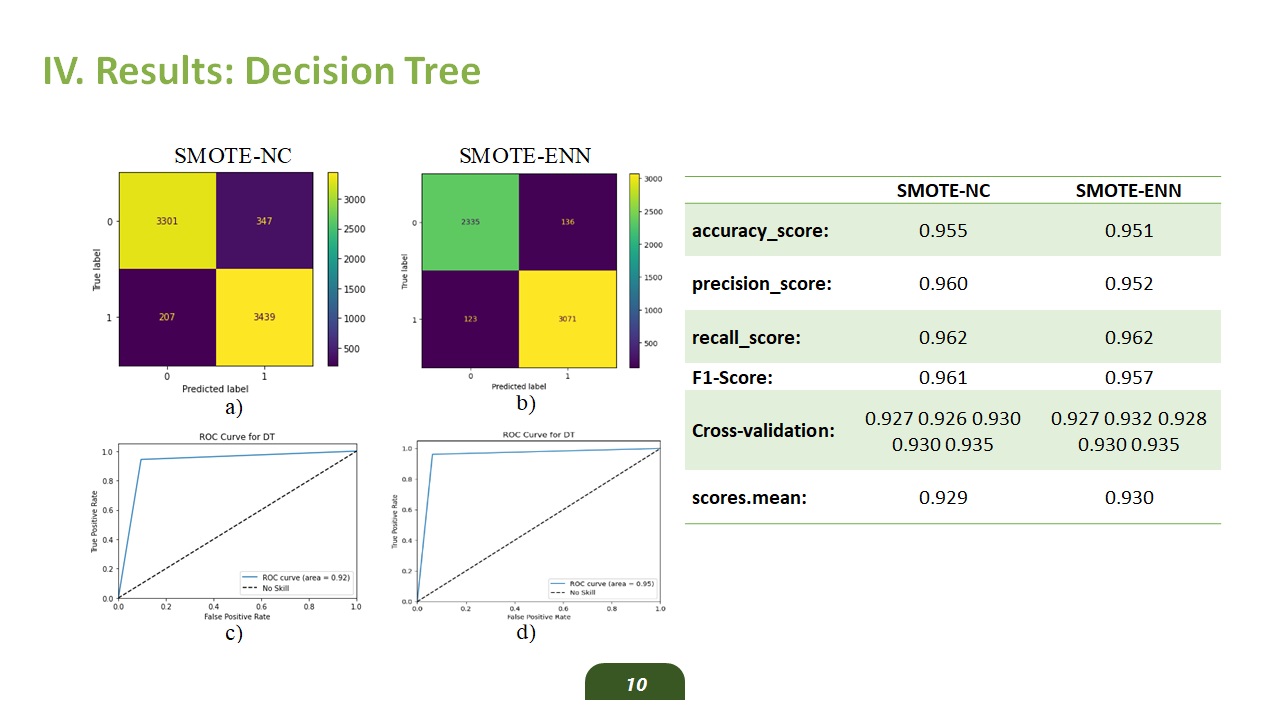 |
On the SMOTE-NC dataset, the DT model correctly predicts 3 439 positive outcomes and 3 301 negative outcomes. The number of false positives and false negatives is 341 and 207 respectively (Figure (a)). The area under curve AUC= 0.92 (Figure (c)). On the SMOTE-ENN dataset, the DT model correctly predicts 3 071 positive outcomes and 2 335 negative outcomes. The number of false positives and false negatives is 136 and 123, respectively (Figure (b)).
Accuracy score of 0.96, precision score of 0.96, recall score of 0.96 and an F1-score of 0.96 indicate that the DT model performs very well on the SMOTE-NC dataset. The cross-validation scores for the entire SMOTE-NC dataset are stable across folds and range from 0.926 to 0.934. This very small variation suggests that there is no overfitting.
The second column of Table presents the accuracy, precision, recall, and F1-scores of the DT model on the SMOTE-ENN dataset. An accuracy score of 0.95, precision score of 0.95, recall score of 0.96, and F1-score of 0.96 indicate that the DT model performs very well on the SMOTE-ENN dataset. The cross-validation scores for the entire SMOTE-ENN dataset are stable across folds and range from 0.927 to 0.934. This small variation indicates that there is no overfitting.
|
|
ICACT20250136 Slide.10
[Big slide for presentation]
|
Chrome Text-to-Speach Click!! |
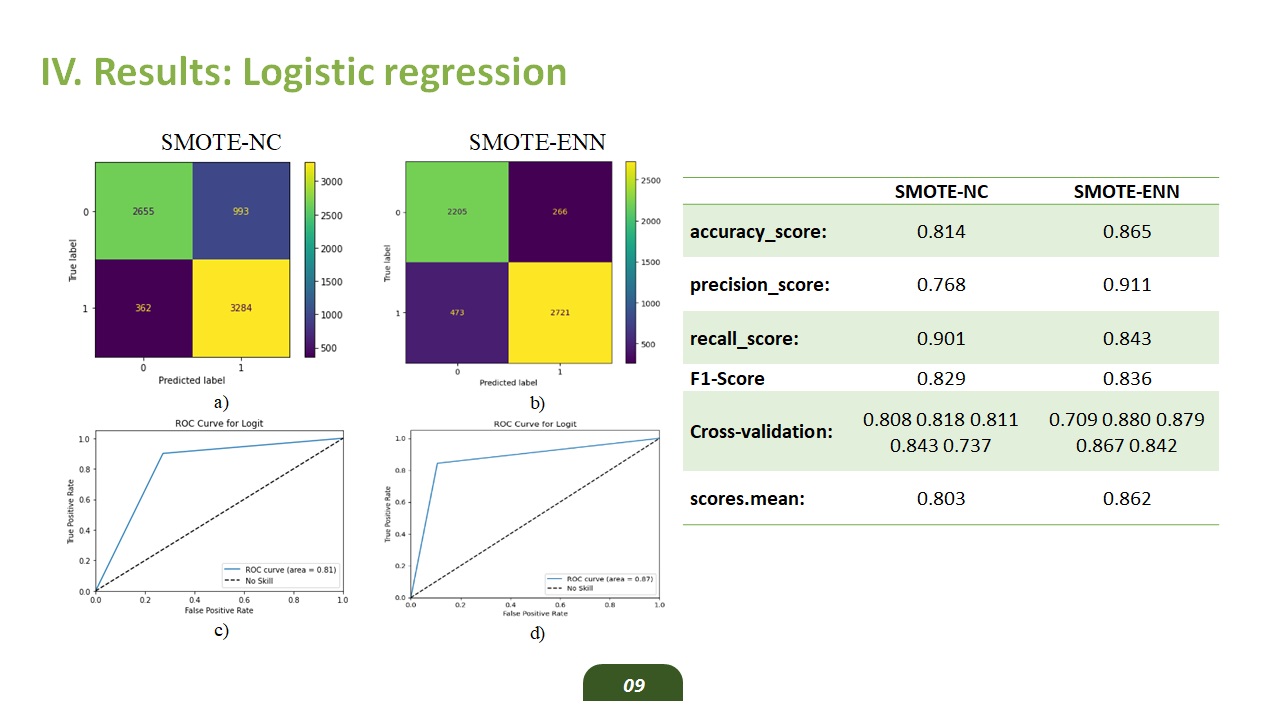 |
For the SMOTE-NC dataset, the LR model correctly predicts 3 284 positive outcomes and 2 655 negative outcomes. The number of false positives and false negatives is 993 and 362, respectively (Figure (a)). The area under the curve (AUC) is 0.81 (Figure (c)).
On the SMOTE-ENN dataset, the LR model correctly predicts 2 721 positive outcomes and 2 205 negative outcomes. The number of false positives and false negatives is 266 and 473, respectively (Figure (b)). AUC is equal to 0.87 (Figure (d)).
The first column of Table presents the accuracy, precision, recall, and F1-scores of the LR model on the SMOTE-NC dataset. An accuracy score of 0.814, precision score of 0.768, recall score of 0.901, and F1-score of 0.829 indicate that the LR model performs well on the SMOTE-NC dataset.To evaluate potential overfitting, we test the model on five sub-datasets. We divide the entire dataset into five folds. In each iteration, we use one-fold as the test set. We train the model on the remaining data, using each fold once as a test set. This cross-validation method allows us to obtain scores for the entire dataset. The cross-validation scores for the SMOTE-NC dataset vary across folds, ranging from 0.74 to 0.84. This variation signals a potential overfitting issue.
|
|
ICACT20250136 Slide.09
[Big slide for presentation]
|
Chrome Text-to-Speach Click!! |
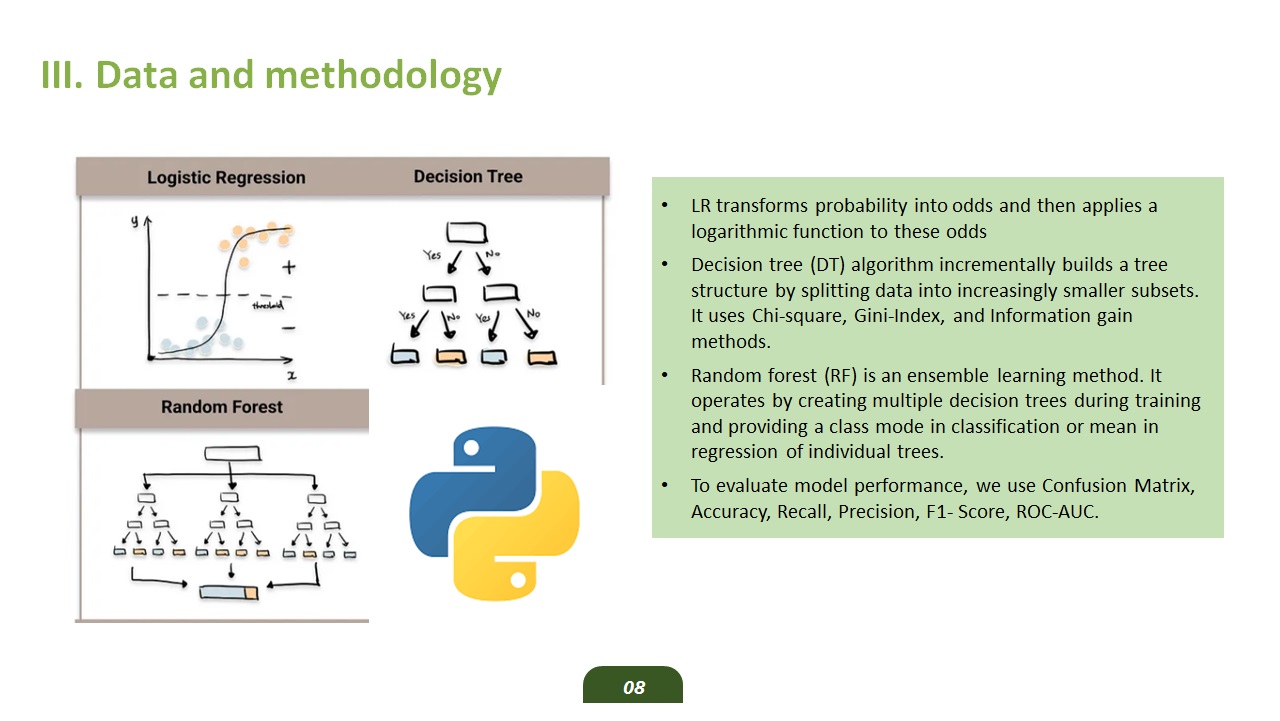 |
Logistic regression (LR) model is a widely used algorithm for binary classification in statistical methods and ML contexts. The model is particularly popular in banking. It is favored for its easy interpretation and implementation [11]. LR transforms probability into odds and then applies a logarithmic function to these odds. This ensures that estimated probabilities range between zero and one. This process effectively removes both the lower and upper bounds of the probability [10]. Scholars have compared their proposed methods to LR. The findings of these studies demonstrate the power of LR as a benchmark in credit scoring [14, 23].
Decision tree (DT) algorithm incrementally builds a tree structure by splitting data into increasingly smaller subsets. It uses Chi-square, Gini-Index, and Information gain methods. DT with improved Chi-square feature selection performs especially well in terms of recall for multiclass text classification. [22]. The model follows if-then rules. When an input condition is met, it returns a decision, predicting the target value. If not, it carries out further analysis [24]
Random forest (RF) is an ensemble learning method. It operates by creating multiple decision trees during training and providing a class mode in classification or mean in regression of individual trees. [22]. In this way, RF works more than a single tree from the classification results perspective. However, while RF generally provides strong results, gradient-boosted trees often surpass RF in accuracy [13].
Synthetic Minority Over-sampling Technique for Nominal and Continuous variables (SMOTE-NC) is an oversampling technique [17]. SMOTE-ENN technique first applies SMOTE to generate synthetic samples for the minority class and then uses Edited Nearest Neighbors to clean the dataset by removing noisy samples [19].
To evaluate model performance, we use Confusion Matrix, Accuracy, Recall, Precision, F1- Score, ROC-AUC.
|
|
ICACT20250136 Slide.08
[Big slide for presentation]
|
Chrome Text-to-Speach Click!! |
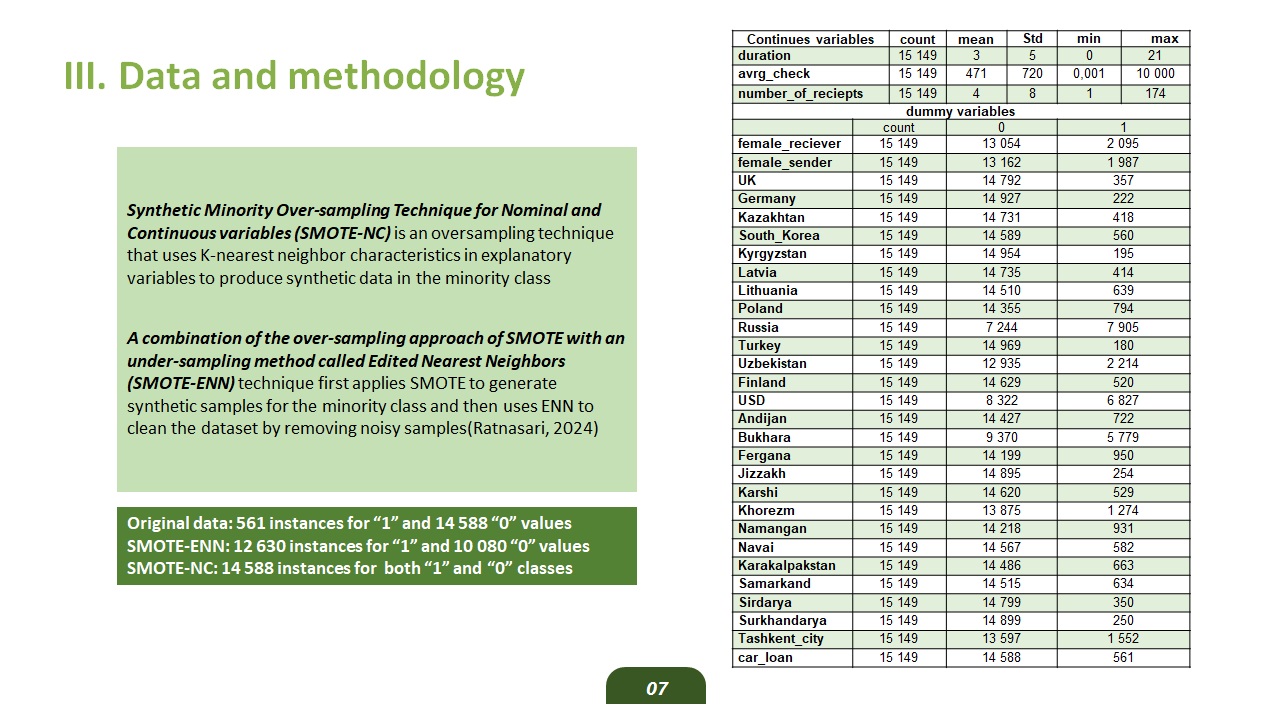 |
Our dataset has three continuous variables and twenty-nine dummy variables. Duration is a continuous variable. It is measured in months and shows the time passed between the first and last receipts of remittances. The minimum value of zero indicates that the client received a single remittance. The maximum duration is equal to 21 months. On average, recipients receive remittances over three months. Avg_check represents the average check amount per recipient in US dollars. The values of avrg_check range from 0.001 to 10,000 USD, with a mean of 471 USD. The number of receipts reflects the total quantity of remittances per recipient, varying from one to 174. On average, there are four remittances per recipient.
Female_reciever and female_sender indicate the gender of the recipient and sender respectively. Where a value of 1 signifies a female, and 0 represents a male. Remittances originating from 12 primary countries are represented by dummy variables (e.g., UK, Germany, Russia), which account for 95% of all the remittances to Uzbekistan. Remittances from other countries are grouped into a single variable, which we omit as required for dummy variable usage. In Uzbekistan, remittances can be sent in US dollars and Uzbek soums. USD variable indicates the currency of remittances, where 1 represents USD and 0 represents Uzbek soums. Uzbekistan has thirteen regions. Twelve regions are used to represent the originality of the recipient and one region is omitted.
Our target variable, car_loan is a dummy variable equal to 1 when the recipient has a car loan and 0 otherwise.
Of the receipts, 561 adopted car loans. This means we have an imbalanced dataset. Imbalanced data is a common challenge in classifier learning, as it can be biased toward the majority class. Balancing the dataset is essential to improve model performance. We applied the SMOTENC technique to oversample the minority class. This technique allows oversampling data containing both categorical and continuous variables. After oversampling SMOTE-ENN dataset contains 12 630 instances of the positive class (1) and 10 080 instances of the negative class (0). SMOTE-NC dataset 14 588 instances of positive and negative classes.
|
|
ICACT20250136 Slide.07
[Big slide for presentation]
|
Chrome Text-to-Speach Click!! |
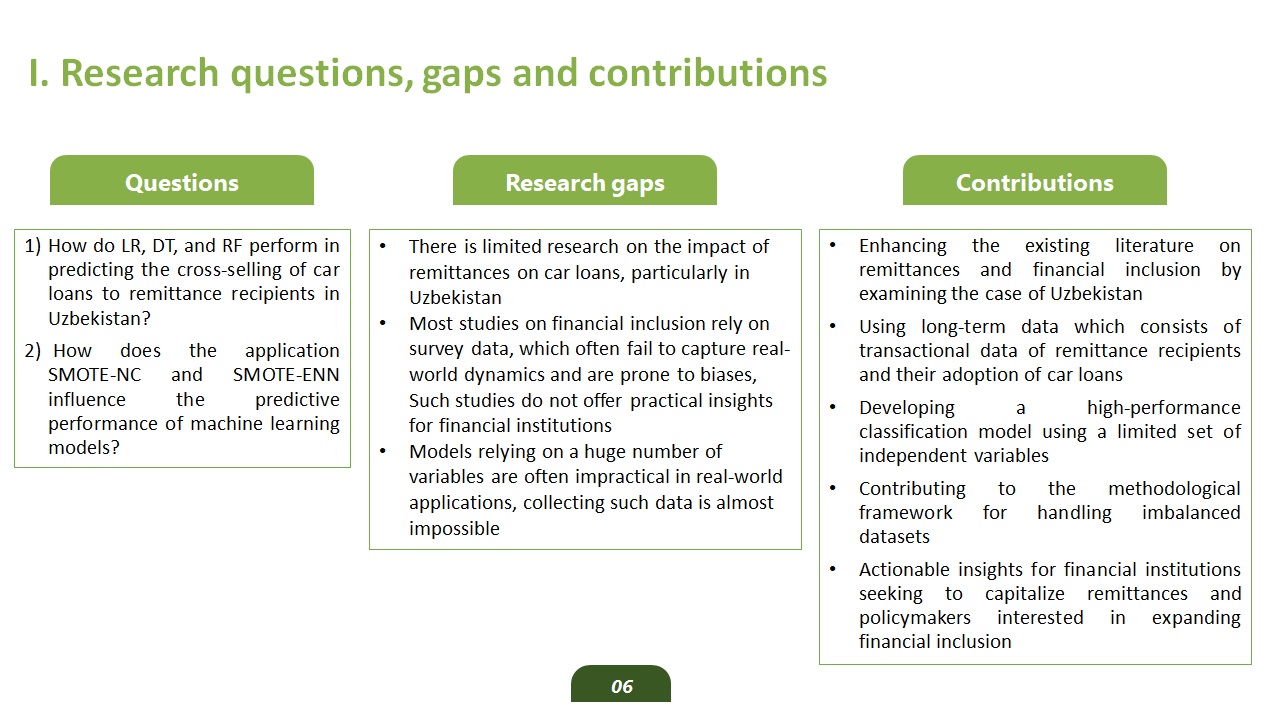 |
This study addresses these gaps by analyzing the relationship between remittances and vehicle financing using the latest transactional data. A commercial bank in Uzbekistan provides data on remittance receipts and vehicle loans, which includes transactions from January 2023 to October 2024. We apply LR, DT, and RF models to examine the nonlinear relationship between independent and dependent variables.
|
|
ICACT20250136 Slide.06
[Big slide for presentation]
|
Chrome Text-to-Speach Click!! |
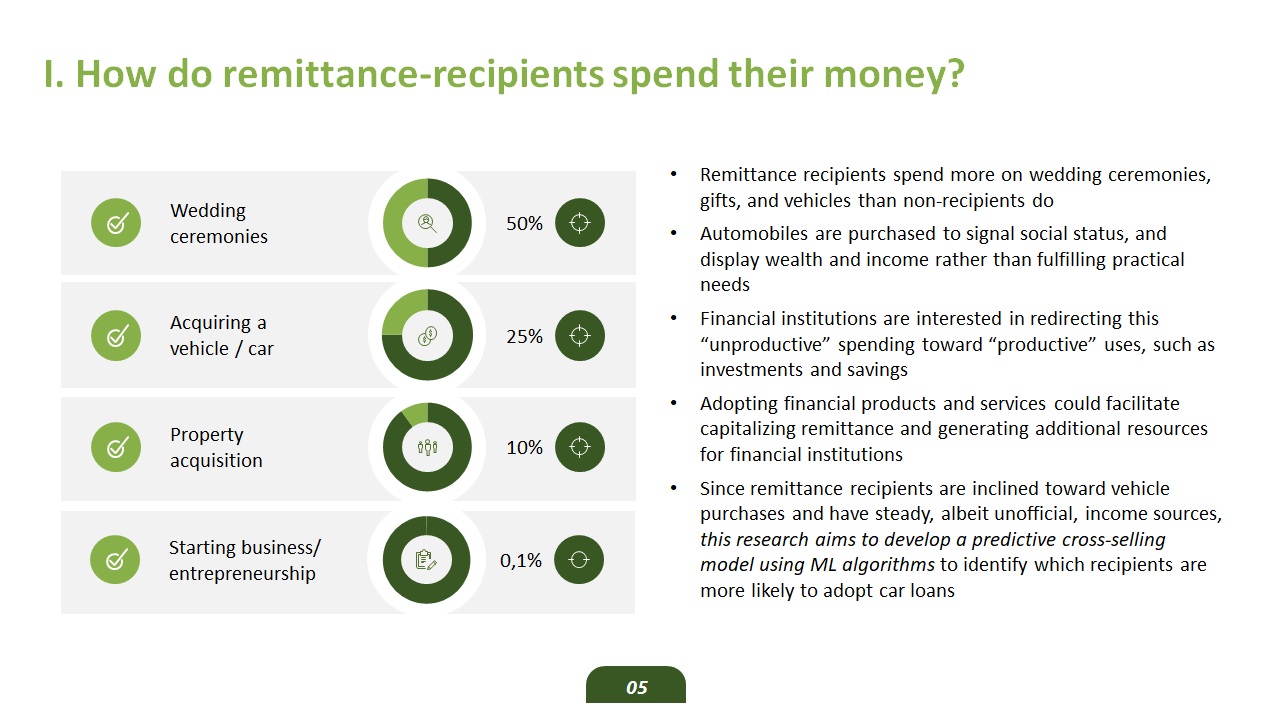 |
Remittance recipients spend more on wedding ceremonies, gifts, and vehicles than non-recipients do. Automobiles are purchased to signal social status, and display wealth and income rather than fulfilling practical needs. Financial institutions are interested in redirecting this “unproductive” spending toward “productive” uses, such as investments and savings. Adopting financial products and services could facilitate capitalizing remittance and generating additional resources for financial institutions.
Since remittance recipients are inclined toward vehicle purchases and have steady, albeit unofficial, income sources, this research aims to develop a predictive cross-selling model using ML algorithms to identify which recipients are more likely to adopt car loans.
|
|
ICACT20250136 Slide.05
[Big slide for presentation]
|
Chrome Text-to-Speach Click!! |
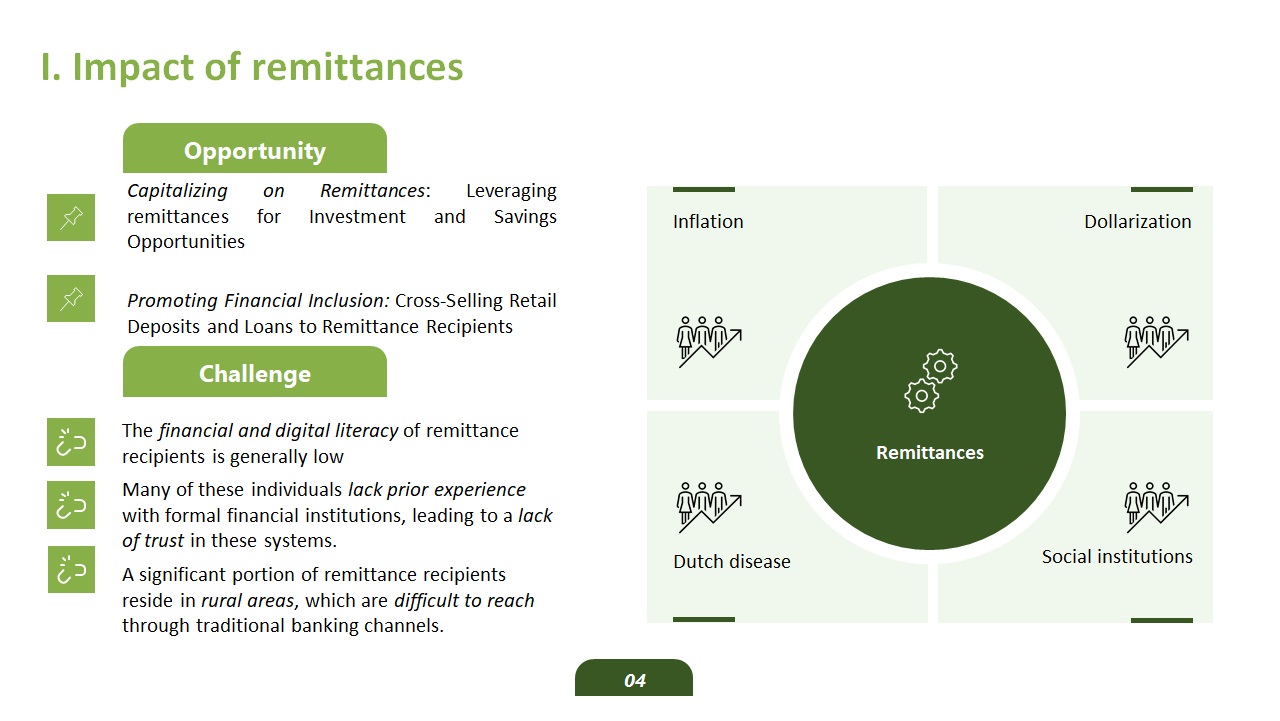 |
When a substantial volume of remittances is not effectively capitalized, it can result in adverse economic outcomes such as inflation, financial dollarization, the Dutch disease, and the disruption of social institutions. The increasing volume of remittances presents both opportunities and challenges for financial institutions, requiring strategic responses to optimize the economic benefits while mitigating potential risks.
|
|
ICACT20250136 Slide.04
[Big slide for presentation]
|
Chrome Text-to-Speach Click!! |
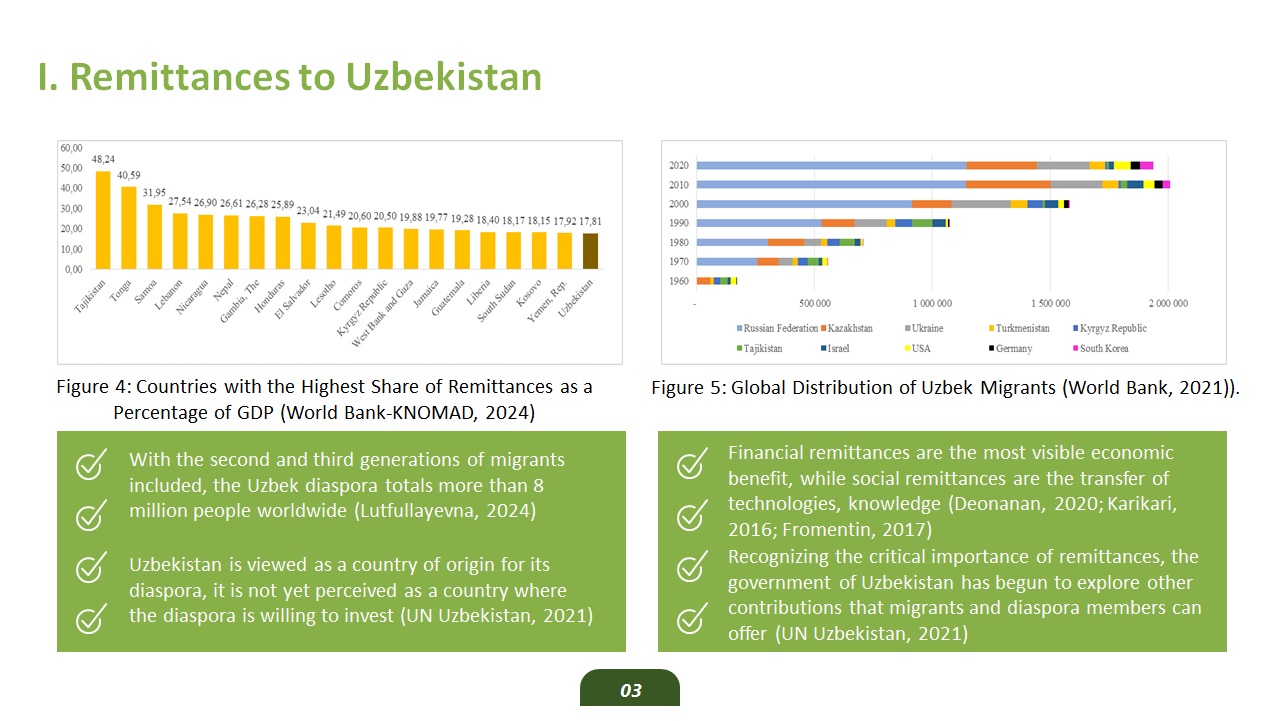 |
Uzbekistan is among the most remittance-dependent countries globally, with remittances contributing nearly 20% to its GDP. The inflow of remittances to Uzbekistan represents a sustained trend rather than a temporary occurrence. This growth is closely linked to the increasing number of Uzbek migrants abroad, which continues to drive the upward trajectory of remittance volumes.
|
|
ICACT20250136 Slide.03
[Big slide for presentation]
|
Chrome Text-to-Speach Click!! |
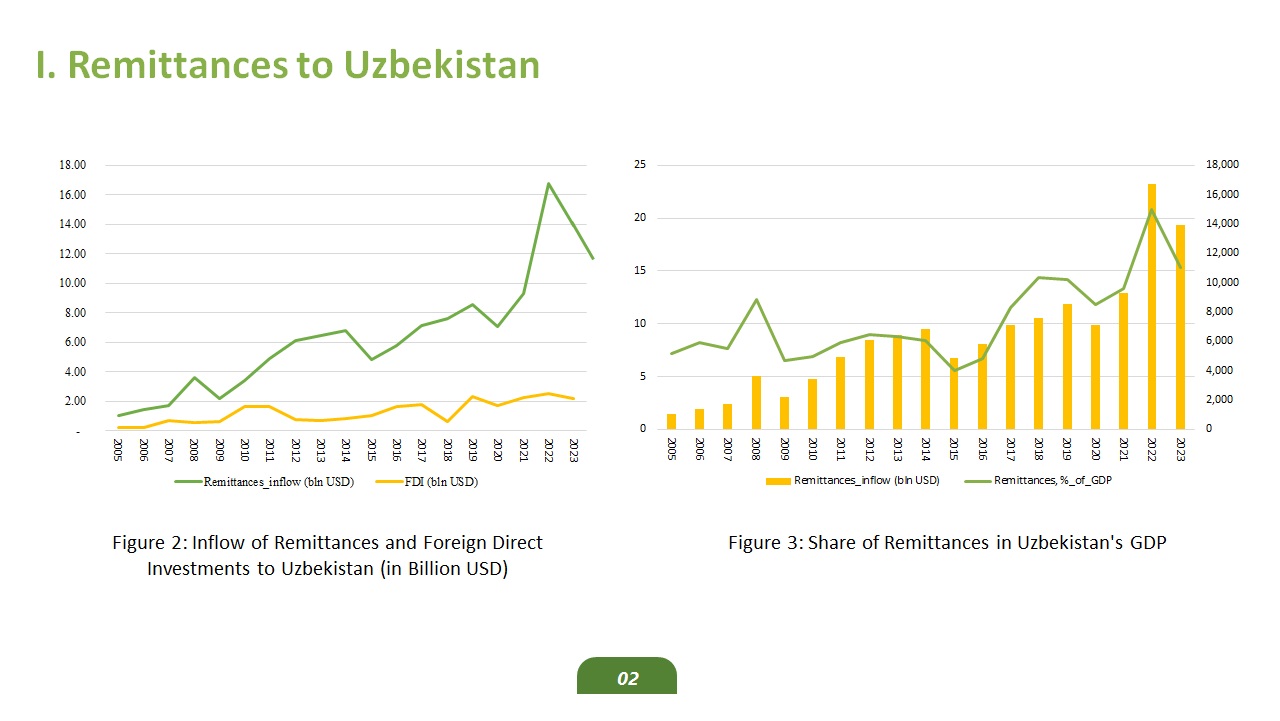 |
In Uzbekistan, the volume of inflow remittances is significantly higher than the volume of foreign direct investments. Remittances constitute nearly 20% of the country's GDP, and for many people in rural areas, migration and remittances serve as the main sources of income.
|
|
ICACT20250136 Slide.02
[Big slide for presentation]
|
Chrome Text-to-Speach Click!! |
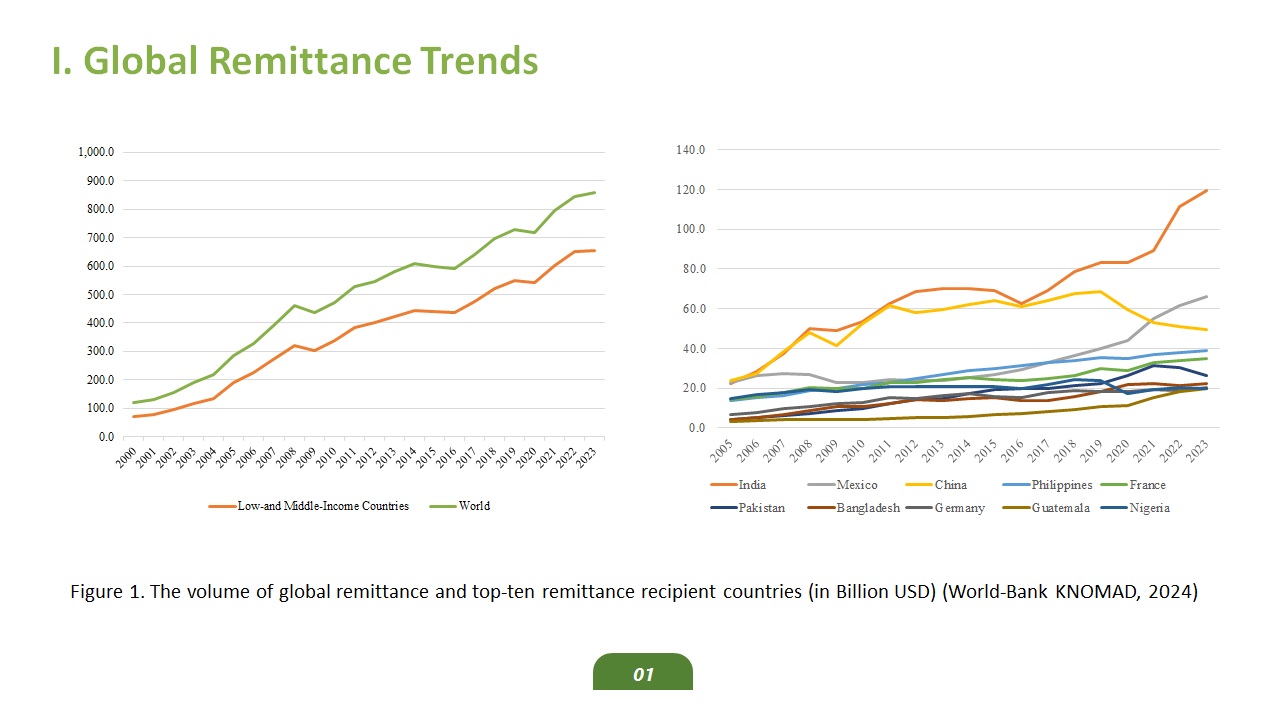 |
Slide 1 presents an overview of the global remittance landscape: the volume of global remittances exceeded 800 billion USD in 2023, with 75% of remittances received by developing countries. The top ten recipient countries include India, which leads, followed by China and Mexico. Remittances play a critical role in supporting the economies and livelihoods of these nations.
|
|
ICACT20250136 Slide.01
[Big slide for presentation]
[YouTube] |
Chrome Text-to-Speach Click!! |
 |
Cross-Selling Car Loans to Remittance Recipients in Uzbekistan: A Machine Learning Approach Using SMOTE-ENN
Masuda Isaeva
Independent researcher
|
















