 ICACT20250085 Slide.15
[Big slide for presentation] |
Chrome Text-to-Speach Click!! |
 |
Thank for your listening! Do you have any questions?
|
|
ICACT20250085 Slide.14
[Big slide for presentation]
|
Chrome Text-to-Speach Click!! |
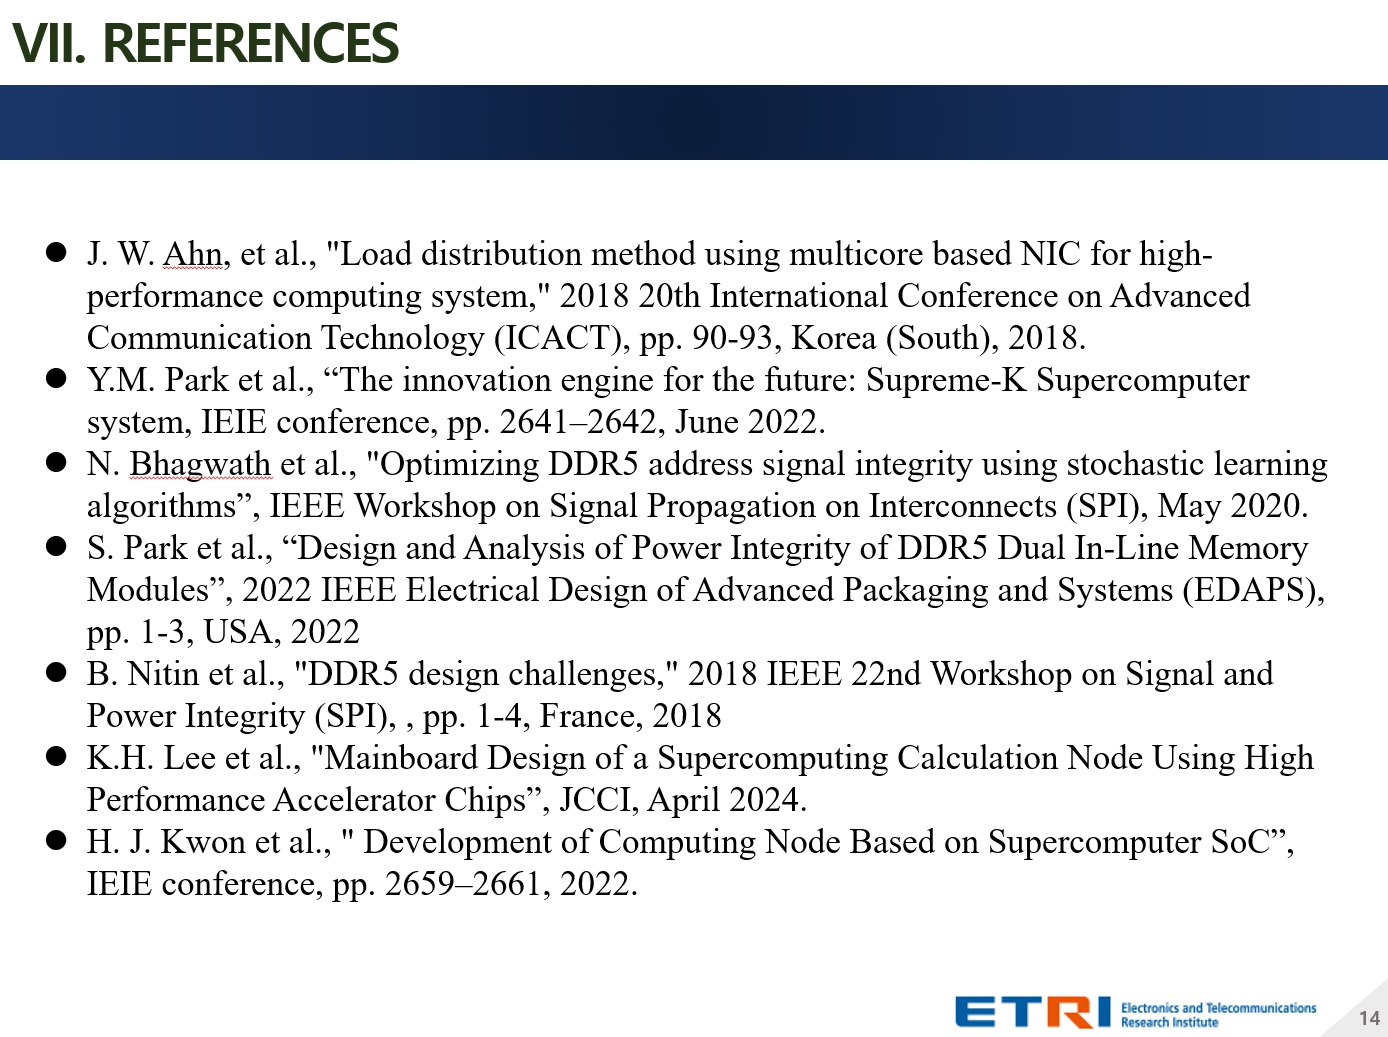 |
REFERENCES are as follows.
|
|
ICACT20250085 Slide.13
[Big slide for presentation]
|
Chrome Text-to-Speach Click!! |
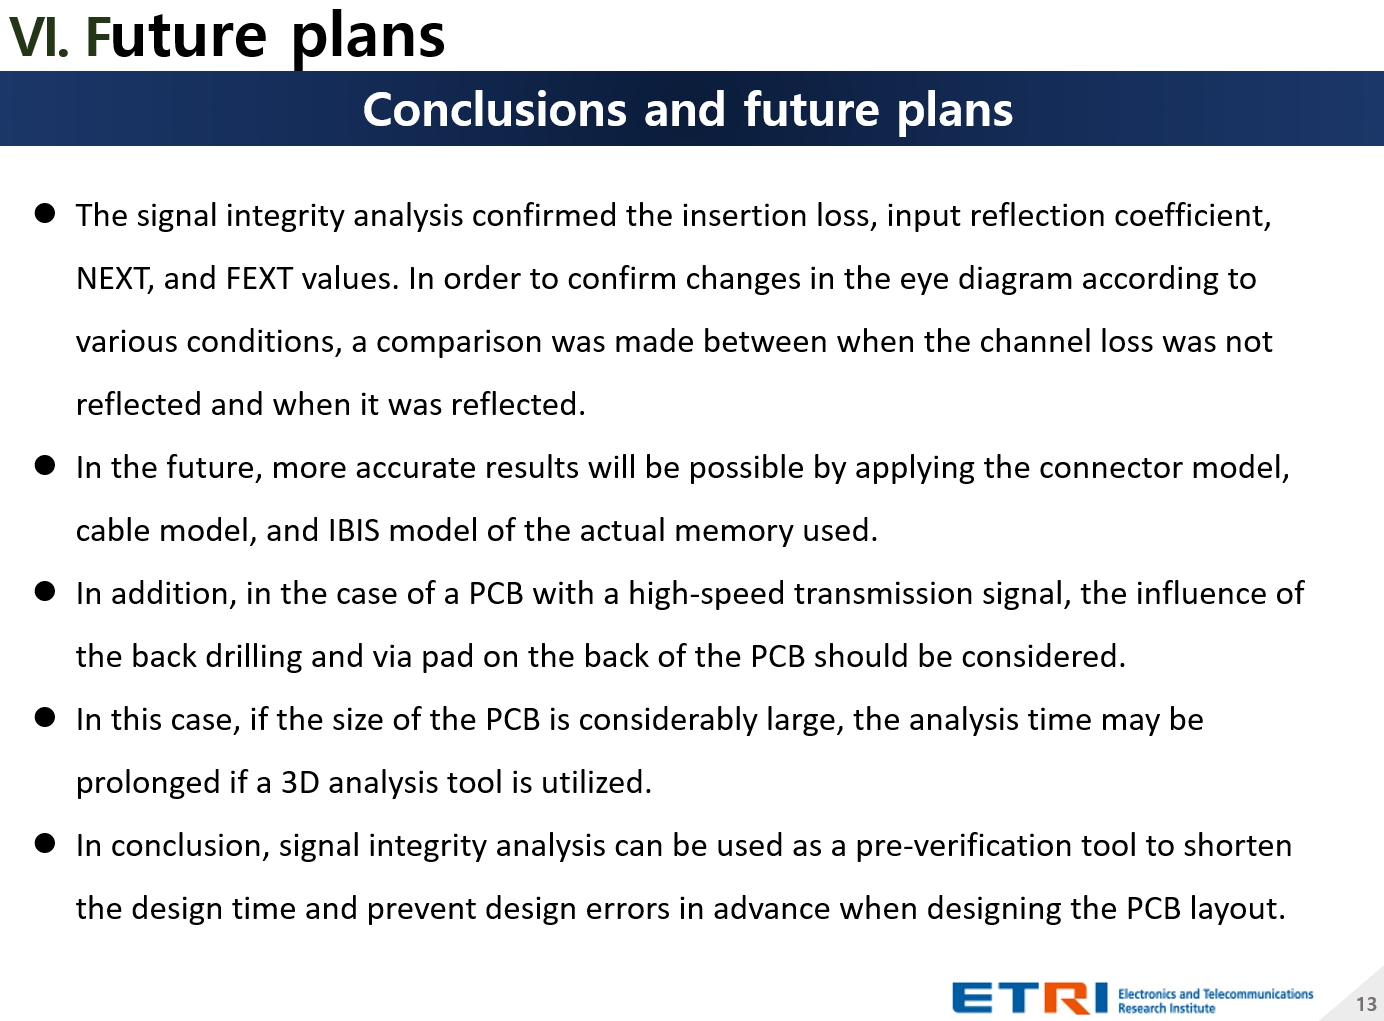 |
The signal integrity analysis confirmed the insertion loss, input reflection coefficient, NEXT, and FEXT values. In order to confirm changes in the eye diagram according to various conditions, a comparison was made between when the channel loss was not reflected and when it was reflected.
In the future, more accurate results will be possible by applying the connector model, cable model, and IBIS model of the actual memory used.
In addition, in the case of a PCB with a high-speed transmission signal, the influence of the back drilling and via pad on the back of the PCB should be considered.
In this case, if the size of the PCB is considerably large, the analysis time may be prolonged if a 3D analysis tool is utilized.
In conclusion, signal integrity analysis can be used as a pre-verification tool to shorten the design time and prevent design errors in advance when designing the PCB layout.
|
|
ICACT20250085 Slide.12
[Big slide for presentation]
|
Chrome Text-to-Speach Click!! |
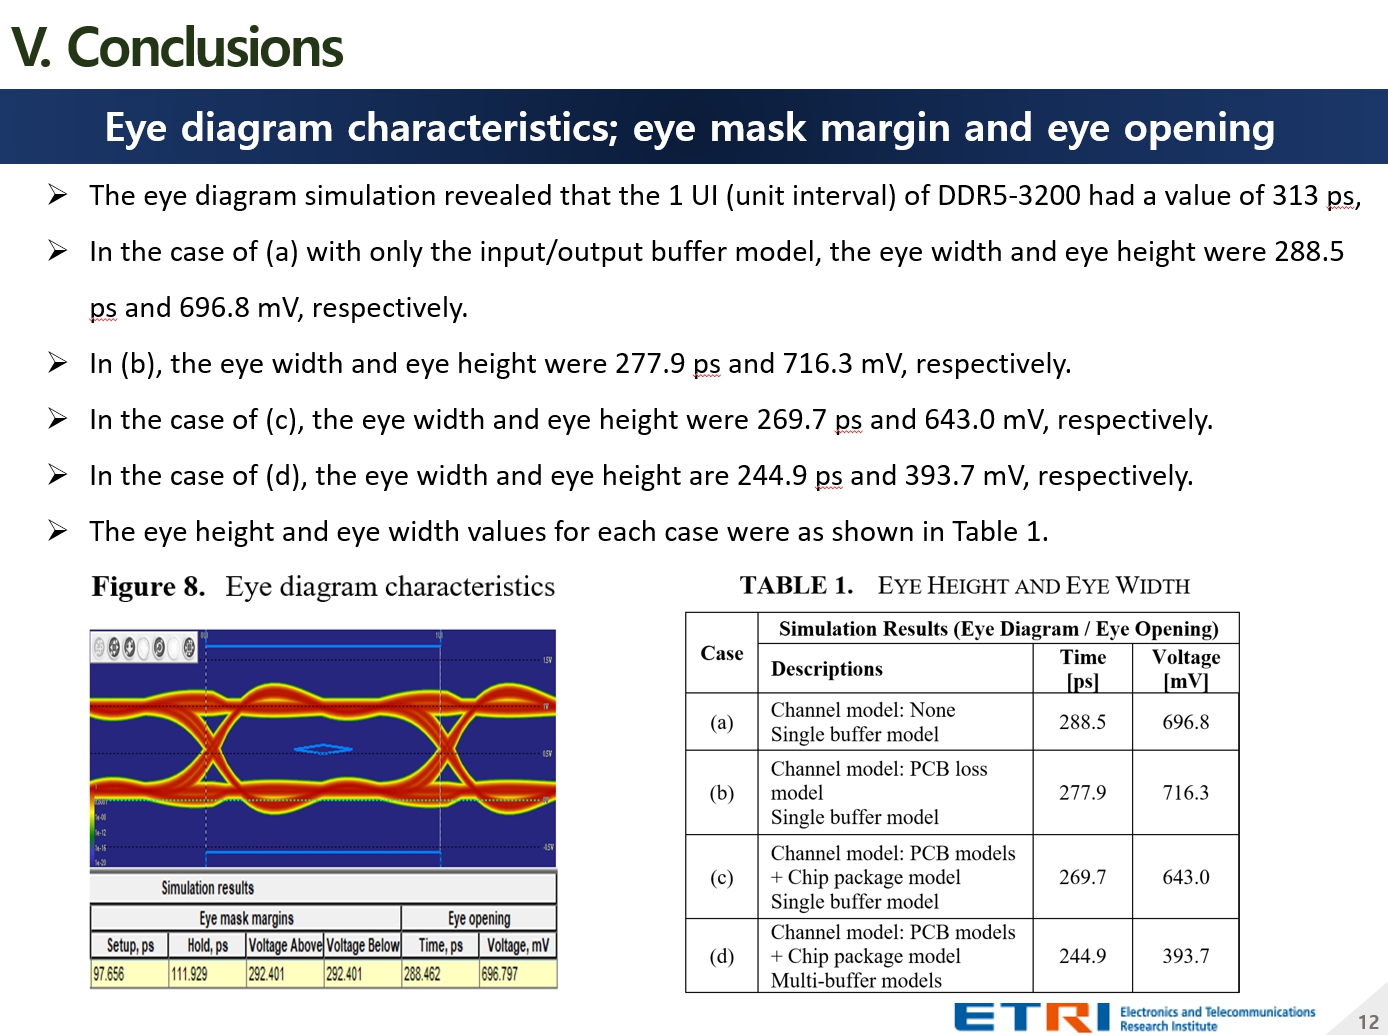 |
The eye diagram simulation revealed that the 1 UI (unit interval) of DDR5-3200 had a value of 313 ps,
In the case of (a) with only the input/output buffer model, the eye width and eye height were 288.5 ps and 696.8 mV, respectively.
In (b), the eye width and eye height were 277.9 ps and 716.3 mV, respectively.
In the case of (c), the eye width and eye height were 269.7 ps and 643.0 mV, respectively.
In the case of (d), the eye width and eye height are 244.9 ps and 393.7 mV, respectively.
The eye height and eye width values for each case were as shown in Table 1.
|
|
ICACT20250085 Slide.11
[Big slide for presentation]
|
Chrome Text-to-Speach Click!! |
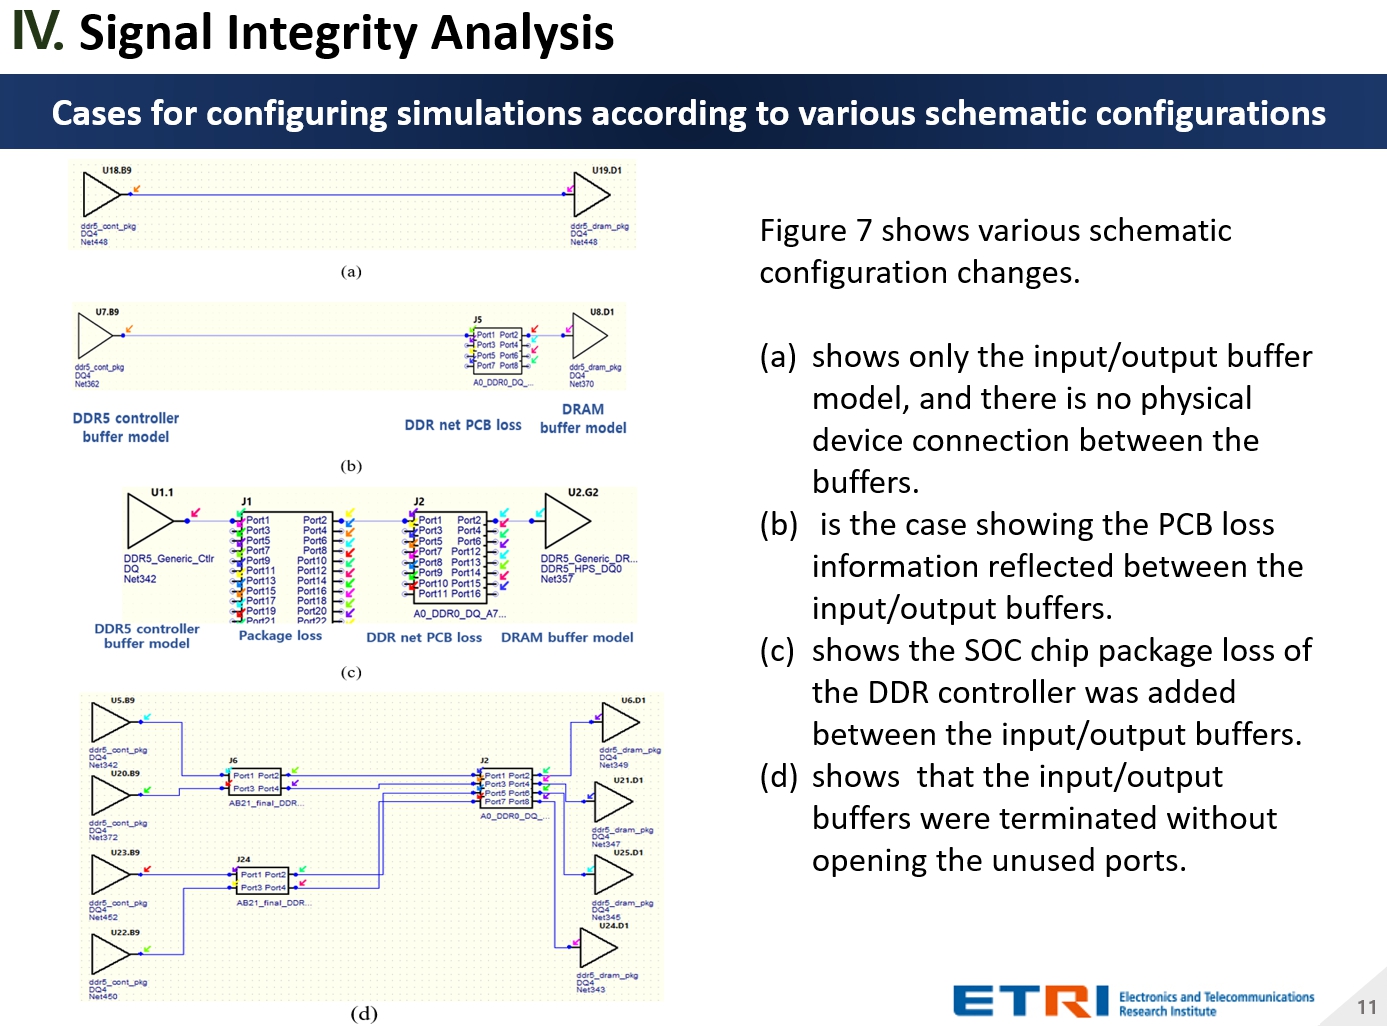 |
A shows only the input/output buffer model, and there is no physical device connection between the buffers.
B is the case showing the PCB loss information reflected between the input/output buffers.
C shows the SOC chip package loss of the DDR controller was added between the input/output buffers.
D shows that the input/output buffers were terminated without opening the unused ports.
|
|
ICACT20250085 Slide.10
[Big slide for presentation]
|
Chrome Text-to-Speach Click!! |
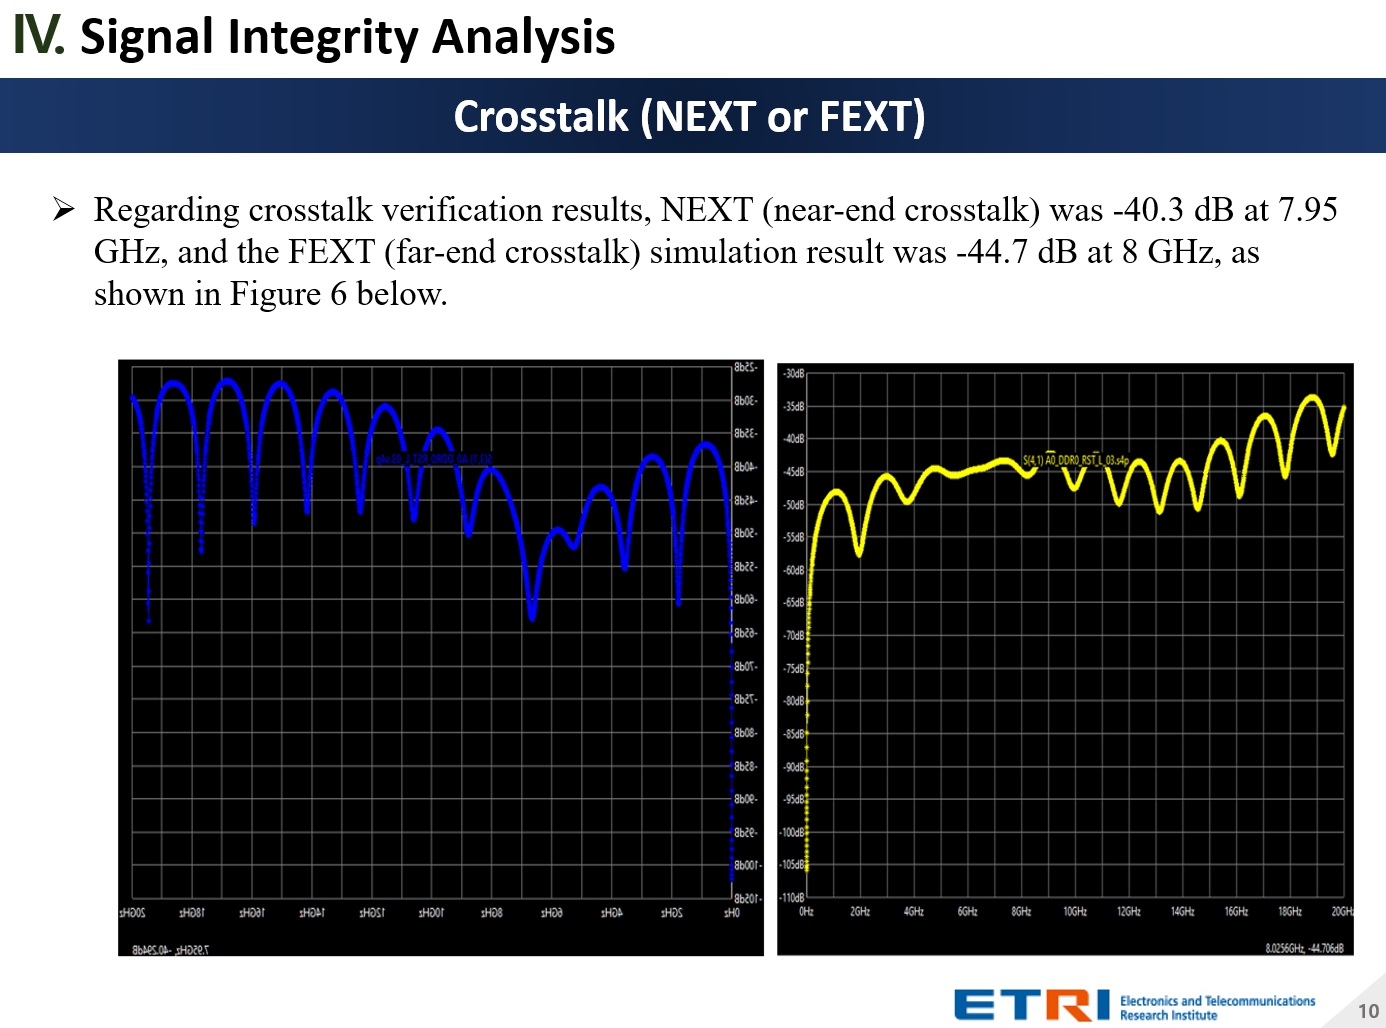 |
Regarding crosstalk verification results, NEXT (near-end crosstalk) was -40.3 dB at 7.95 GHz, and the FEXT (far-end crosstalk) simulation result was -44.7 dB at 8 GHz, as shown in Figure 6 below.
|
|
ICACT20250085 Slide.09
[Big slide for presentation]
|
Chrome Text-to-Speach Click!! |
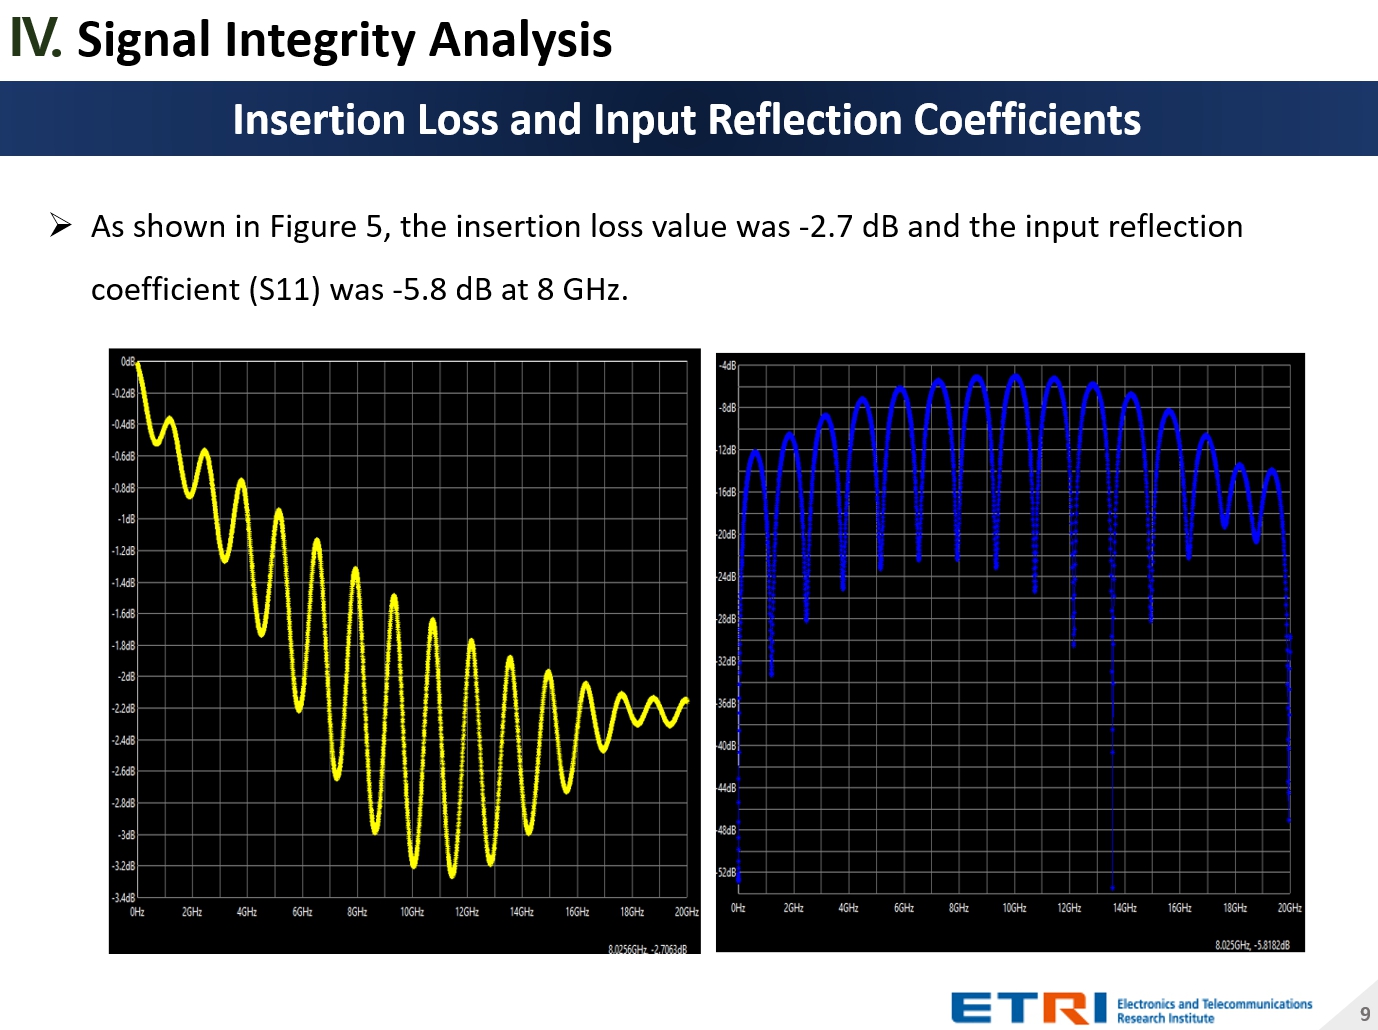 |
As shown in Figure 5, the insertion loss value was -2.7 dB and the input reflection coefficient S11 was -5.8 dB at 8 GHz.
|
|
ICACT20250085 Slide.08
[Big slide for presentation]
|
Chrome Text-to-Speach Click!! |
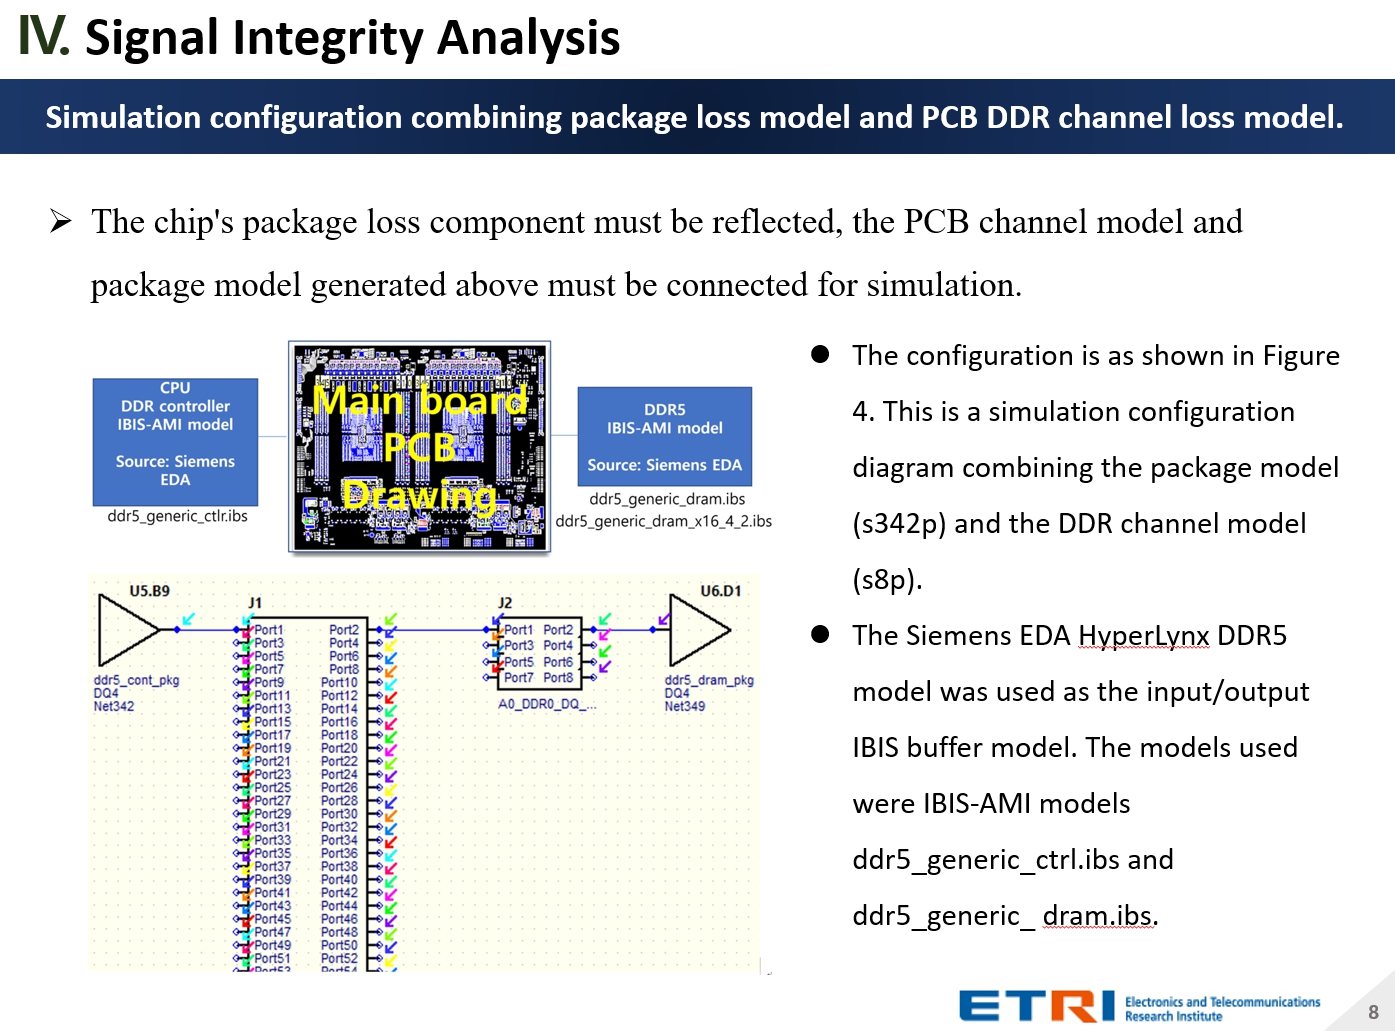 |
The configuration is as shown in Figure 4. This is a simulation configuration diagram combining the package model (s342p) and the DDR channel model (s8p).
The Siemens EDA HyperLynx DDR5 model was used as the input/output IBIS buffer model. The models used were IBIS-AMI models ddr5_generic_ctrl.ibs and ddr5_generic_ dram.ibs.
|
|
ICACT20250085 Slide.07
[Big slide for presentation]
|
Chrome Text-to-Speach Click!! |
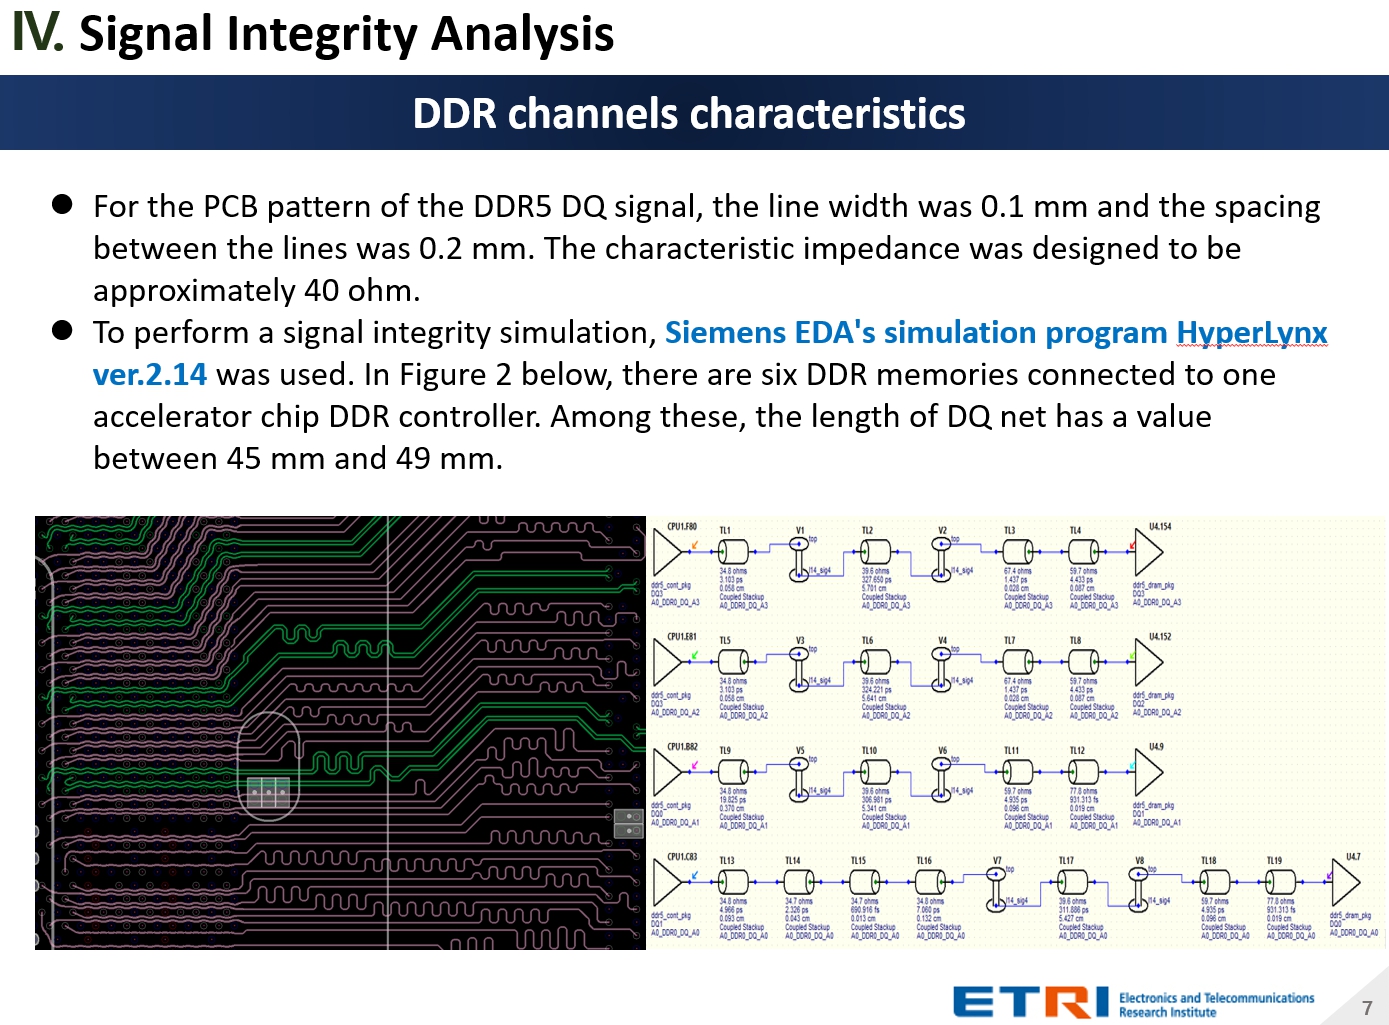 |
For the PCB pattern of the DDR5 DQ signal, the line width was 0.1 mm and the spacing between the lines was 0.2 mm. The characteristic impedance was designed to be approximately 40 ohm.
To perform a signal integrity simulation, Siemens EDA's simulation program HyperLynx ver.2.14 was used. In Figure 2 below, there are six DDR memories connected to one accelerator chip DDR controller. Among these, the length of DQ net has a value between 45 mm and 49 mm.
|
|
ICACT20250085 Slide.06
[Big slide for presentation]
|
Chrome Text-to-Speach Click!! |
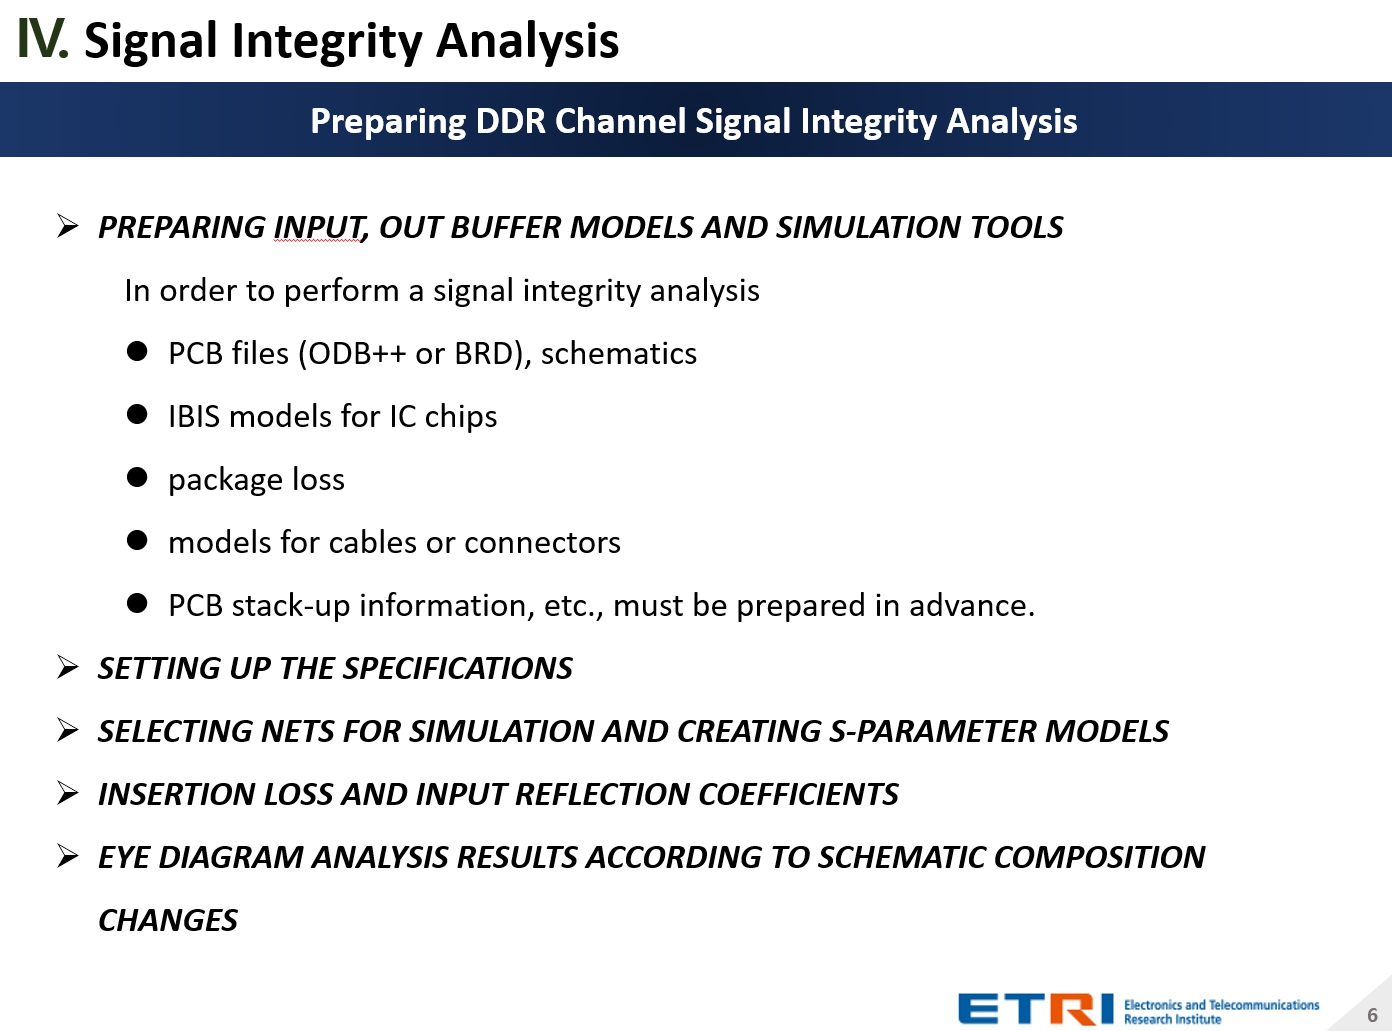 |
Preparing InPut, Out buffer models and simulation tools
In order to perform a signal integrity analysis
PCB files (ODB++ or BRD), schematics
IBIS models for IC chips
package loss
models for cables or connectors
PCB stack-up information, etc., must be prepared in advance.
Setting up the specifications
Selecting Nets for Simulation and Creating S-parameter Models
Insertion Loss and Input Reflection Coefficients
Eye Diagram Analysis Results According to Schematic Composition Changes
|
|
ICACT20250085 Slide.05
[Big slide for presentation]
|
Chrome Text-to-Speach Click!! |
 |
Since high-speed signals of 7 GHz or faster are transmitted along the PCB lines where the memory is connected, signal strength loss occurs due to signal reflection and coupling. Since the 0.1 mm thick lines are closely spaced at 0.2 mm intervals, they can interfere with each other and cause crosstalk. Therefore, it is necessary to analyze the characteristics of the high-speed signal lines on the PCB drawing in advance before printing the PCB.
For DRAM mounted on the PCB, DIMM performance can have a great impact.
Also, DDR channels are vulnerable to ISI (intersymbol innterference) effects.
|
|
ICACT20250085 Slide.04
[Big slide for presentation]
|
Chrome Text-to-Speach Click!! |
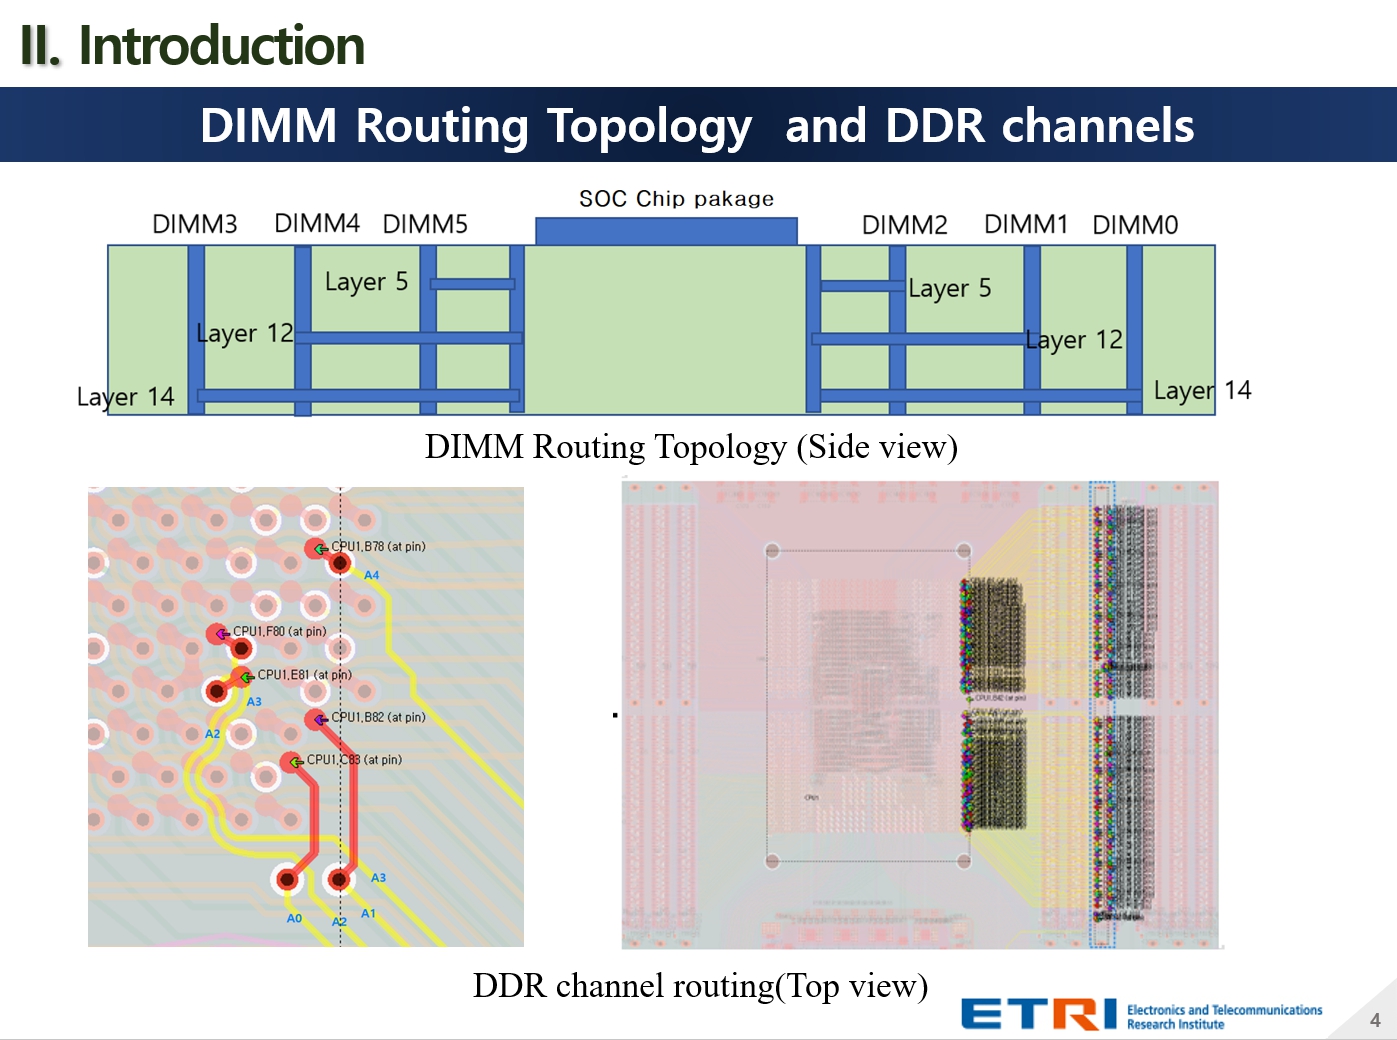 |
The DIMM Routing Topology and DDR channel geometry are as follows. 6 DIMMs are placed on a 16-layer PCB as shown in the figure.
|
|
ICACT20250085 Slide.03
[Big slide for presentation]
|
Chrome Text-to-Speach Click!! |
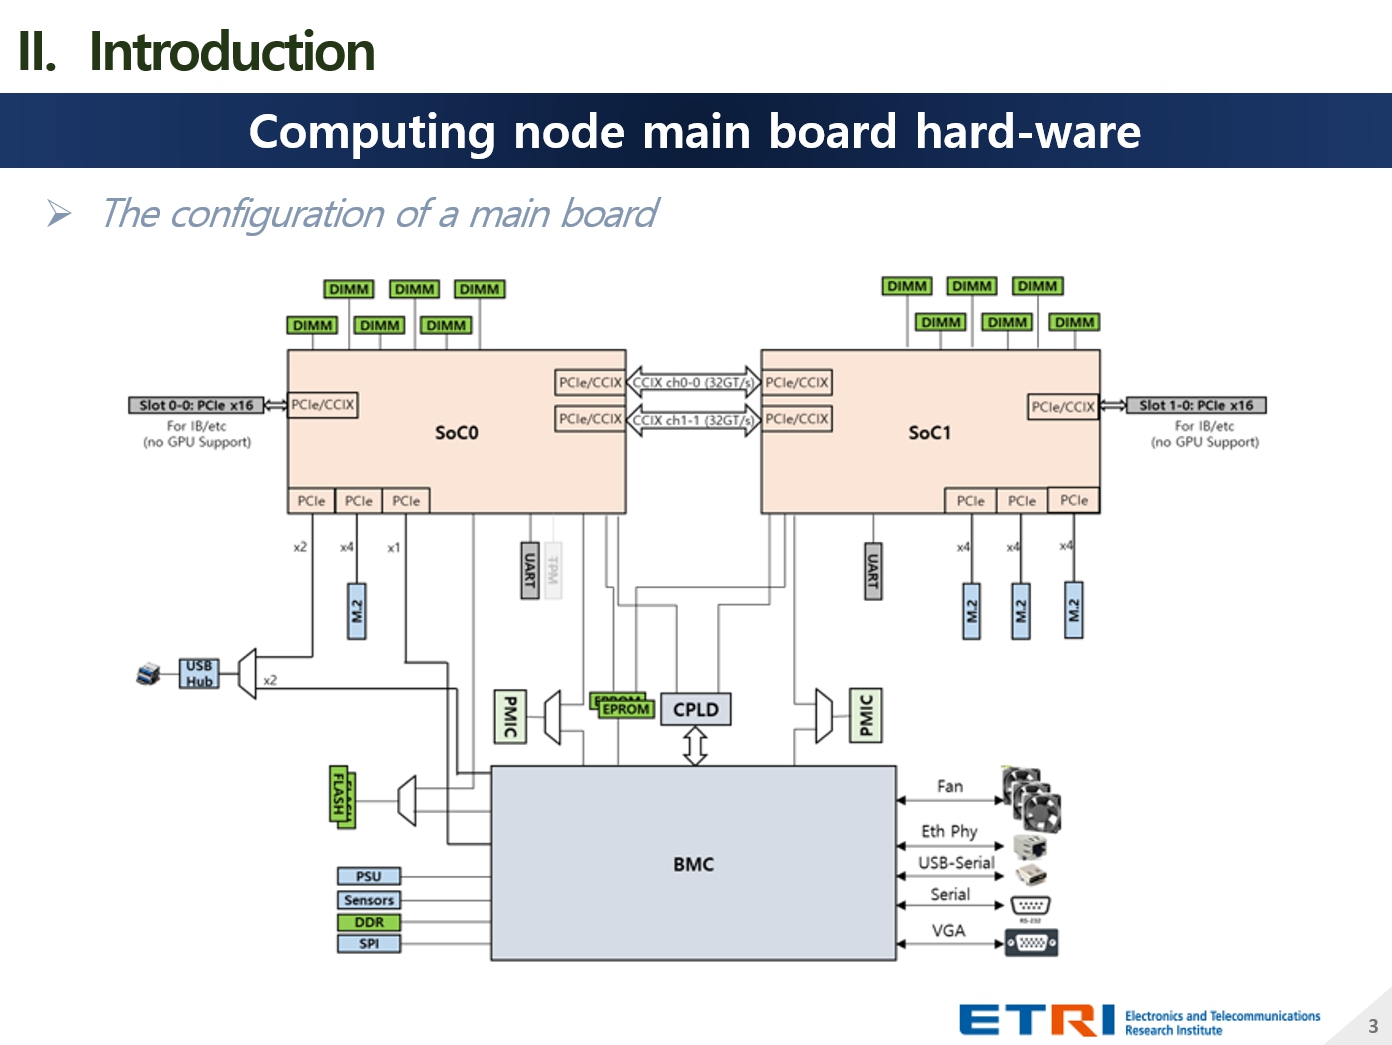 |
The configuration of a main board is as follows.
|
|
ICACT20250085 Slide.02
[Big slide for presentation]
|
Chrome Text-to-Speach Click!! |
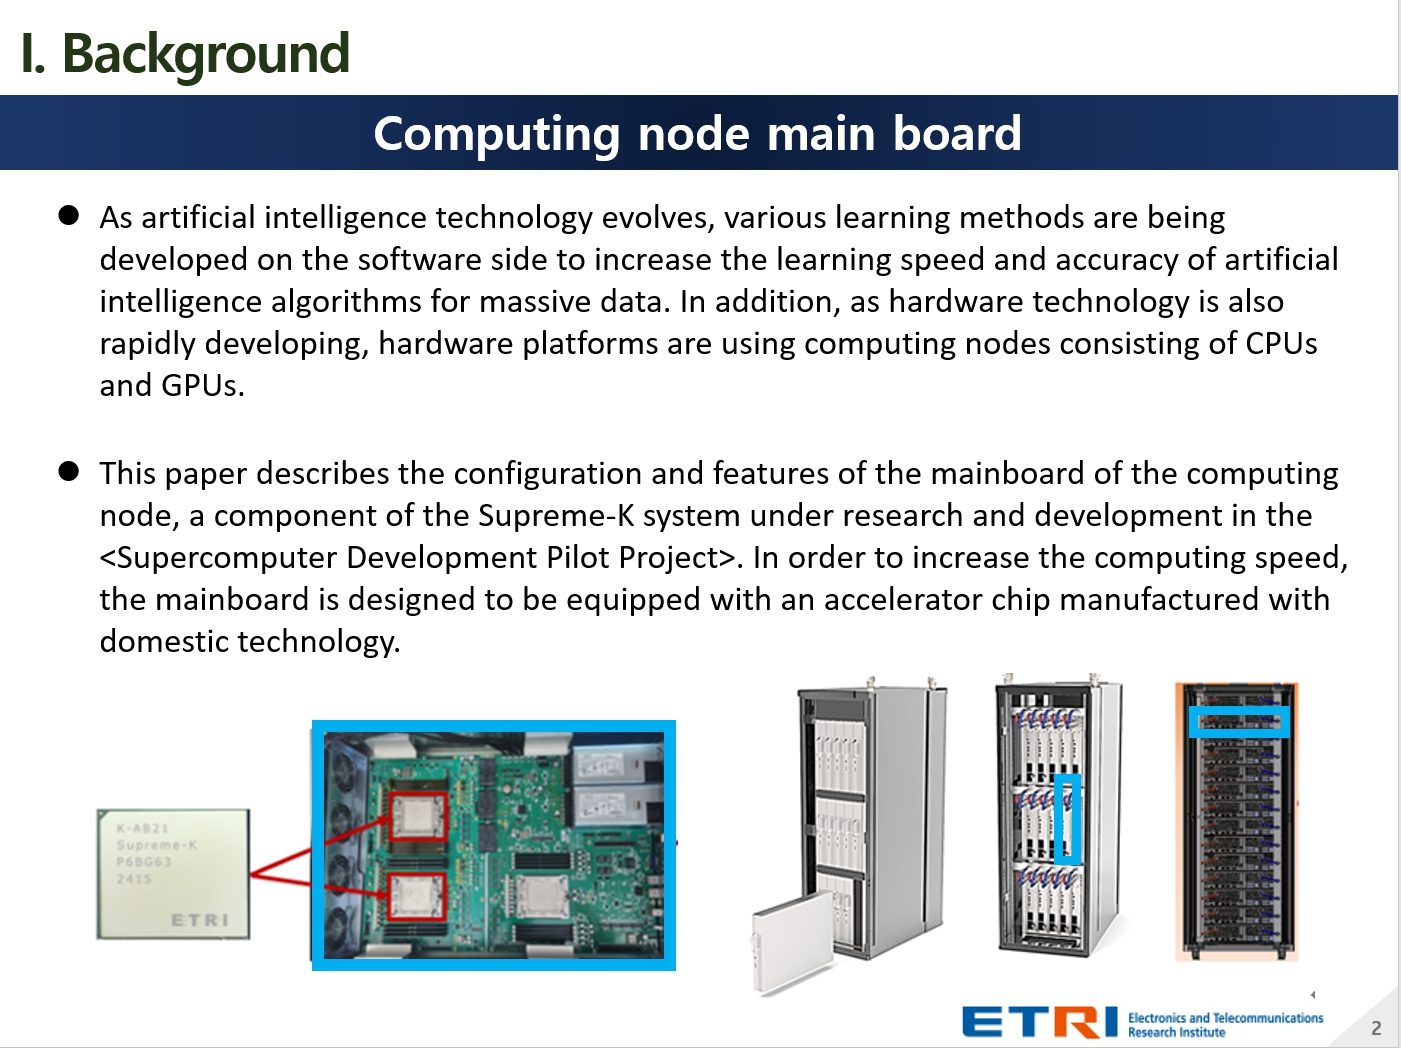 |
As artificial intelligence technology evolves, various learning methods are being developed on the software side to increase the learning speed and accuracy of artificial intelligence algorithms for massive data. In addition, as hardware technology is also rapidly developing, hardware platforms are using computing nodes consisting of CPUs and GPUs.
This paper describes the configuration and features of the mainboard of the computing node, a component of the Supreme-K system under research and development in the . In order to increase the computing speed, the mainboard is designed to be equipped with an accelerator chip manufactured with domestic technology.
|
|
ICACT20250085 Slide.01
[Big slide for presentation]
|
Chrome Text-to-Speach Click!! |
 |
Hi everybody, my name is Kyong Hee. For ICACT 2025, I have cooperated with two partners from ETRI. Our presentation today is about An Analysis of DDR Channel Signal Integrity on a High-Performance Computing Mainboard
|
















