 ICACT20250181 Slide.20
[Big slide for presentation] |
Chrome Text-to-Speach Click!! |
 |
Thank you for your attention
|
|
ICACT20250181 Slide.19
[Big slide for presentation]
|
Chrome Text-to-Speach Click!! |
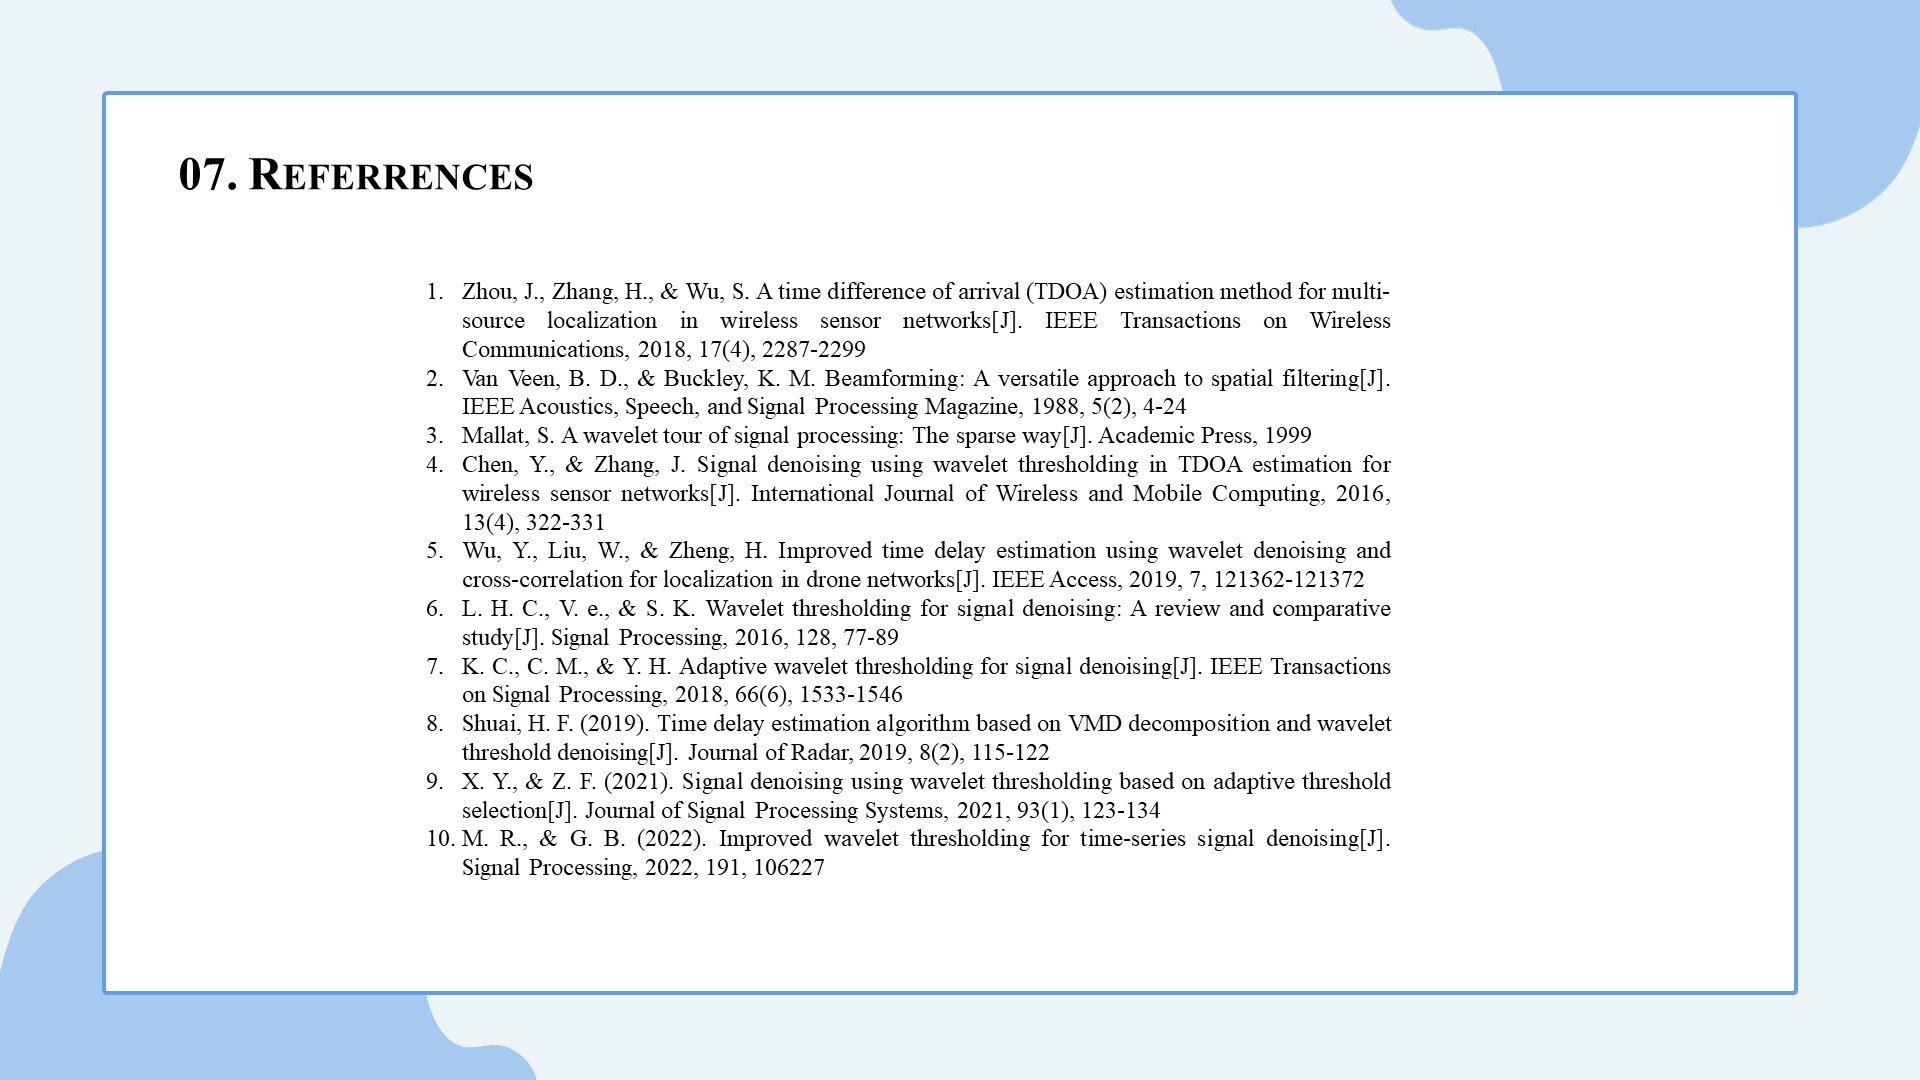 |
These are the referrences of this work
|
|
ICACT20250181 Slide.18
[Big slide for presentation]
|
Chrome Text-to-Speach Click!! |
 |
This research was supported in part by National Natural Science foundation of China
|
|
ICACT20250181 Slide.17
[Big slide for presentation]
|
Chrome Text-to-Speach Click!! |
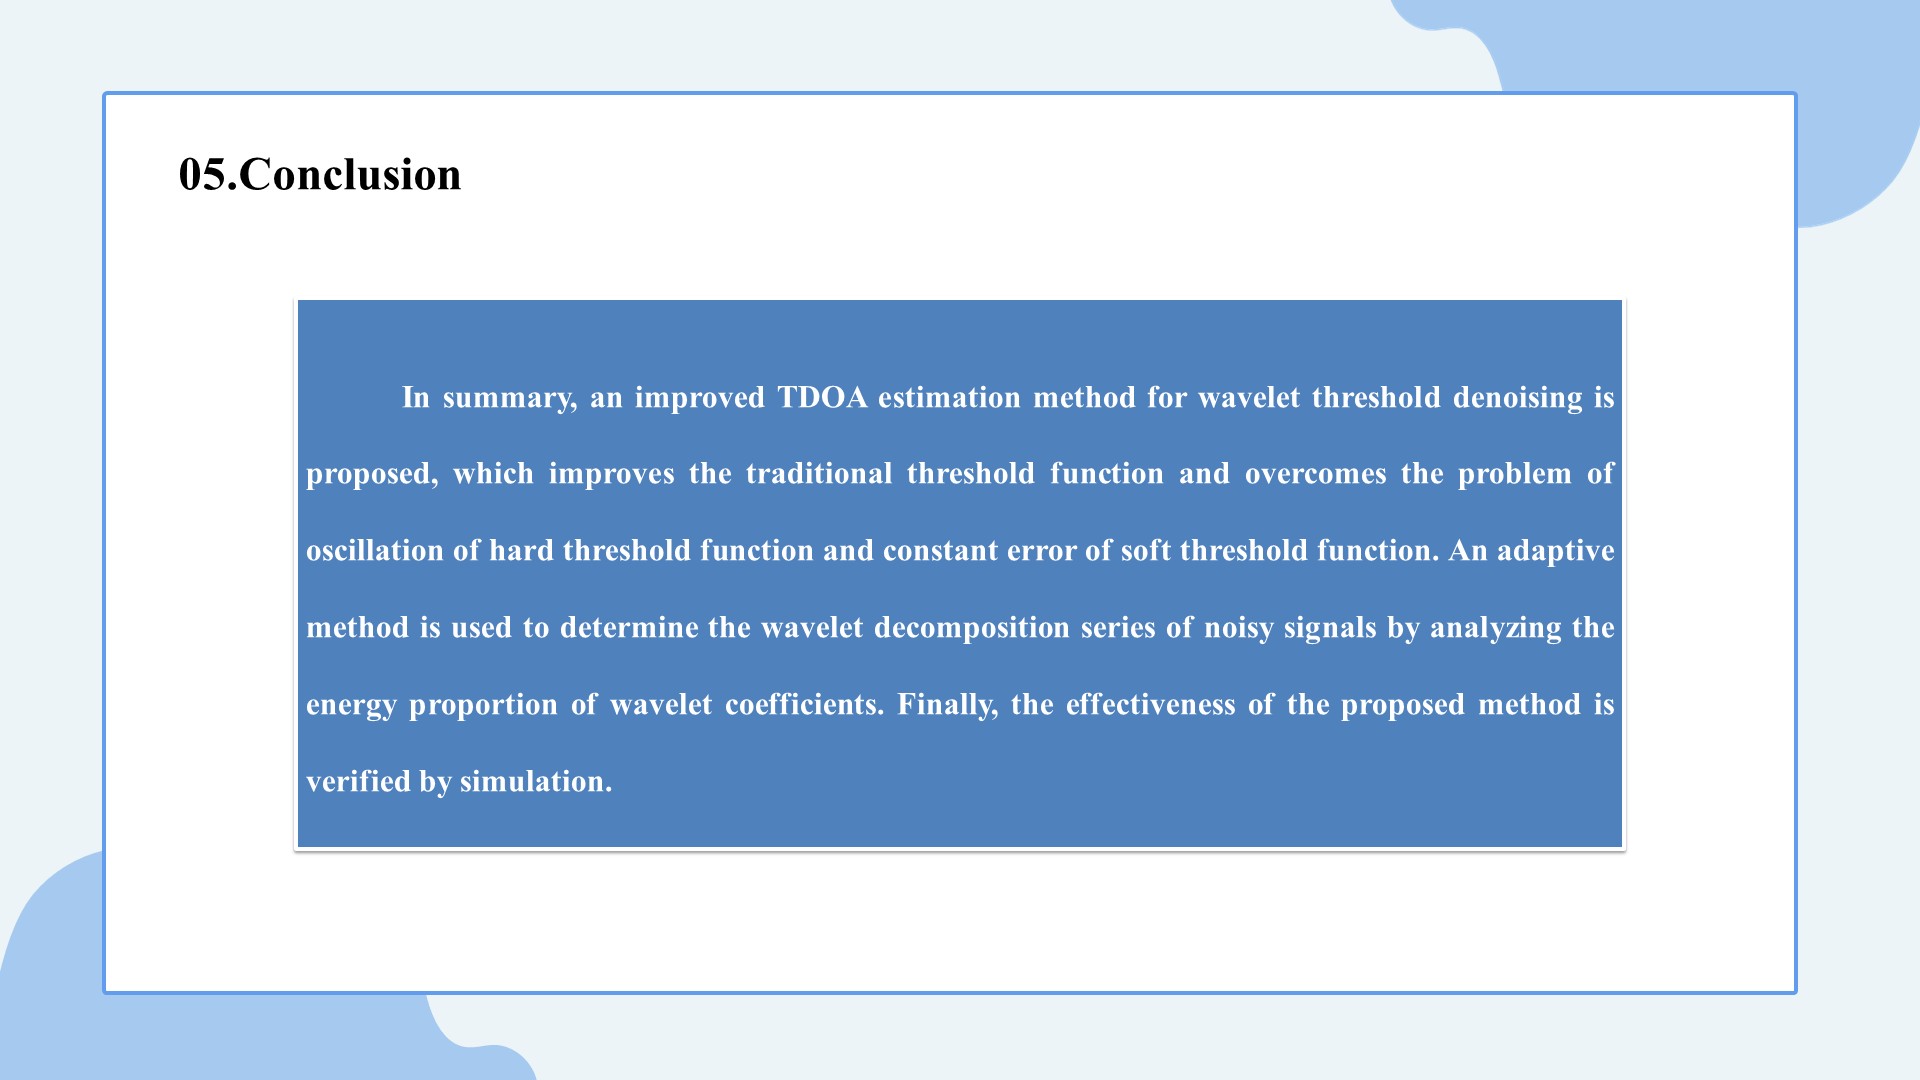 |
In conclusion, we developed a novel approach to enhance TDOA estimation through wavelet threshold denoising. Future work will focus on extending this method to real-time and more complex scenarios.
|
|
ICACT20250181 Slide.16
[Big slide for presentation]
|
Chrome Text-to-Speach Click!! |
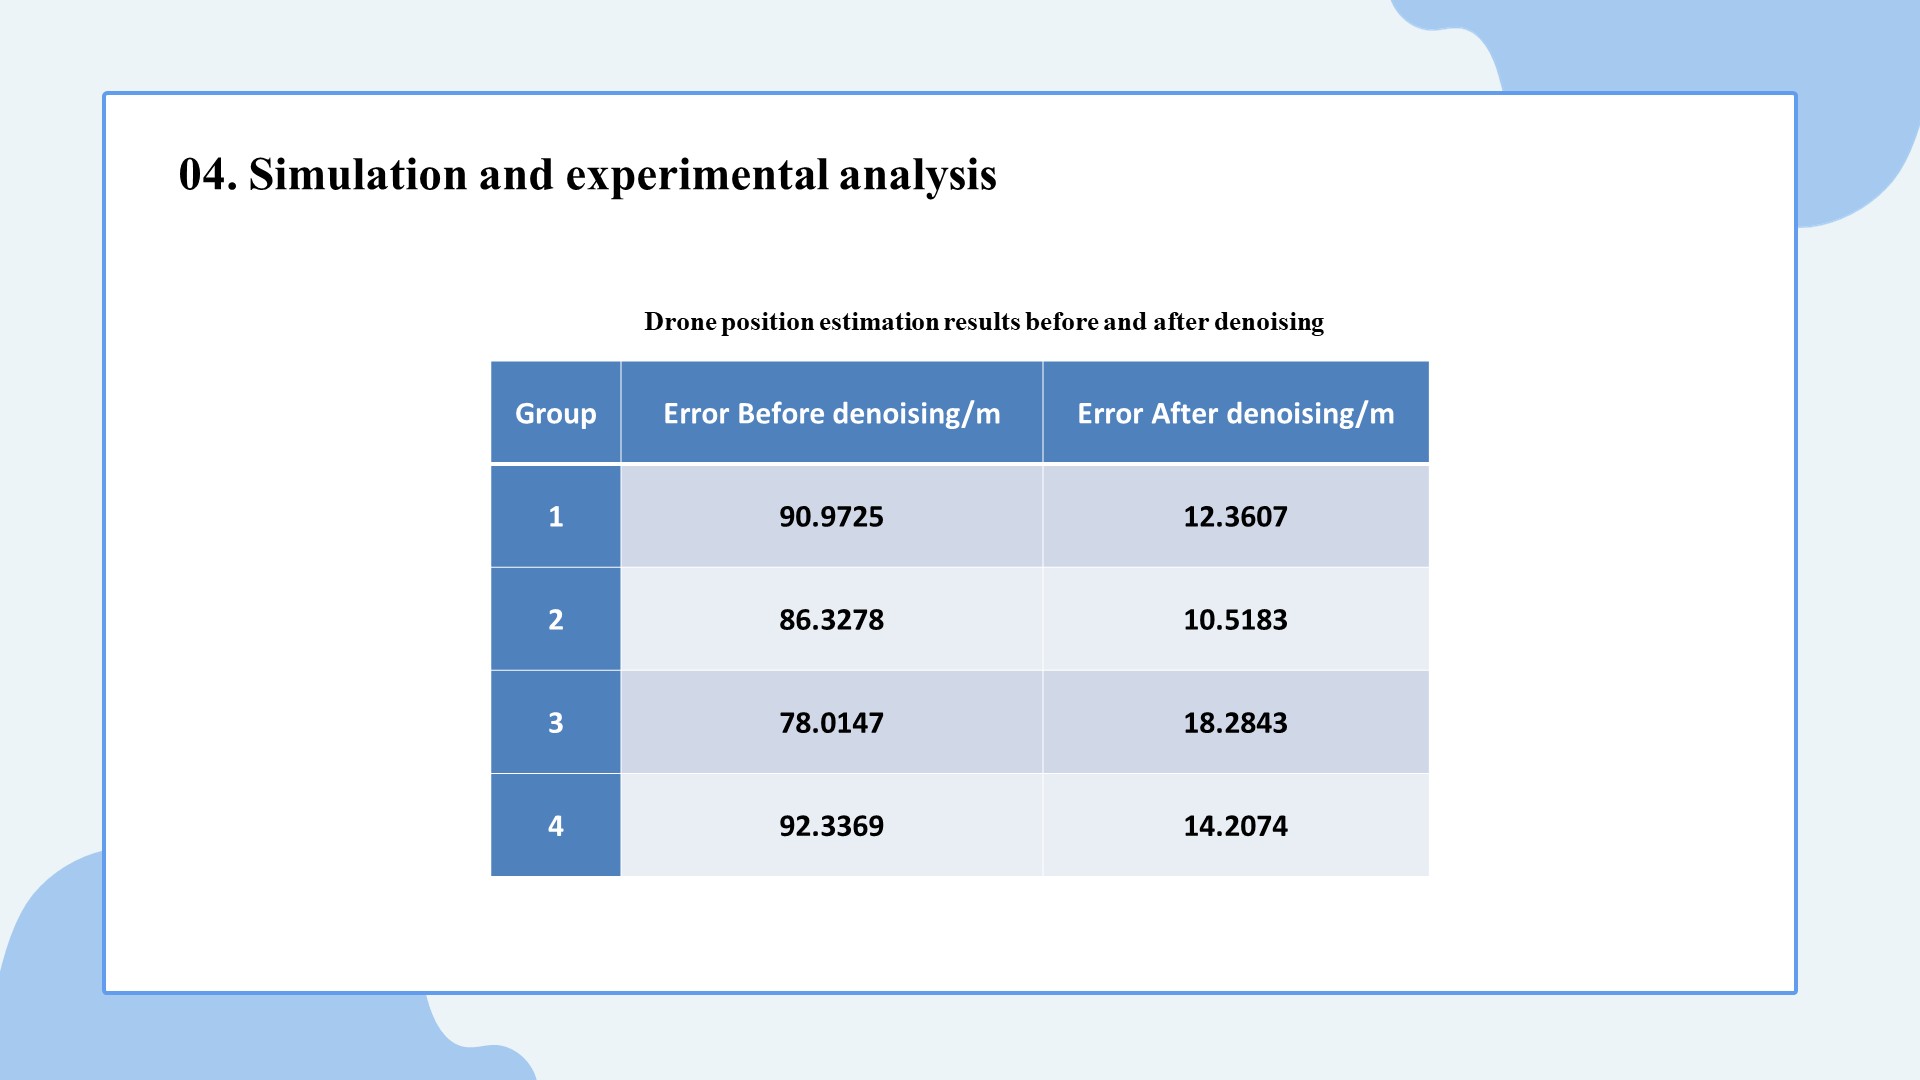 |
The results show a dramatic reduction in TDOA estimation errors after applying our denoising algorithm.
|
|
ICACT20250181 Slide.15
[Big slide for presentation]
|
Chrome Text-to-Speach Click!! |
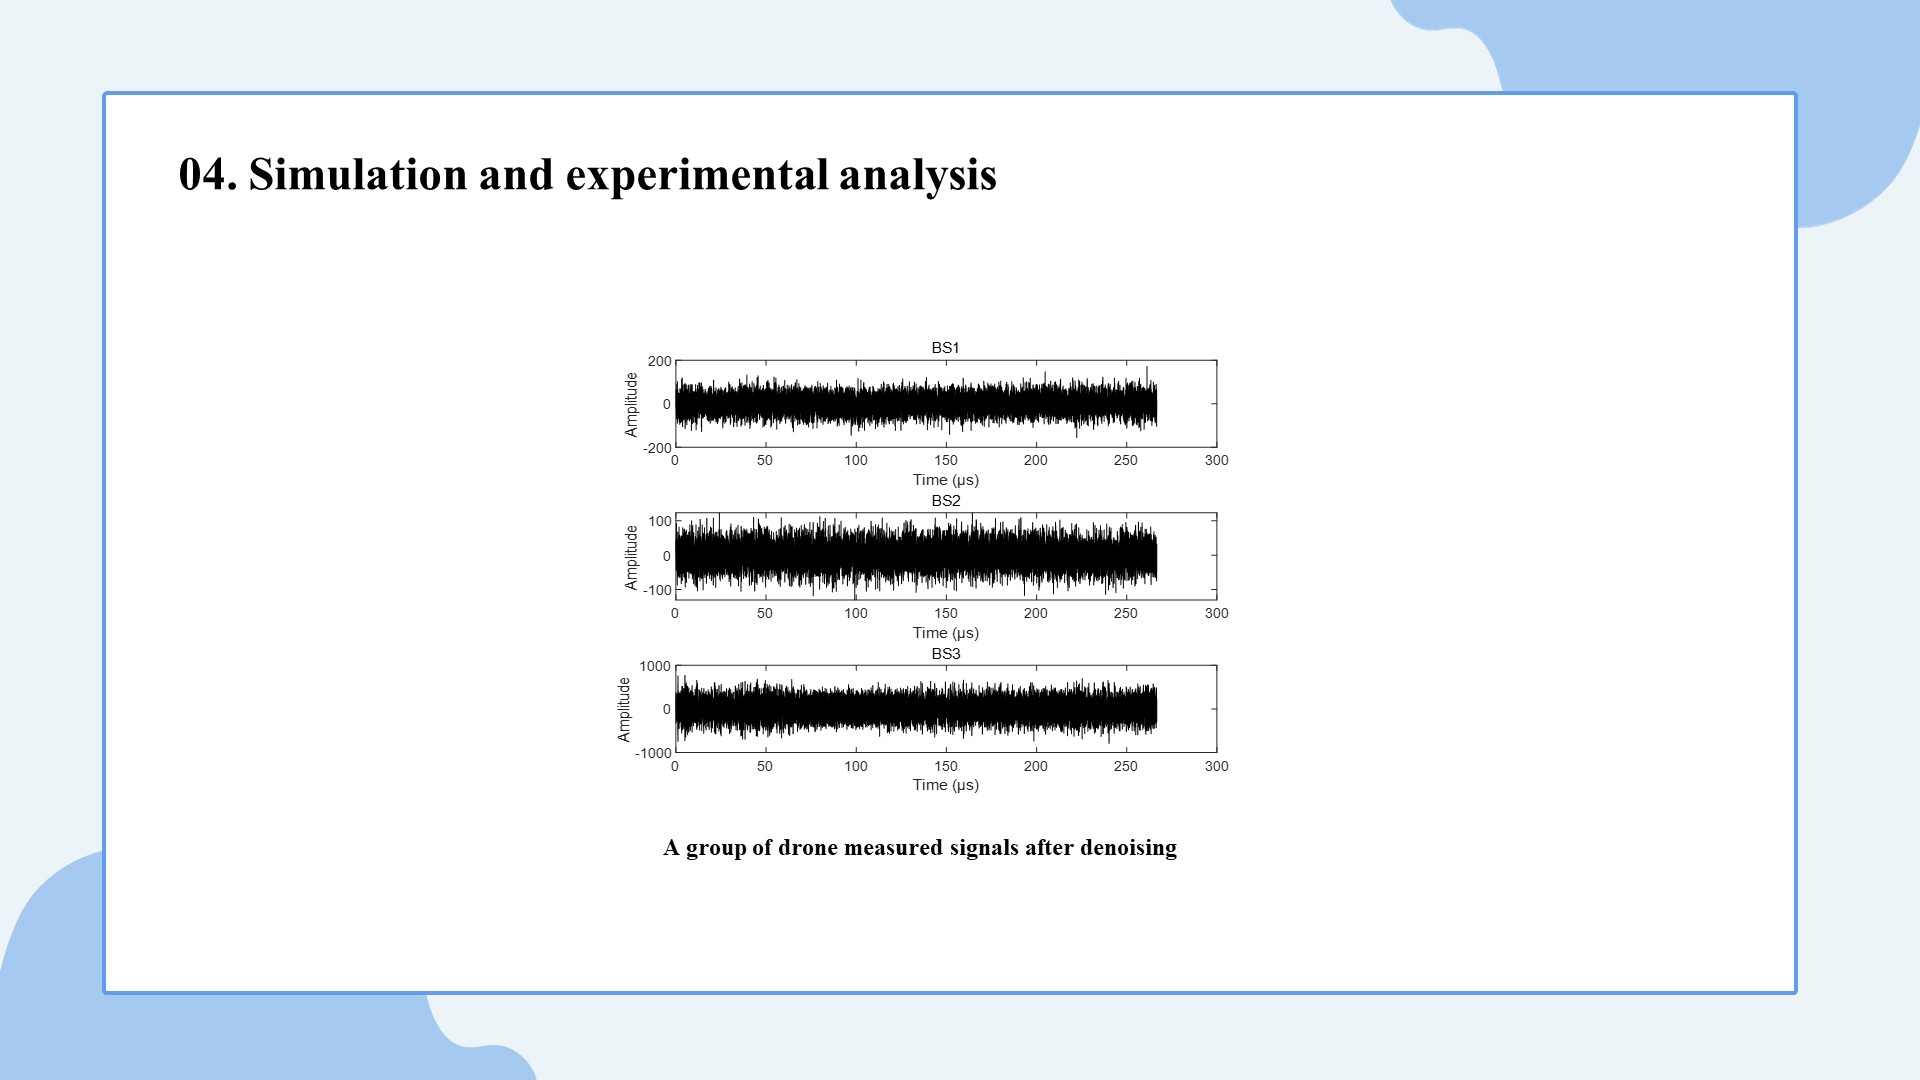 |
This Figure demonstrates the time domain waveform diagram (I signal) of one group of signals processed by the algorithm.
|
|
ICACT20250181 Slide.14
[Big slide for presentation]
|
Chrome Text-to-Speach Click!! |
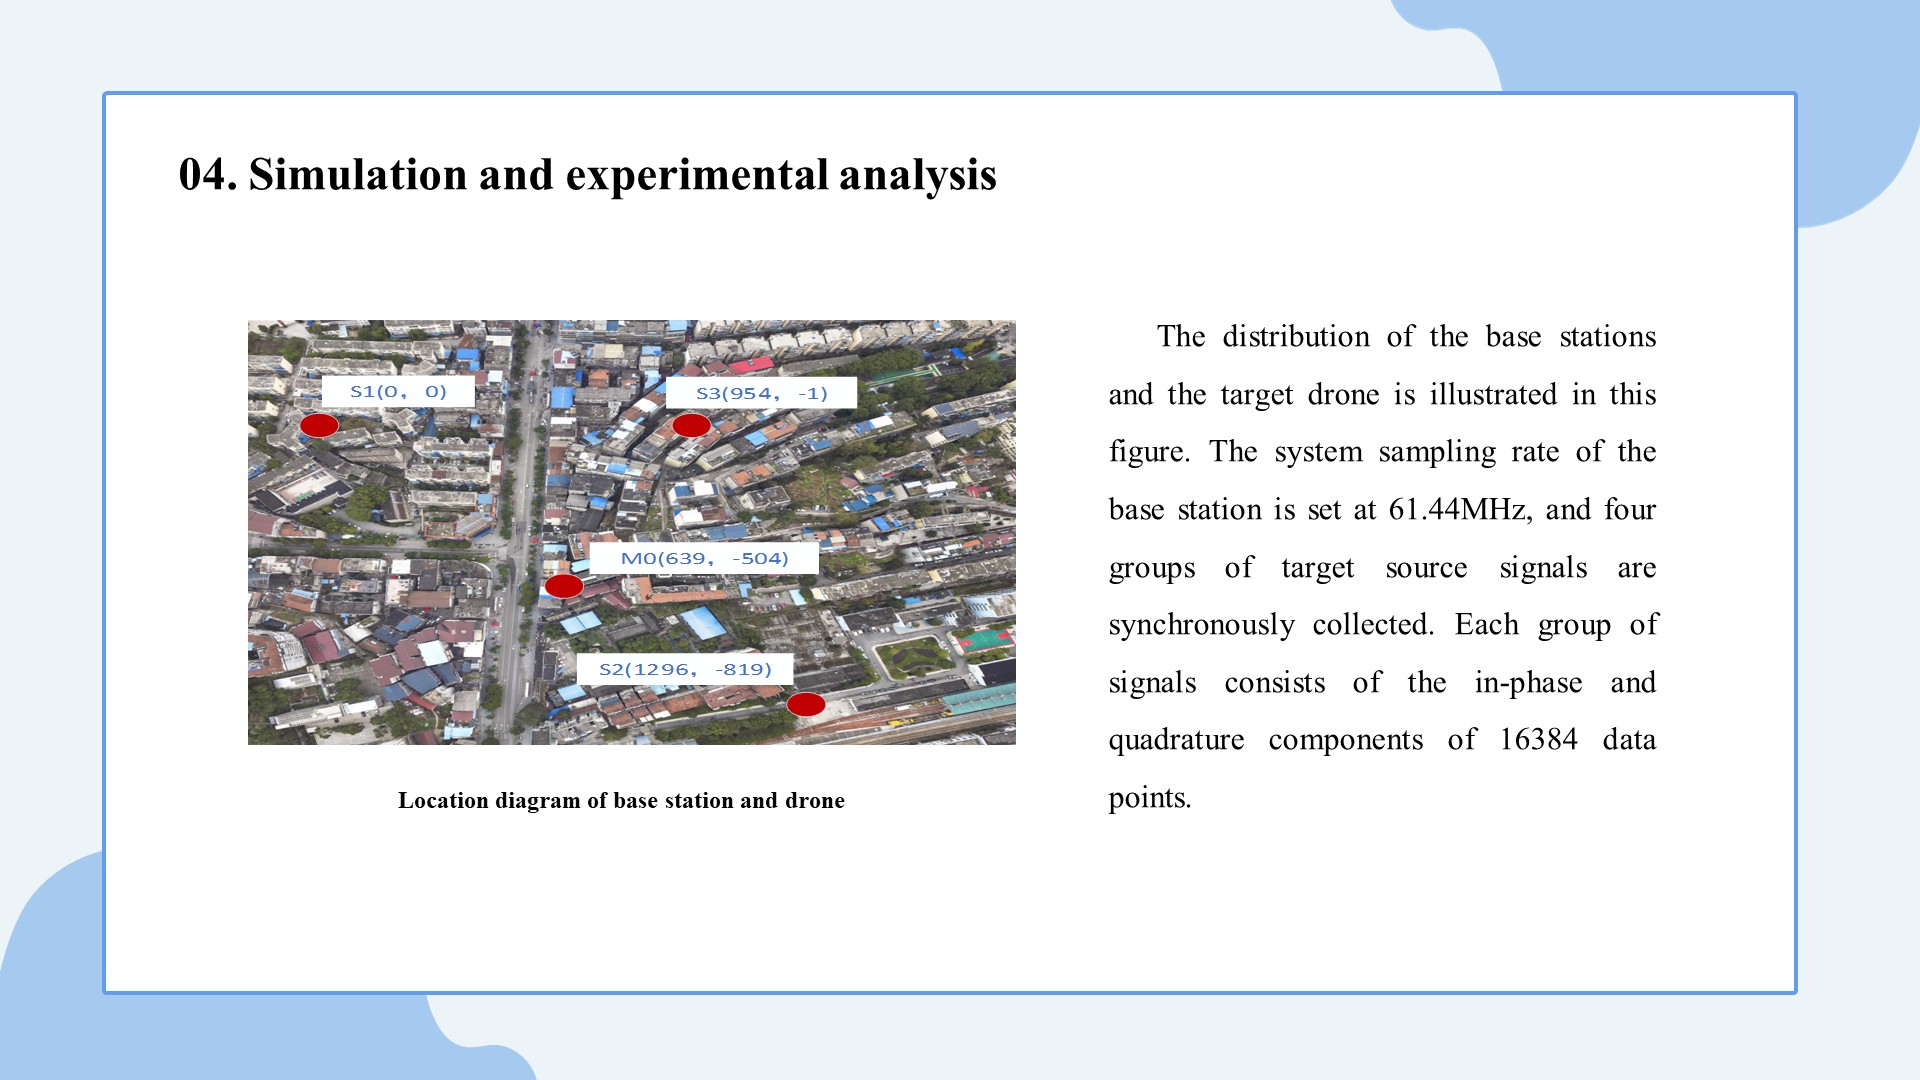 |
We validated our method using real drone signals collected from multiple base stations.
The distribution of the base stations and the target drone is illustrated in this figure.
|
|
ICACT20250181 Slide.13
[Big slide for presentation]
|
Chrome Text-to-Speach Click!! |
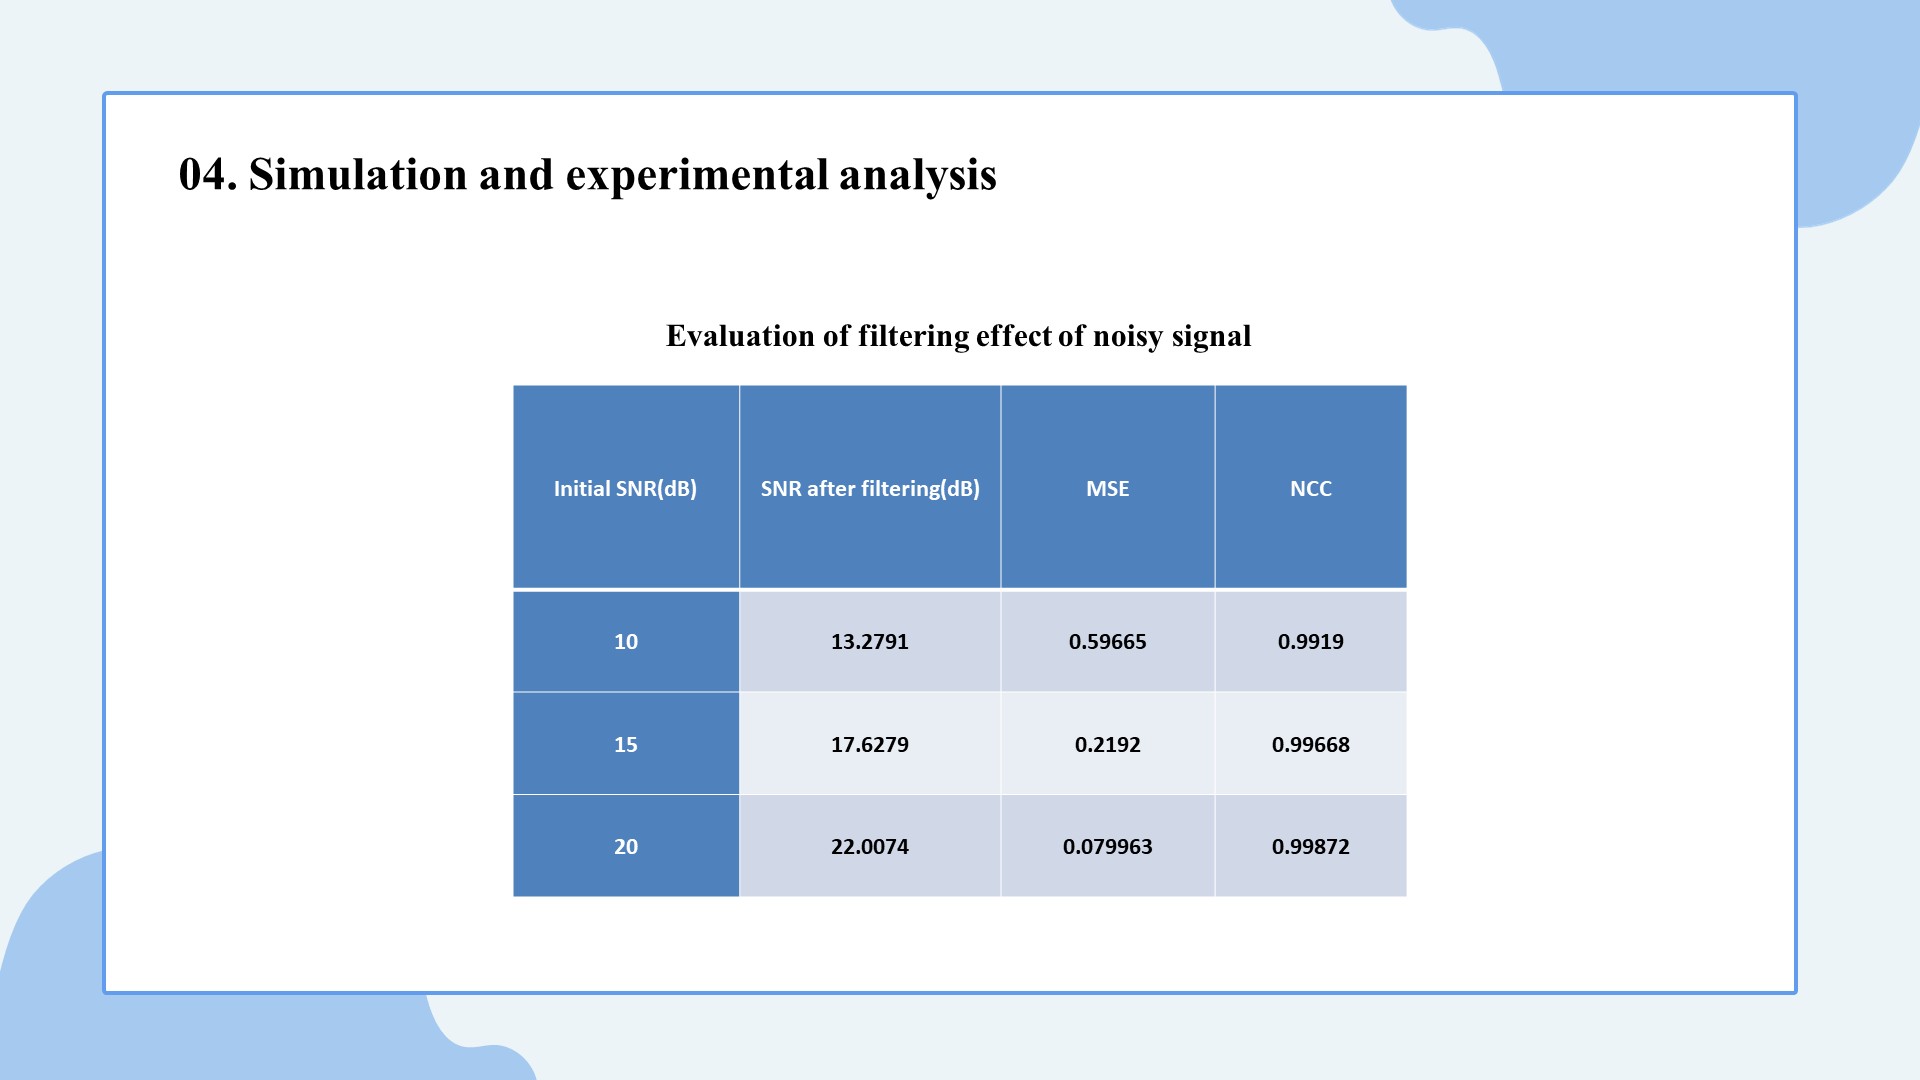 |
The results demonstrate the effectiveness of our method in significantly enhancing Signal-to-Noise Ratio , reducing Mean Squared Error , and achieving high Normalized Cross-Correlation values.
|
|
ICACT20250181 Slide.12
[Big slide for presentation]
|
Chrome Text-to-Speach Click!! |
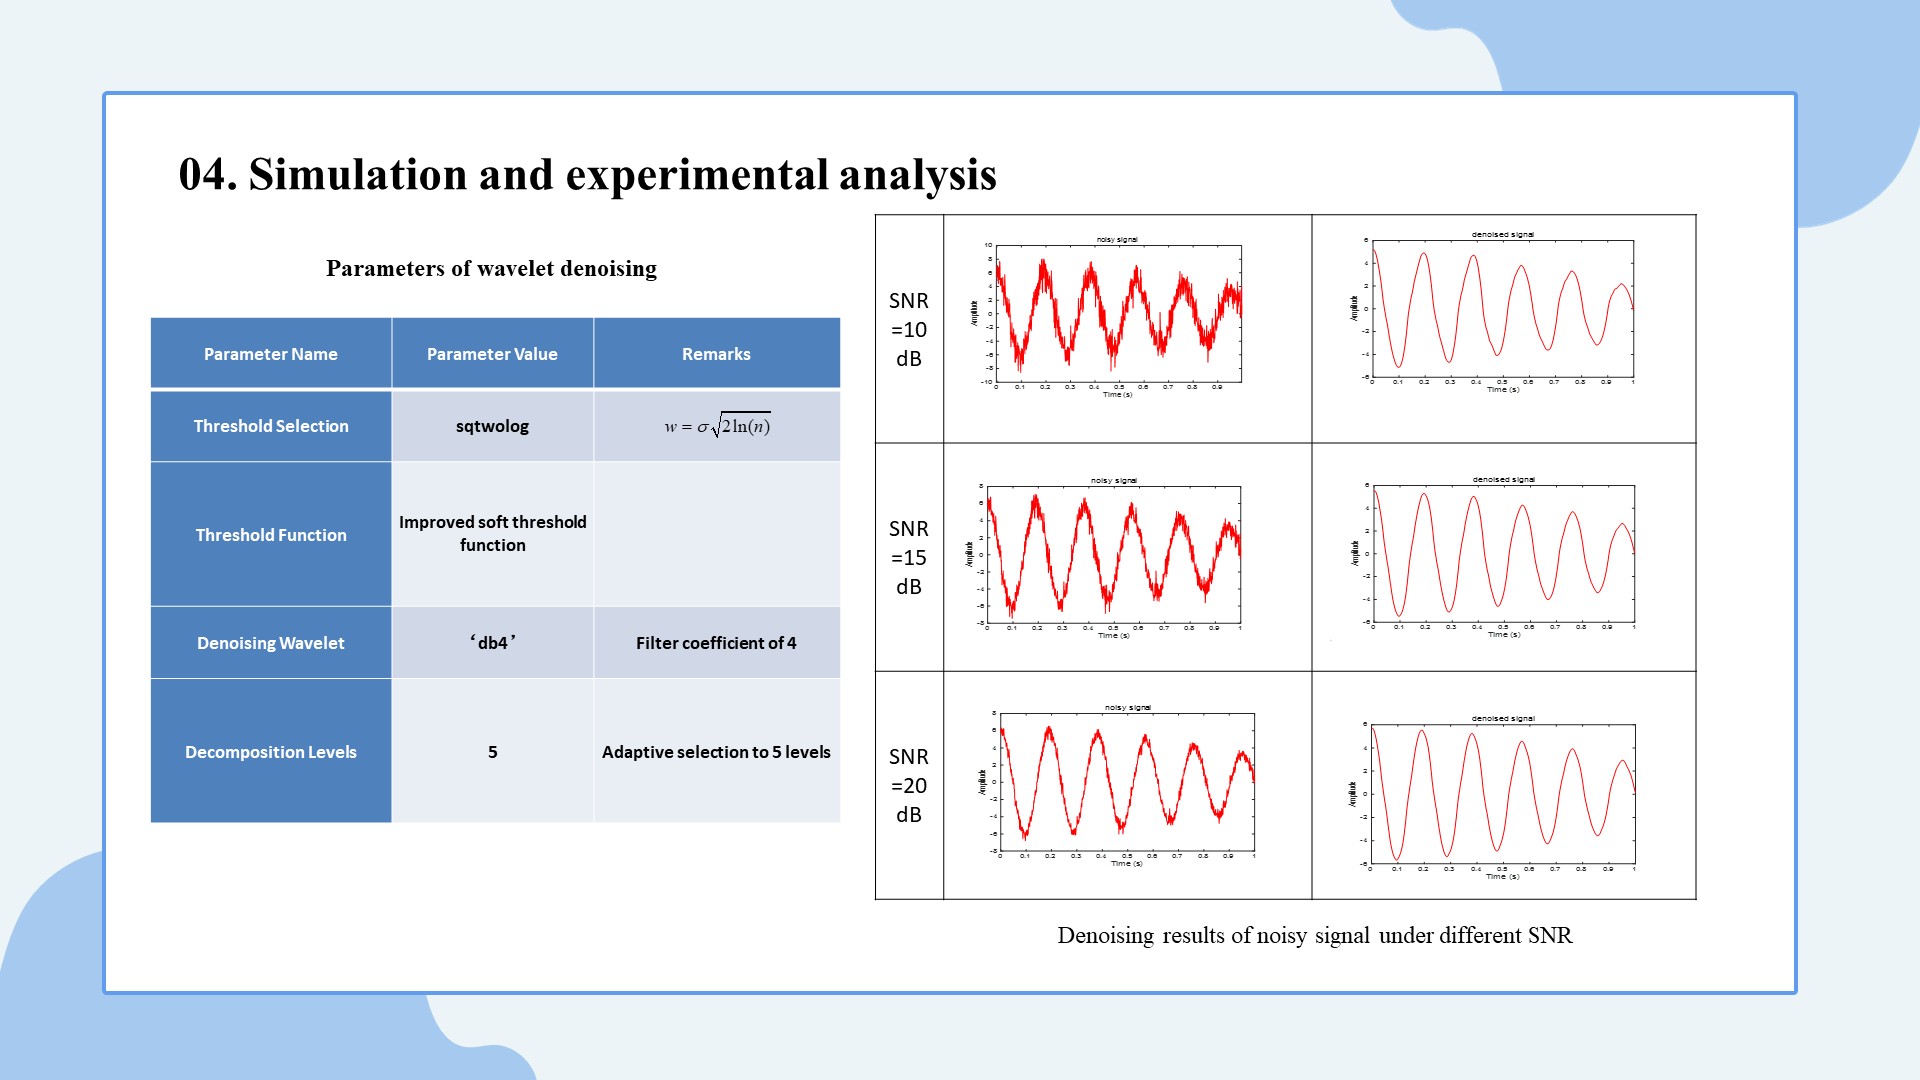 |
Key parameters included signal frequency, decomposition levels, and threshold selection criteria.
|
|
ICACT20250181 Slide.11
[Big slide for presentation]
|
Chrome Text-to-Speach Click!! |
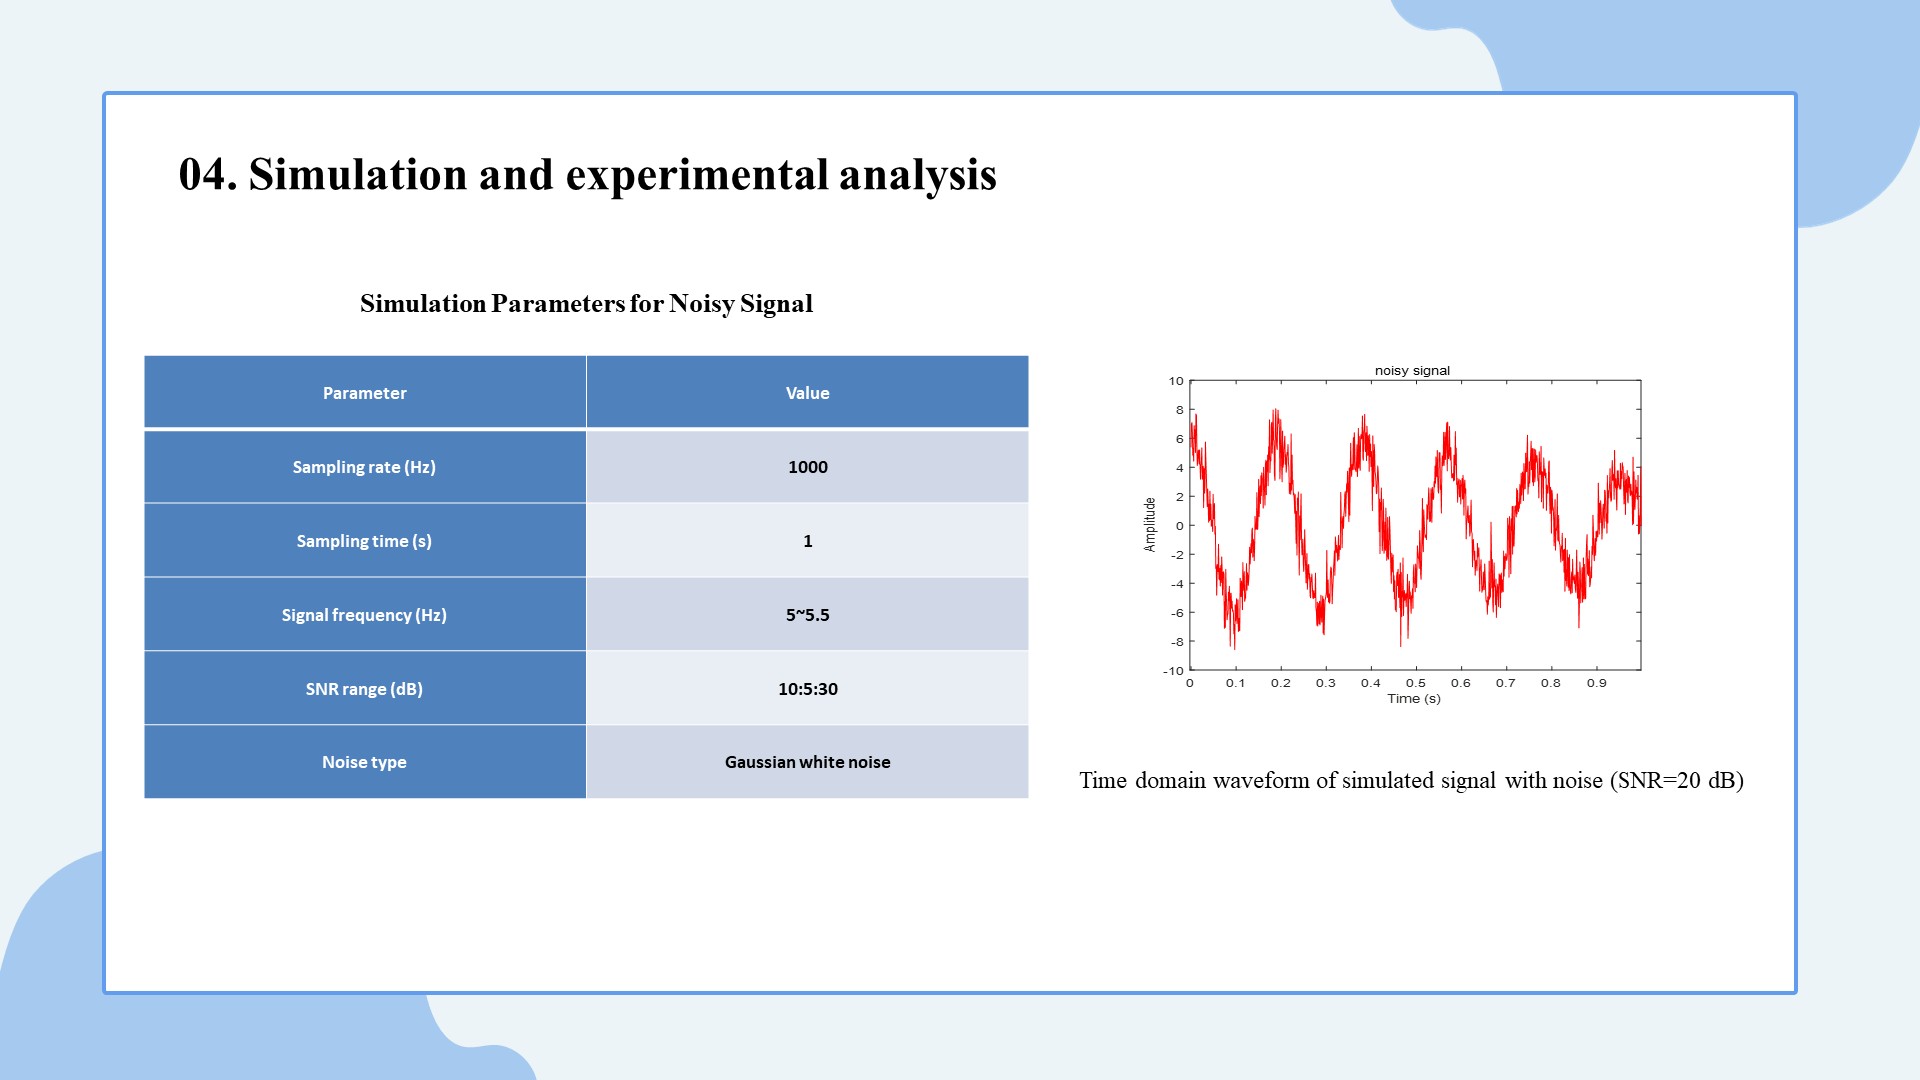 |
We tested our algorithm using simulated noisy signals with signal-to-noise ratios ranging from 10 to 20 dB.
|
|
ICACT20250181 Slide.10
[Big slide for presentation]
|
Chrome Text-to-Speach Click!! |
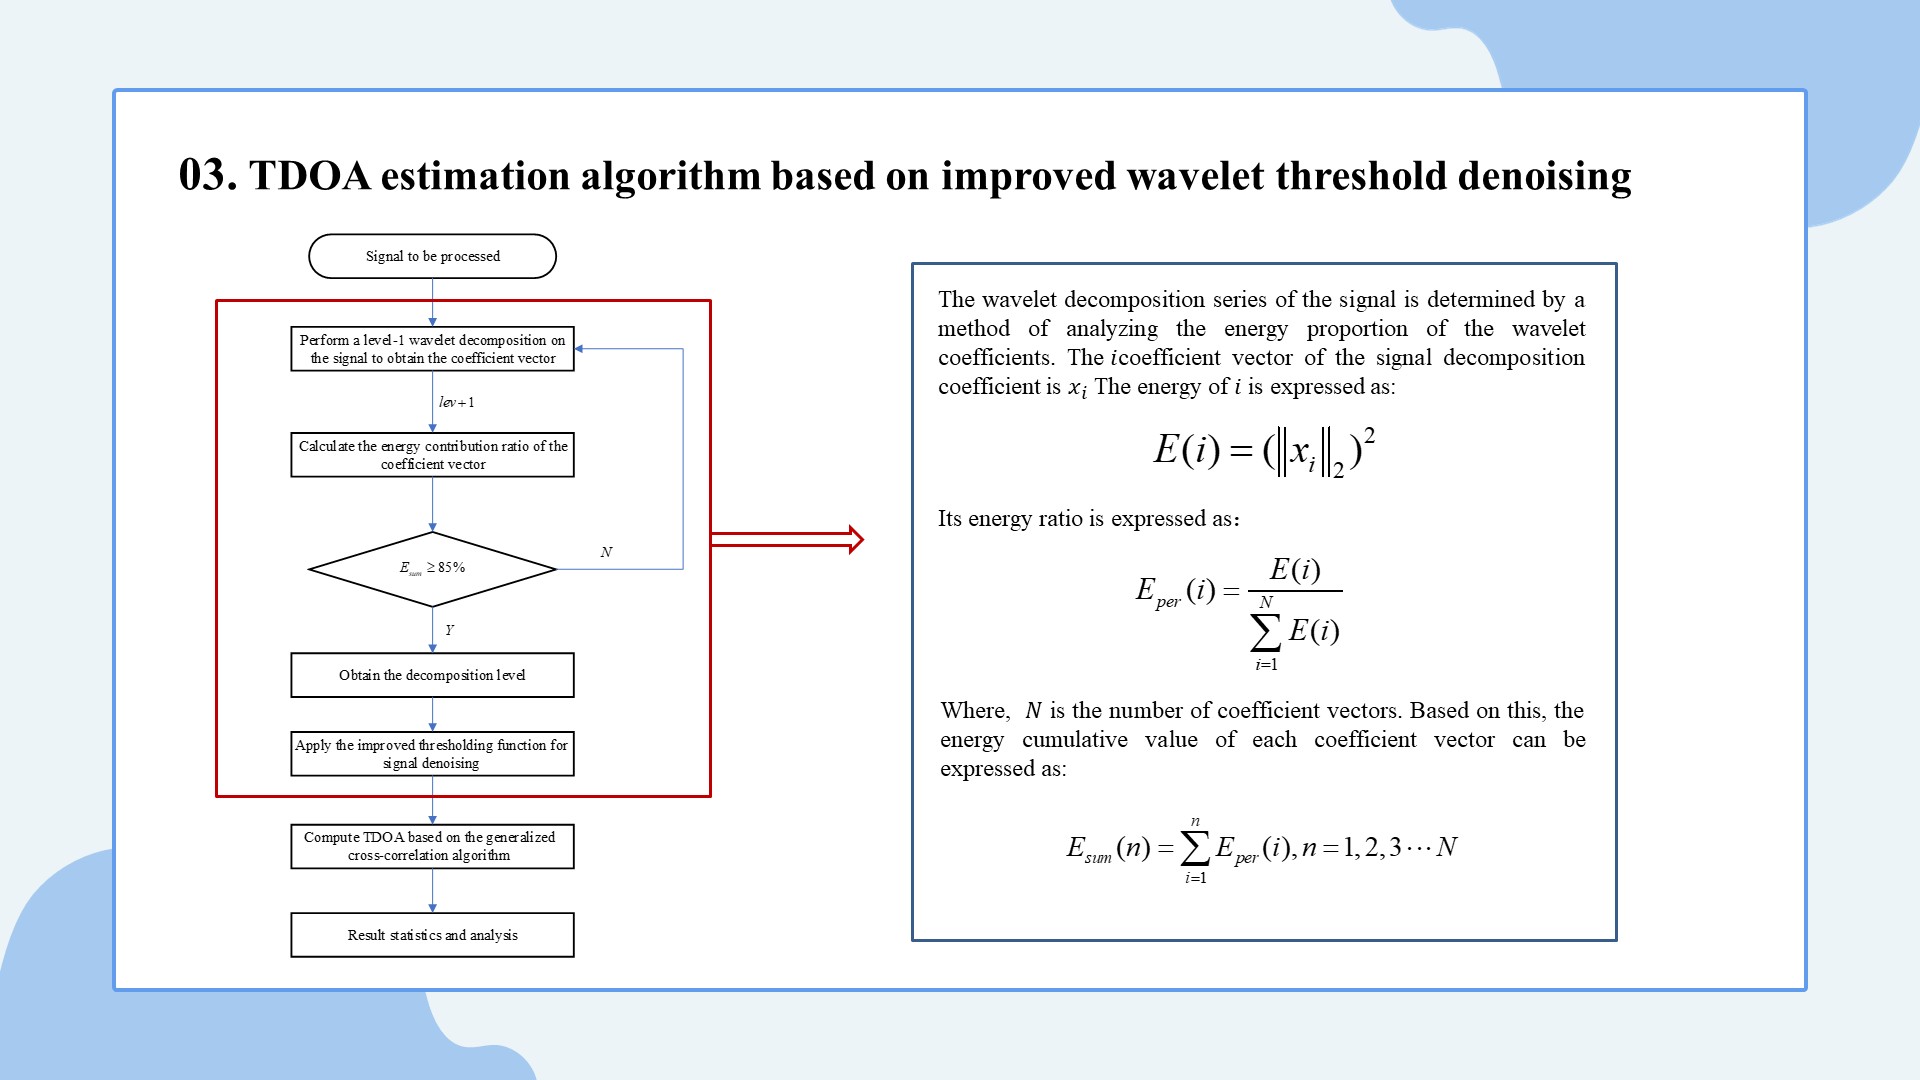 |
Based on the above improved wavelet threshold denoising algorithm, for simulated or measured drone signal data, the improved wavelet threshold denoising algorithm is processed, and then the generalized cross-correlation delay estimation algorithm is adopted for delay estimation. The algorithm processing flow is shown in the figure below:
Here, we adopt a method to determine the wavelet decomposition series algorithm of the signal by analyzing the energy proportion of the wavelet coefficients. The energy cumulative value of each coefficient vector is expressed as E sum (n), where N is the number of coefficient vectors., the smallest n value when E sum is greater than or equal to 85% is selected as the decomposition series of the wavelet denoising
|
|
ICACT20250181 Slide.09
[Big slide for presentation]
|
Chrome Text-to-Speach Click!! |
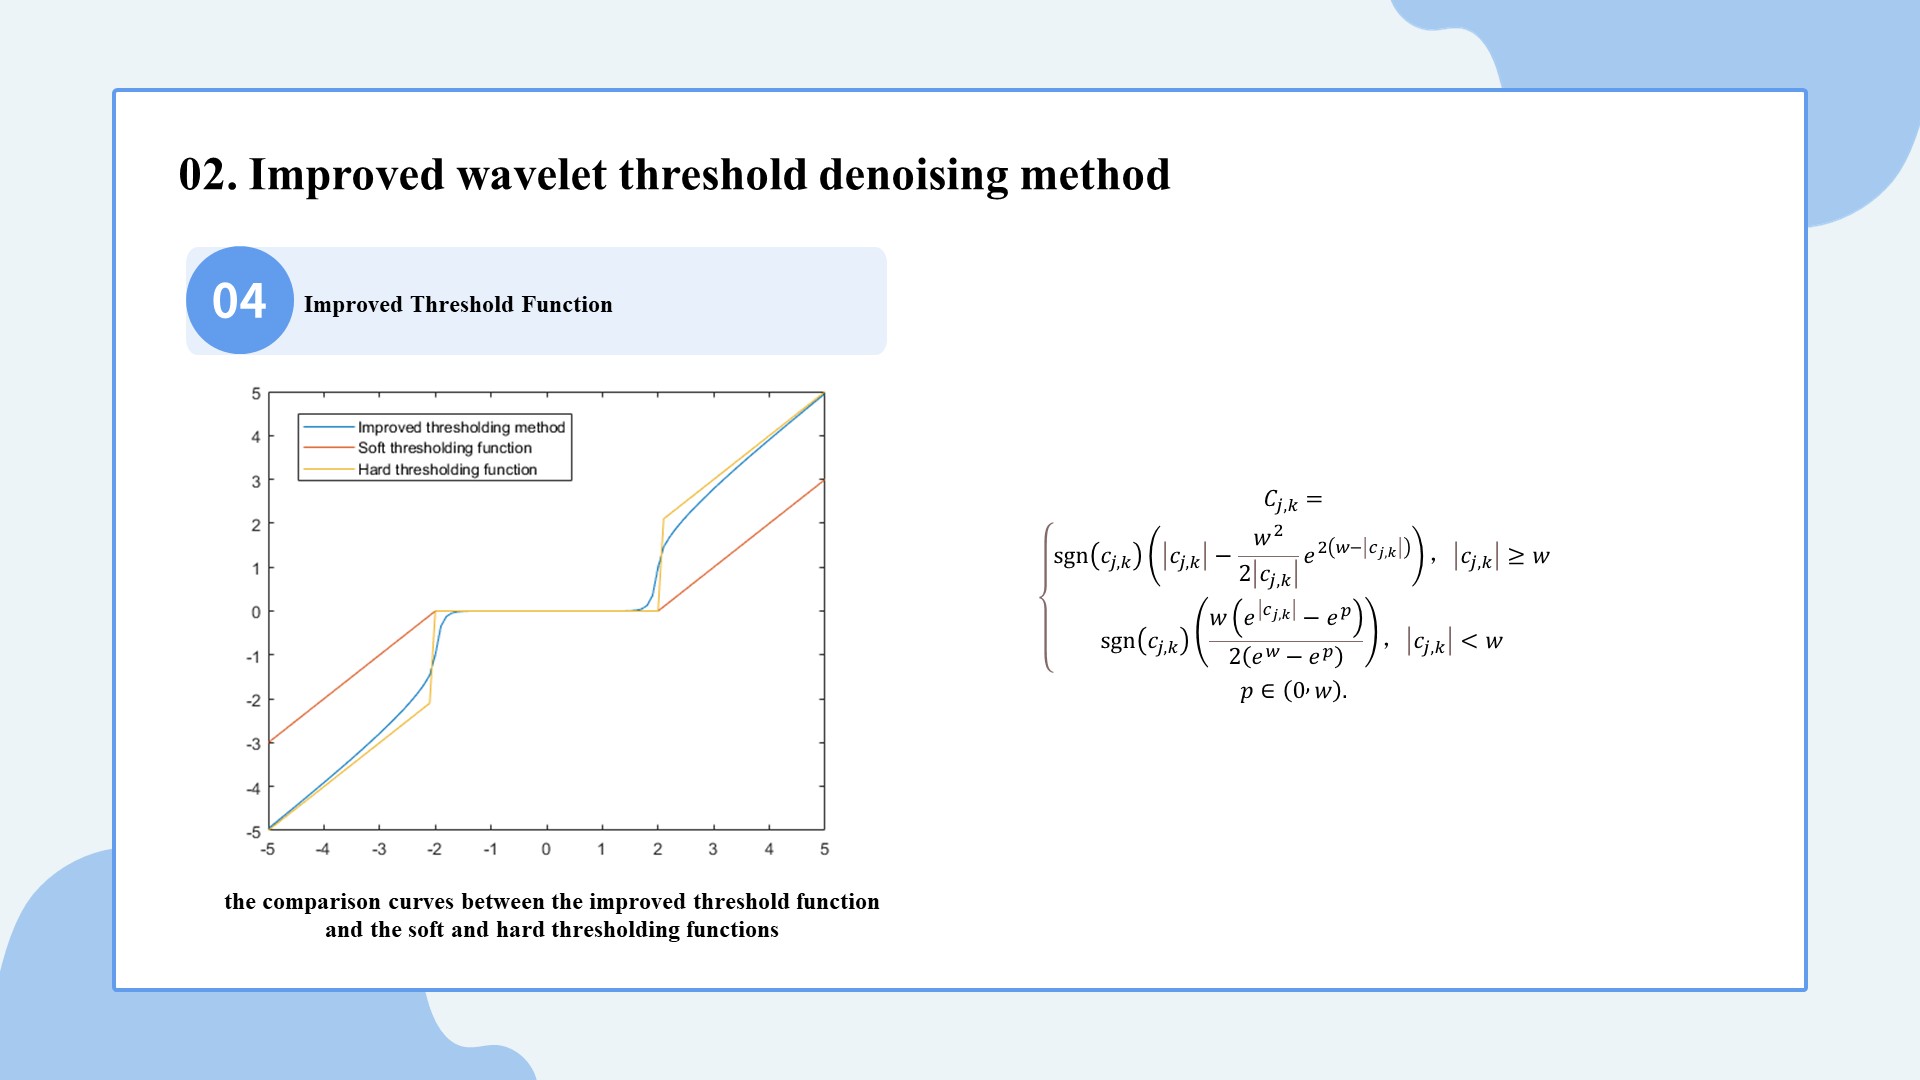 |
Therefore, for the problem of hard threshold function and soft threshold function, we use an improved threshold function, which is defined as follows:
Here is the comparison curves between the improved threshold function and the soft and hard thresholding functions,It can be observed that at point wavelet coefficient equals w, the improved threshold function overcomes the discontinuity at point in the hard thresholding function, and avoids oscillations during signal reconstruction. In segment The wavelet coefficient is greater than or equal to w, the improved threshold function more closely aligns with the hard thresholding function and does not exhibit the constant error observed in the soft thresholding function in this region.
|
|
ICACT20250181 Slide.08
[Big slide for presentation]
|
Chrome Text-to-Speach Click!! |
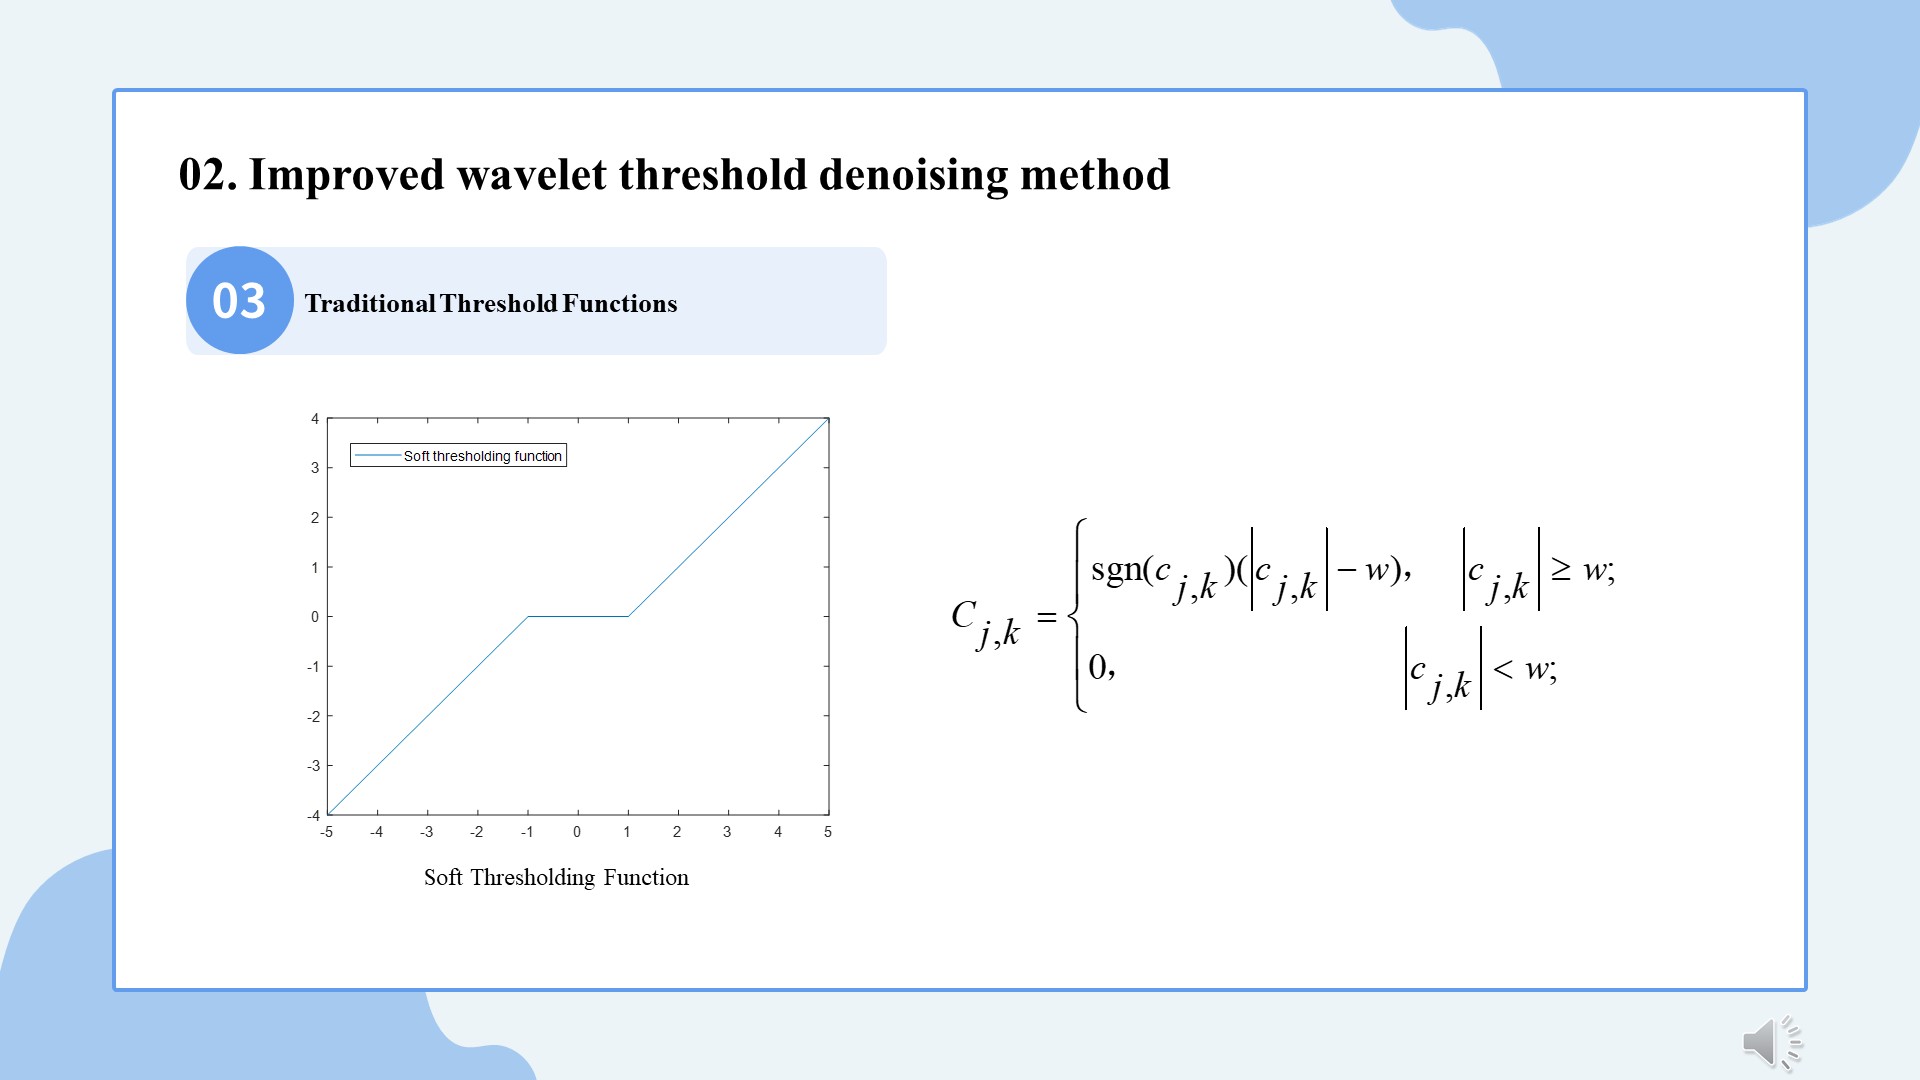 |
The soft thresholding algorithm is continuous at the threshold , providing better smoothing of the wavelet coefficients in the reconstructed signal, which leads to improved denoising performance. However, For coefficients greater than the threshold, the same operation is applied to all, introducing errors in the wavelet coefficients. Consequently, the reconstructed signal also contains errors, causing the loss of abrupt changes in the original signal. This results in a lower signal-to-noise ratio (SNR) and a higher mean square error (MSE) in the reconstructed signal.
|
|
ICACT20250181 Slide.07
[Big slide for presentation]
|
Chrome Text-to-Speach Click!! |
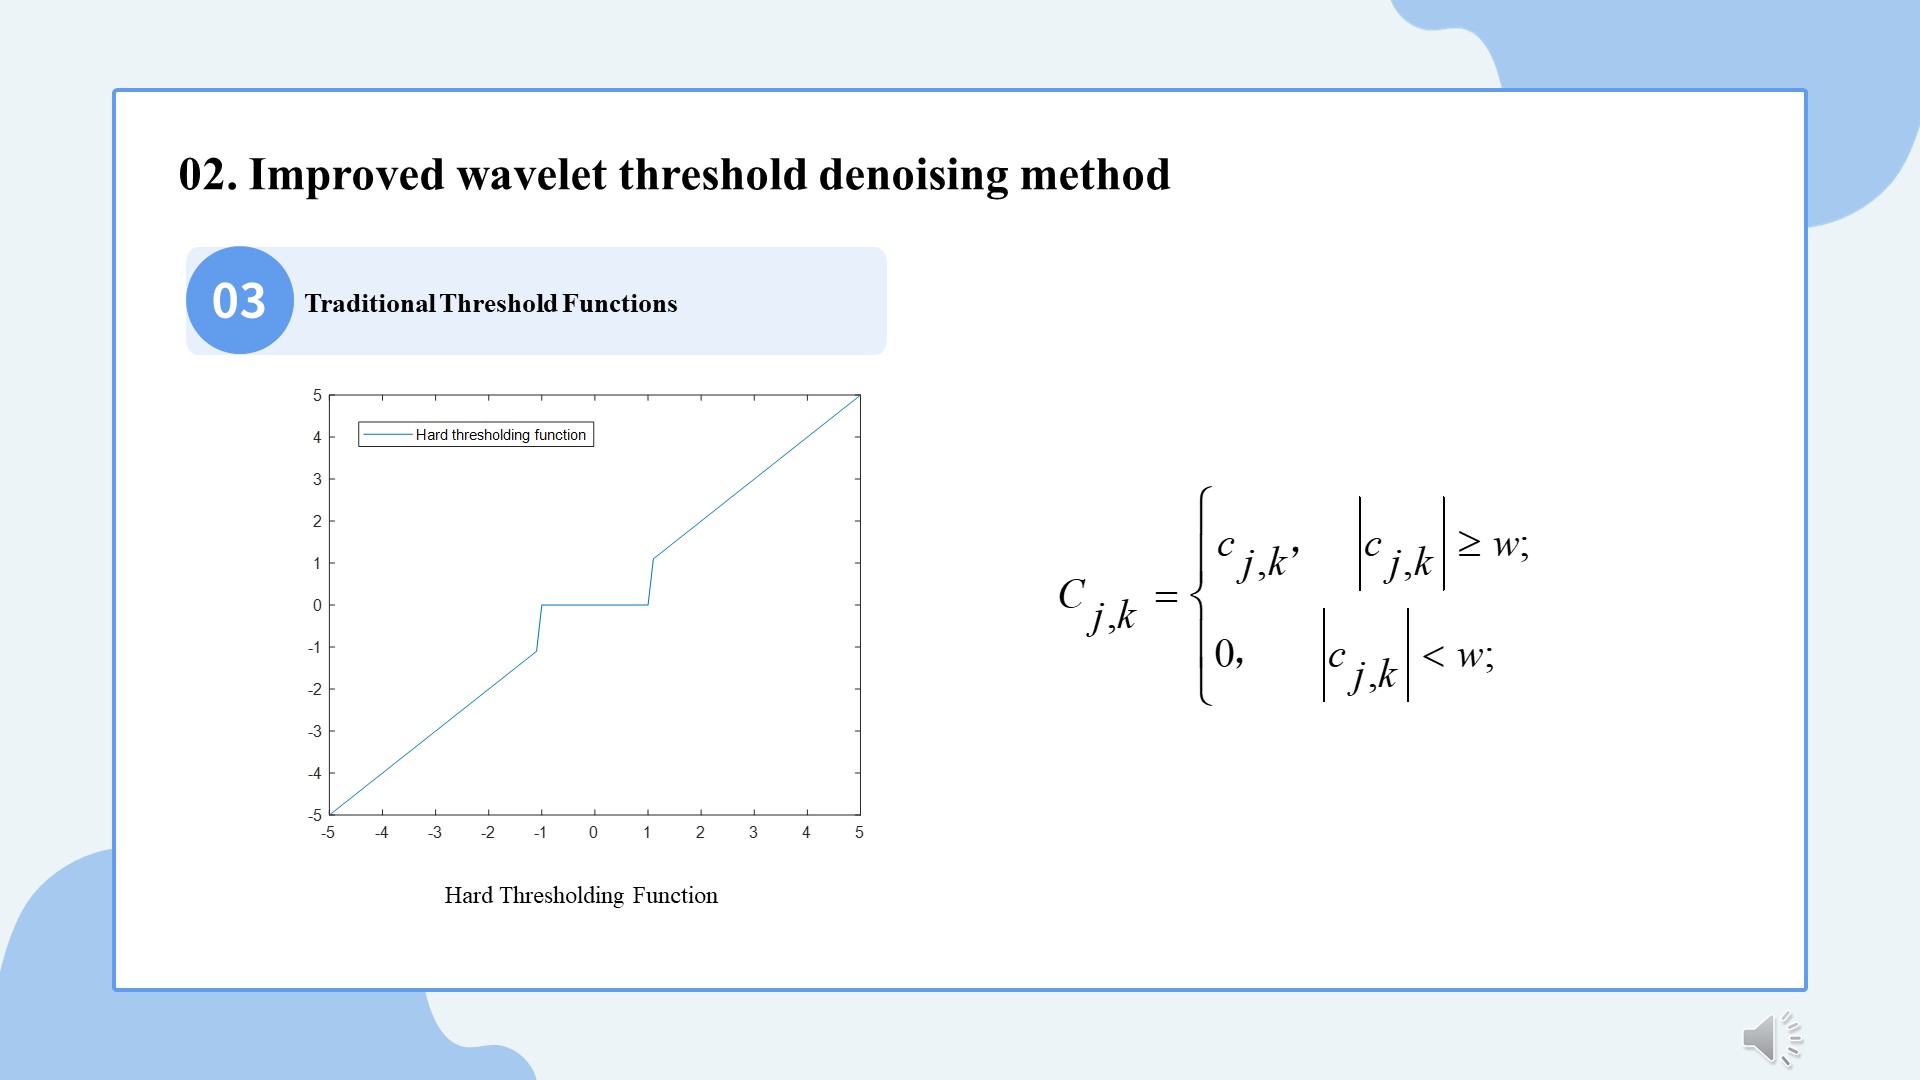 |
There are two traditional wavelet threshold functions: the hard thresholding function and the soft thresholding function.
The hard thresholding algorithm sets wavelet coefficients with absolute values below the threshold to zero, while preserving all coefficients above the threshold unchanged. This method is effective in preserving local features of the signal, such as edges and spikes. However, the hard thresholding function is discontinuous at the threshold , which introduces significant variance and causes oscillations during signal reconstruction.
|
|
ICACT20250181 Slide.06
[Big slide for presentation]
|
Chrome Text-to-Speach Click!! |
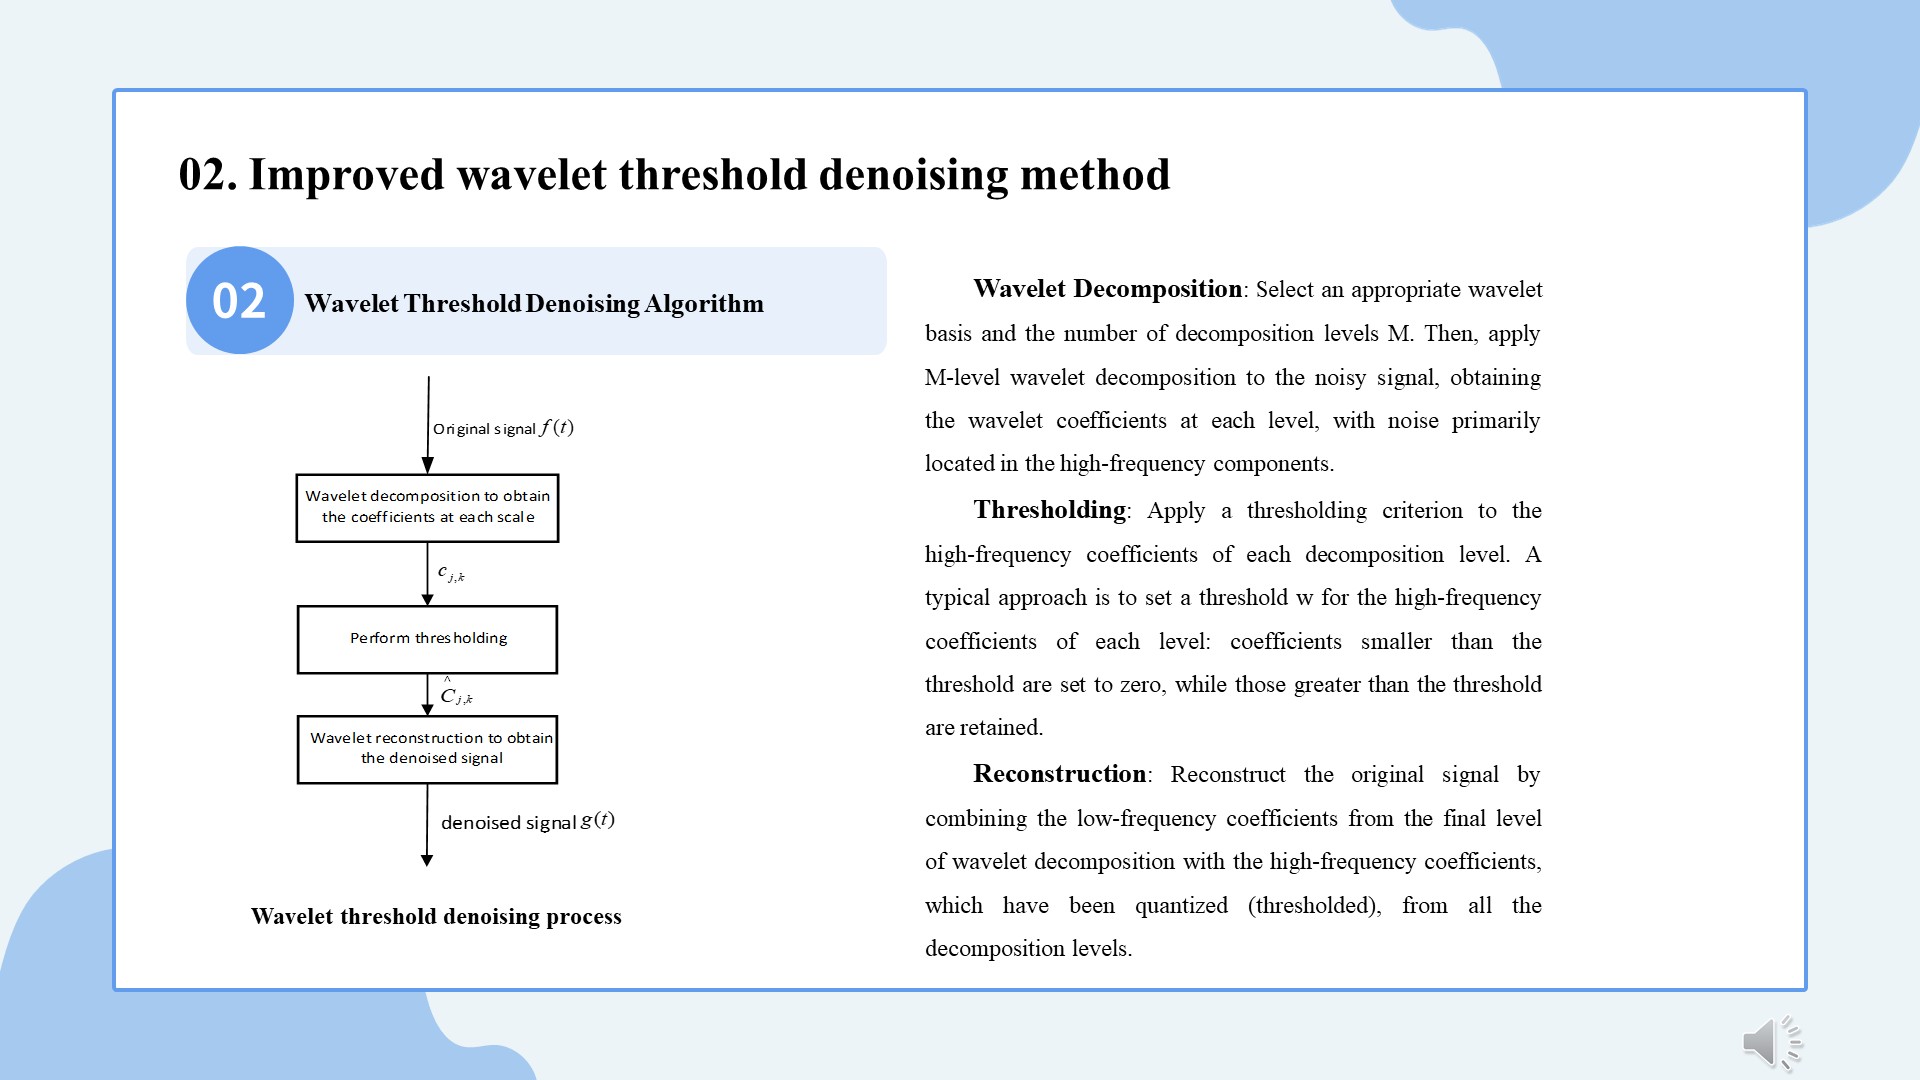 |
Wavelet threshold denoising algorithm mainly includes the following three steps:
Wavelet Decomposition: Select an appropriate wavelet basis and the number of decomposition levels M. Then, apply M-level wavelet decomposition to the noisy signal, obtaining the wavelet coefficients at each level, with noise primarily located in the high-frequency components.
Thresholding: Apply a thresholding standard to the high-frequency coefficients of each decomposition level. A typical approach is to set a threshold w for the high-frequency coefficients of each level: coefficients smaller than the threshold are set to zero, while those greater than the threshold are retained.
Reconstruction: Reconstruct the original signal by combining the low-frequency coefficients from the final level of wavelet decomposition with the high-frequency coefficients, which have been quantized (thresholded), from all the decomposition levels.
|
|
ICACT20250181 Slide.05
[Big slide for presentation]
|
Chrome Text-to-Speach Click!! |
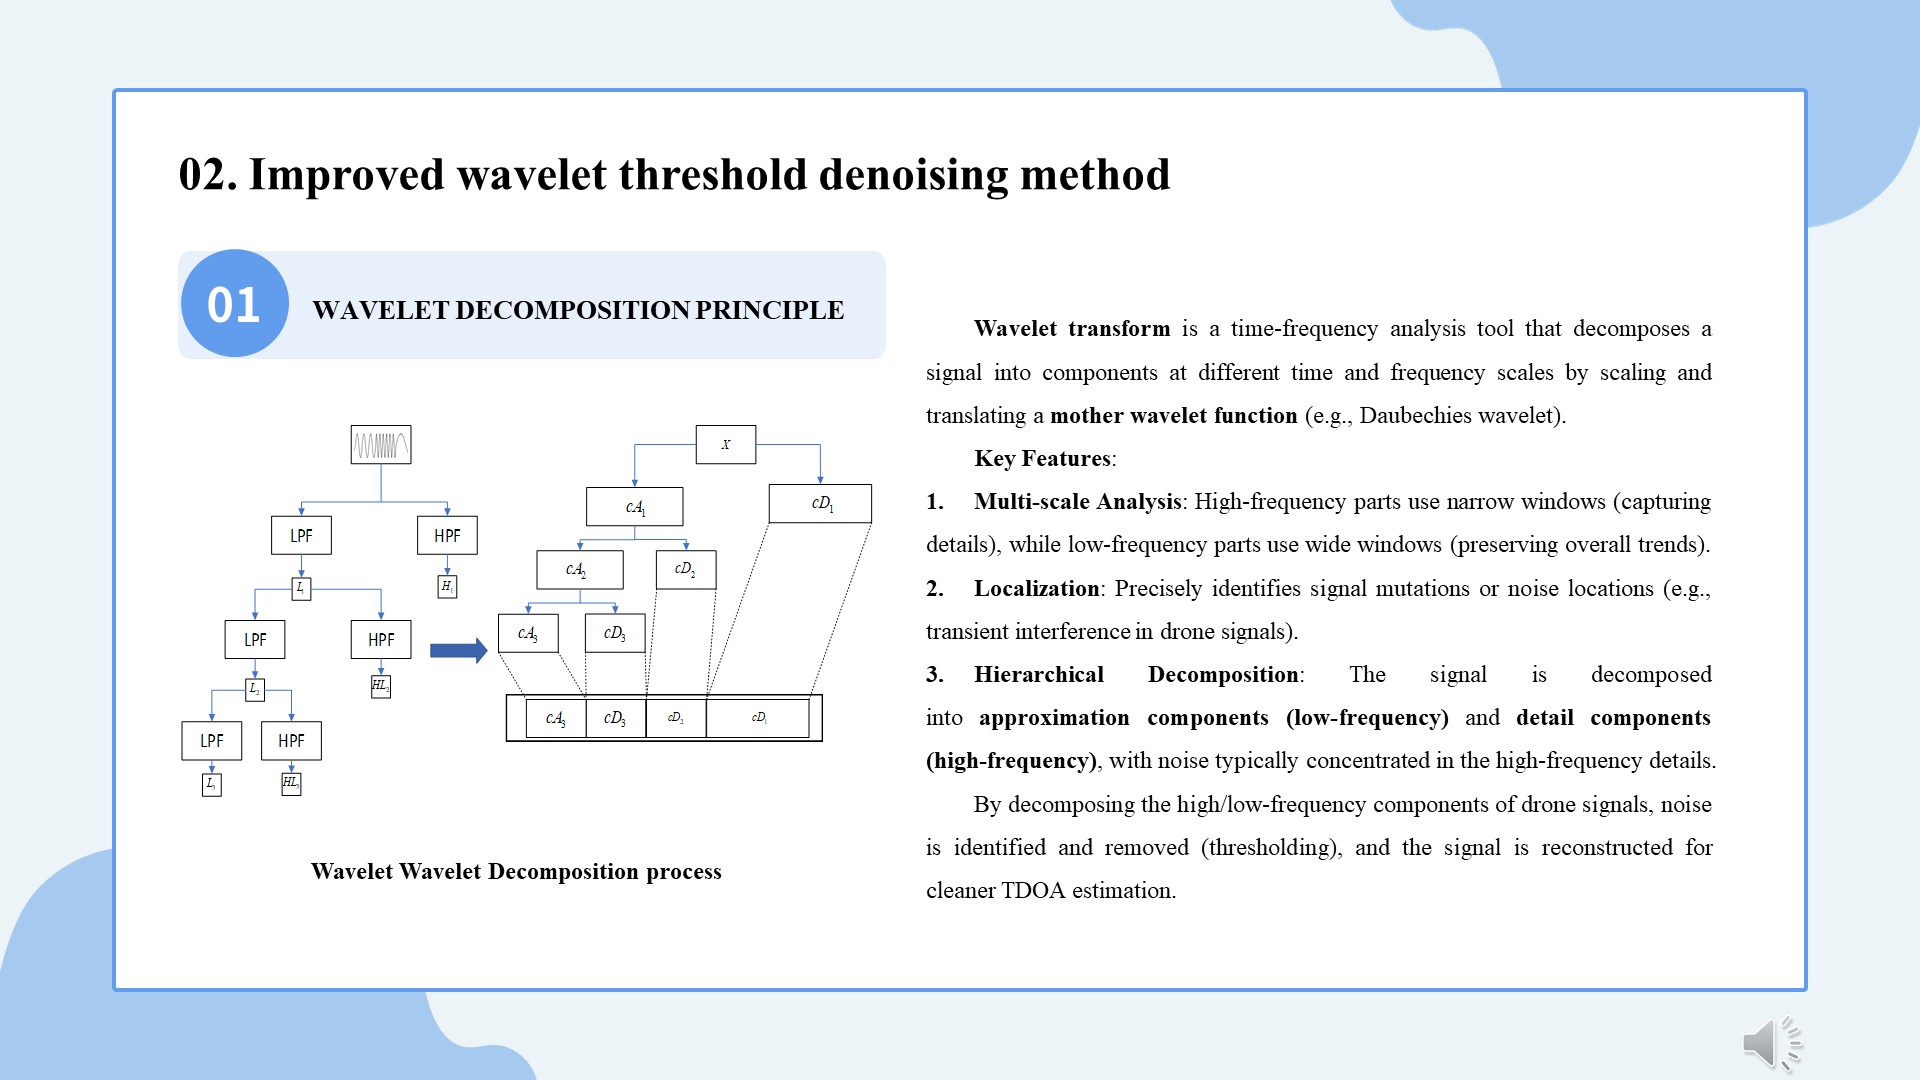 |
Wavelet transform is a time-frequency analysis tool that decomposes a signal into components at different time and frequency scales by scaling and translating a mother wavelet function (e.g., Daubechies wavelet).
Key Features:
1. Multi-scale Analysis: High-frequency parts use narrow windows (capturing details), while low-frequency parts use wide windows (preserving overall trends).
2. Localization: Precisely identifies signal mutations or noise locations (e.g., transient interference in drone signals).
3. Hierarchical Decomposition: The signal is decomposed into approximation components (low-frequency) and detail components (high-frequency), with noise typically concentrated in the high-frequency details.
By decomposing the high/low-frequency components of drone signals, noise is identified and removed (thresholding), and the signal is reconstructed for cleaner TDOA estimation.
|
|
ICACT20250181 Slide.04
[Big slide for presentation]
|
Chrome Text-to-Speach Click!! |
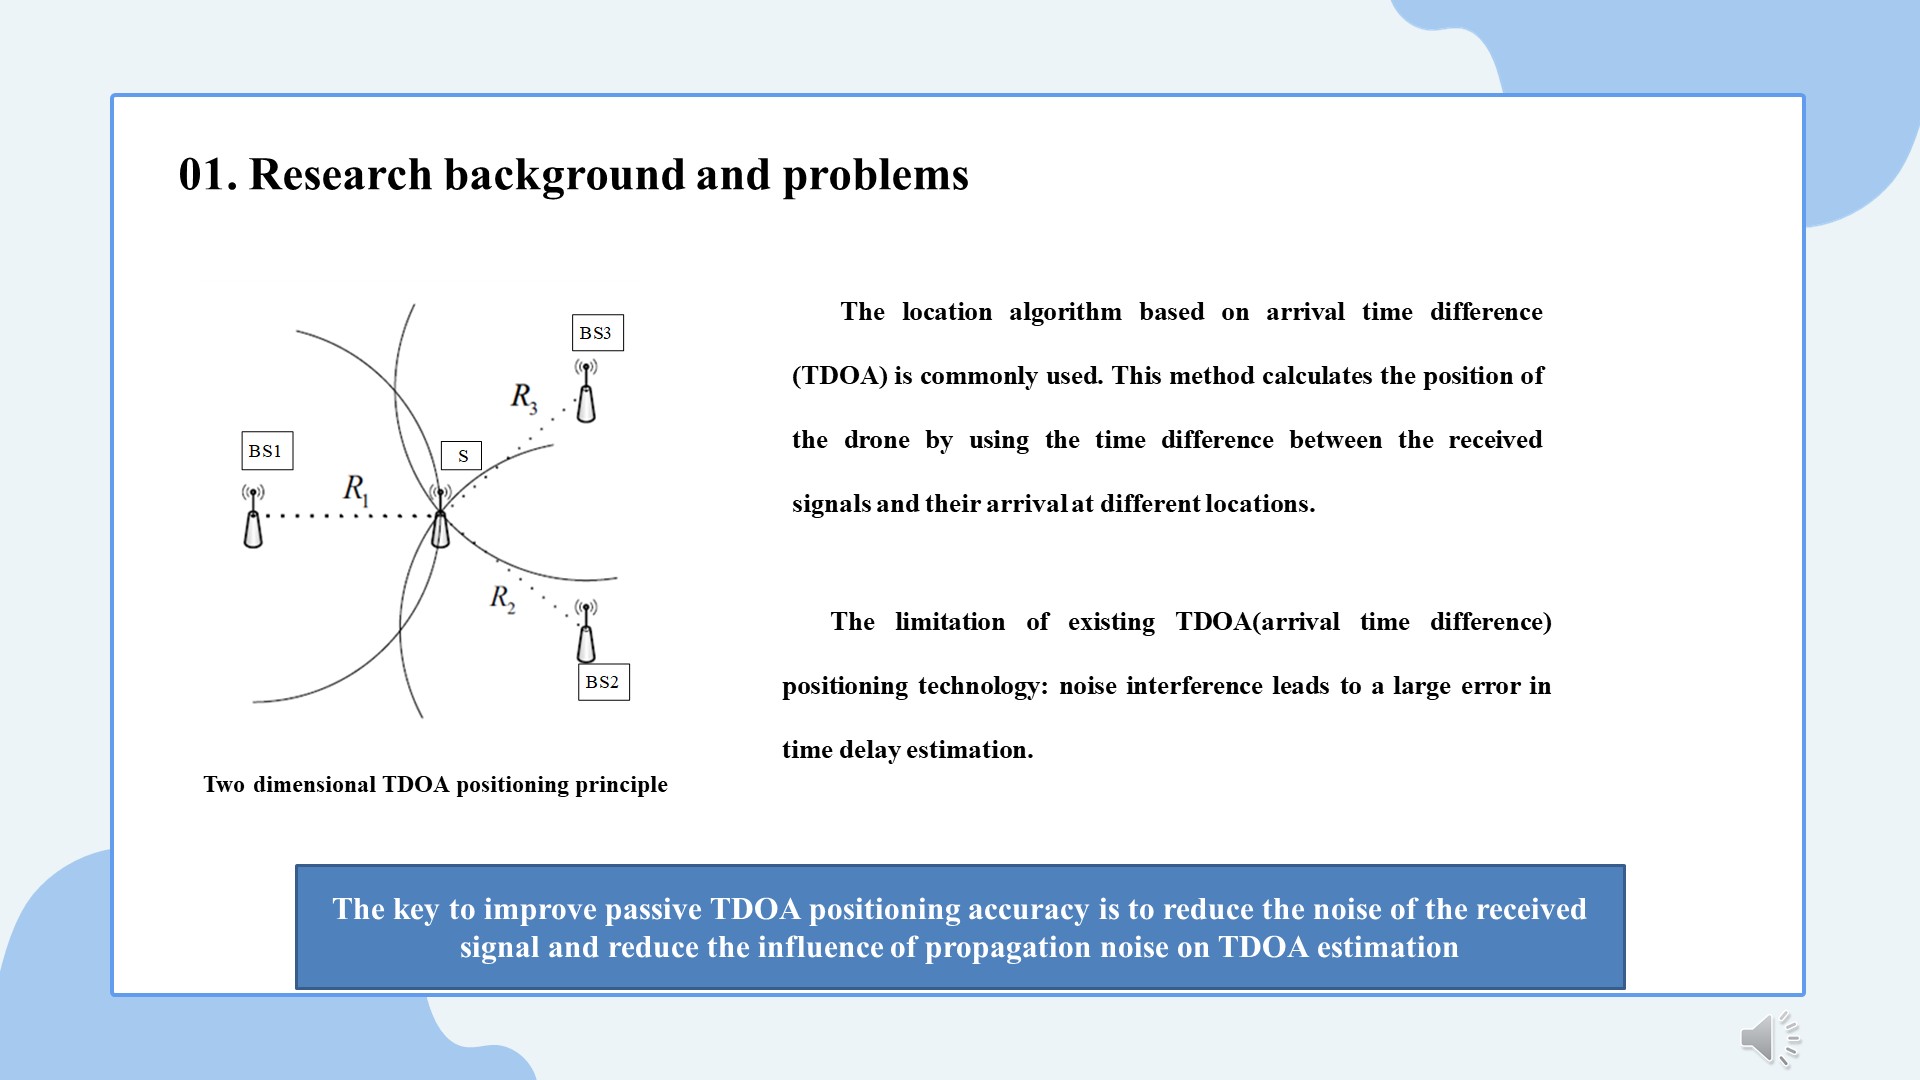 |
One common approach to address this is through TDOA-based positioning." This method calculates the position of the drone by using the time difference between the received signals and their arrival at different locations.
However, the existing TDOA estimation methods rely on signal cross-correlation, which requires high correlation of signal waveform, and noise interference will lead to a large time delay estimation error, which will affect the positioning accuracy.
The key to improve passive TDOA positioning accuracy is to reduce the noise of the received signal and reduce the influence of propagation noise on TDOA estimation
|
|
ICACT20250181 Slide.03
[Big slide for presentation]
|
Chrome Text-to-Speach Click!! |
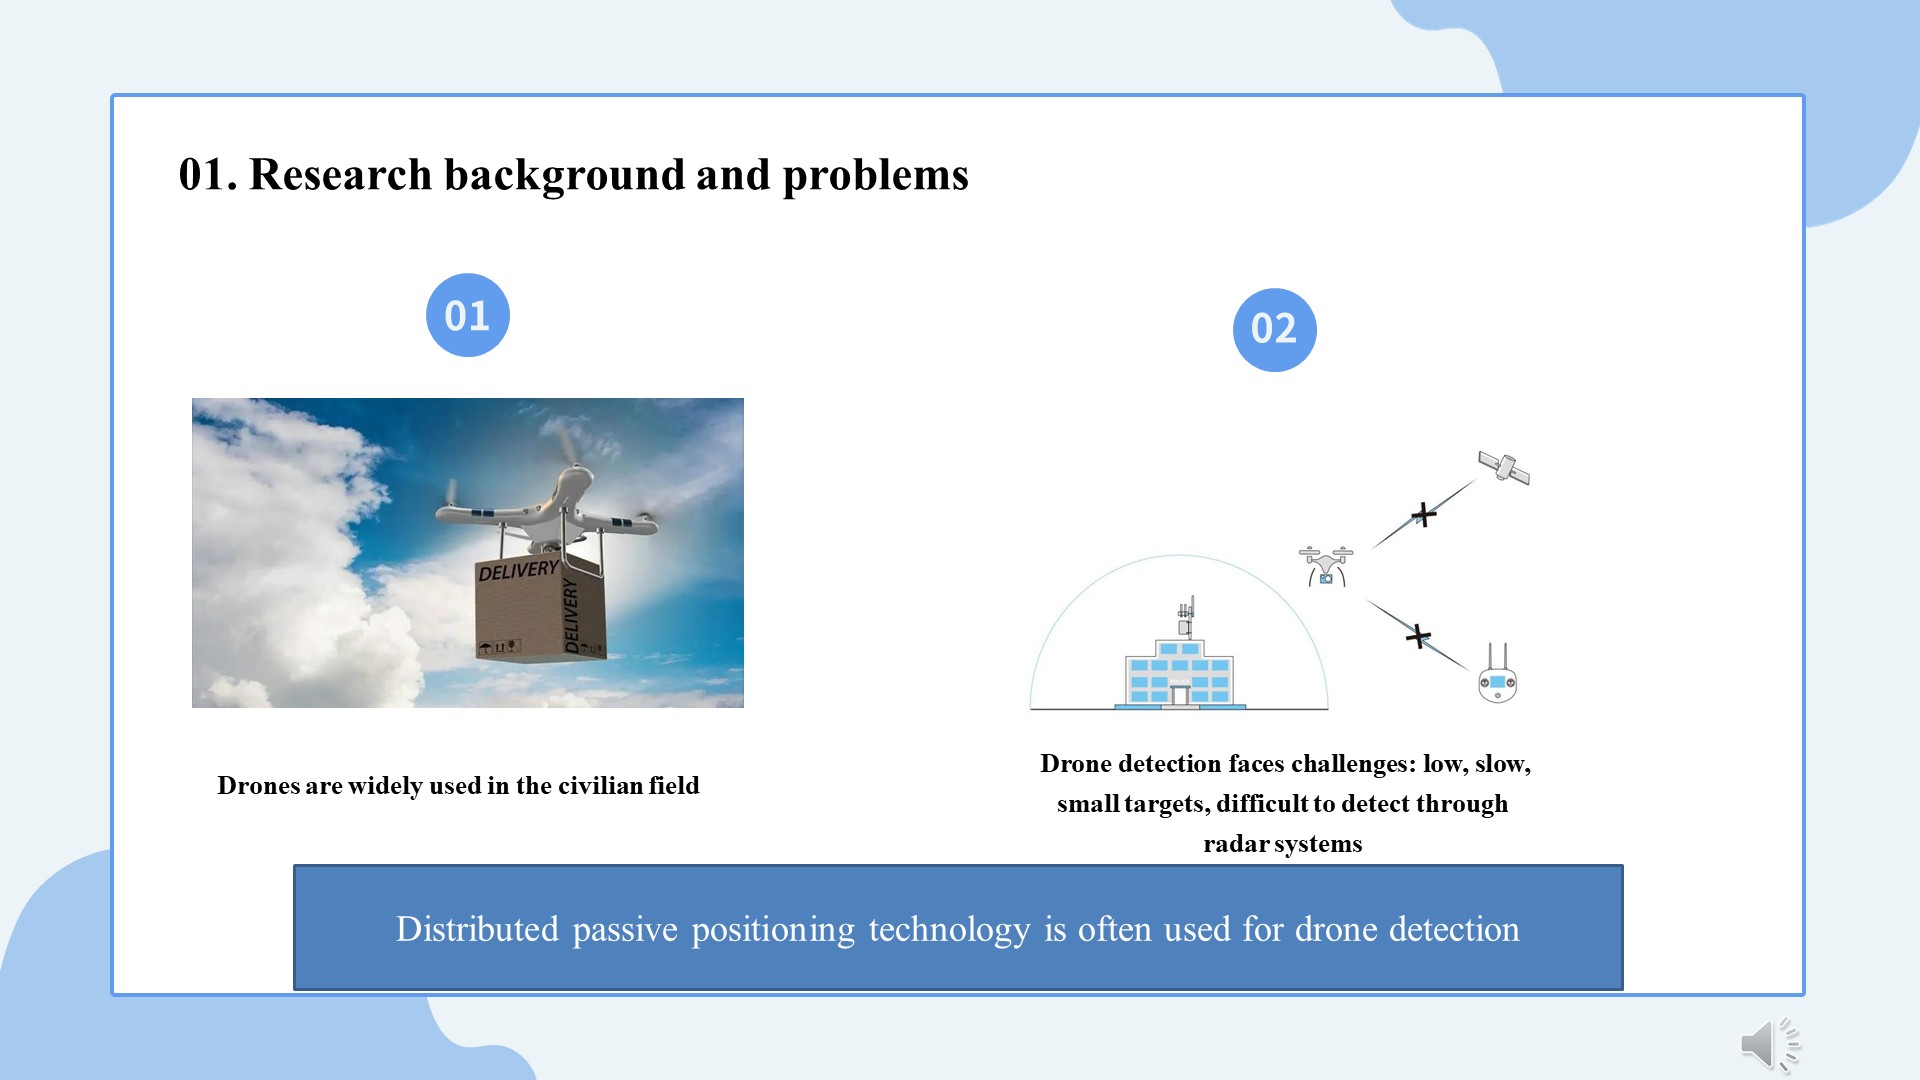 |
With the increasing use of drones in various fields, such as aerial photography and disaster detection, security concerns have arisen. Detecting and localizing drones, especially those classified as 'low, slow, and small,' poses significant challenges. Therefore, distributed passive positioning technology is commonly used to detect drones
|
|
ICACT20250181 Slide.02
[Big slide for presentation]
|
Chrome Text-to-Speach Click!! |
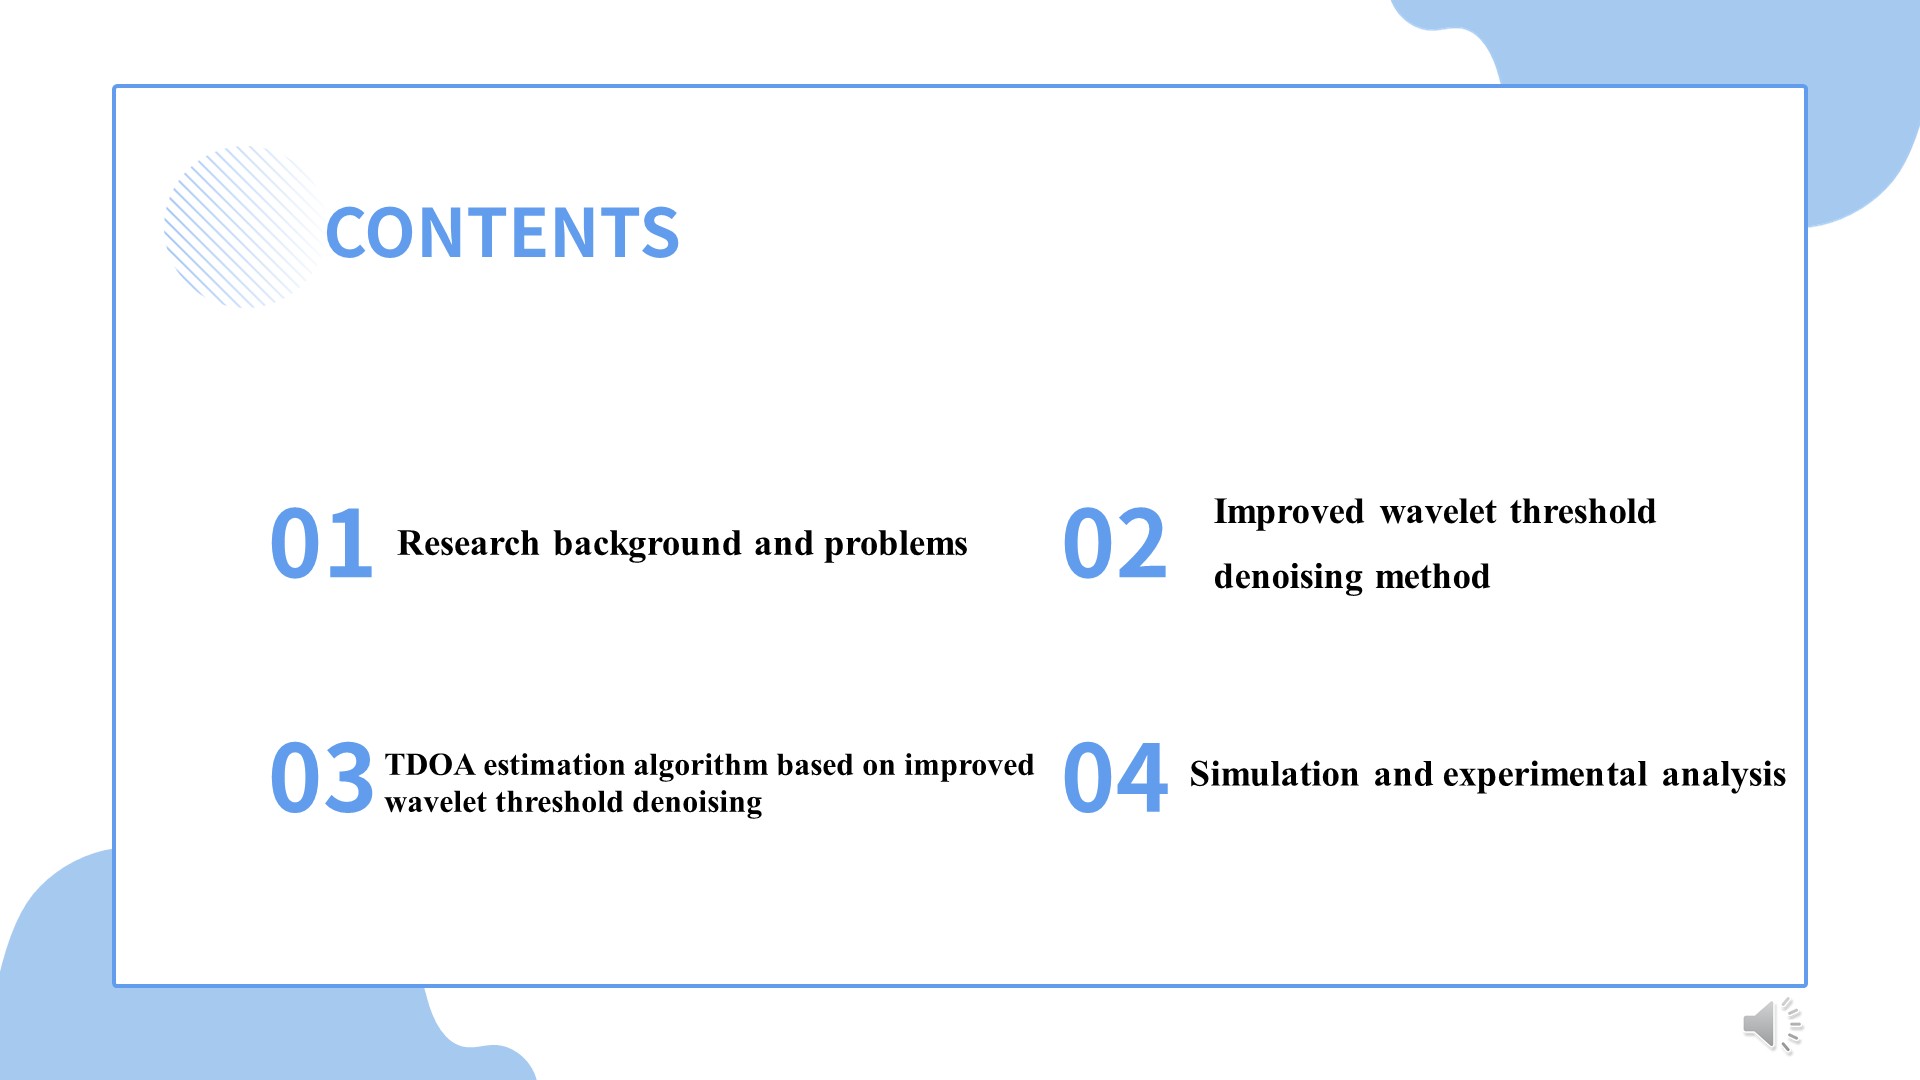 |
My presentation mainly includes the following four parts:Research background and problems
Improved wavelet threshold denoising method
TDOA estimation algorithm based on improved wavelet threshold denoising
Simulation and experimental analysis
|
|
ICACT20250181 Slide.01
[Big slide for presentation]
[YouTube] |
Chrome Text-to-Speach Click!! |
 |
Today, I will present our research on improving TDOA, estimation for drone signal processing using wavelet threshold denoising.
|
















