 ICACT20250019 Slide.18
[Big slide for presentation] |
Chrome Text-to-Speach Click!! |
 |
Thank you.
|
|
ICACT20250019 Slide.17
[Big slide for presentation]
|
Chrome Text-to-Speach Click!! |
 |
References.
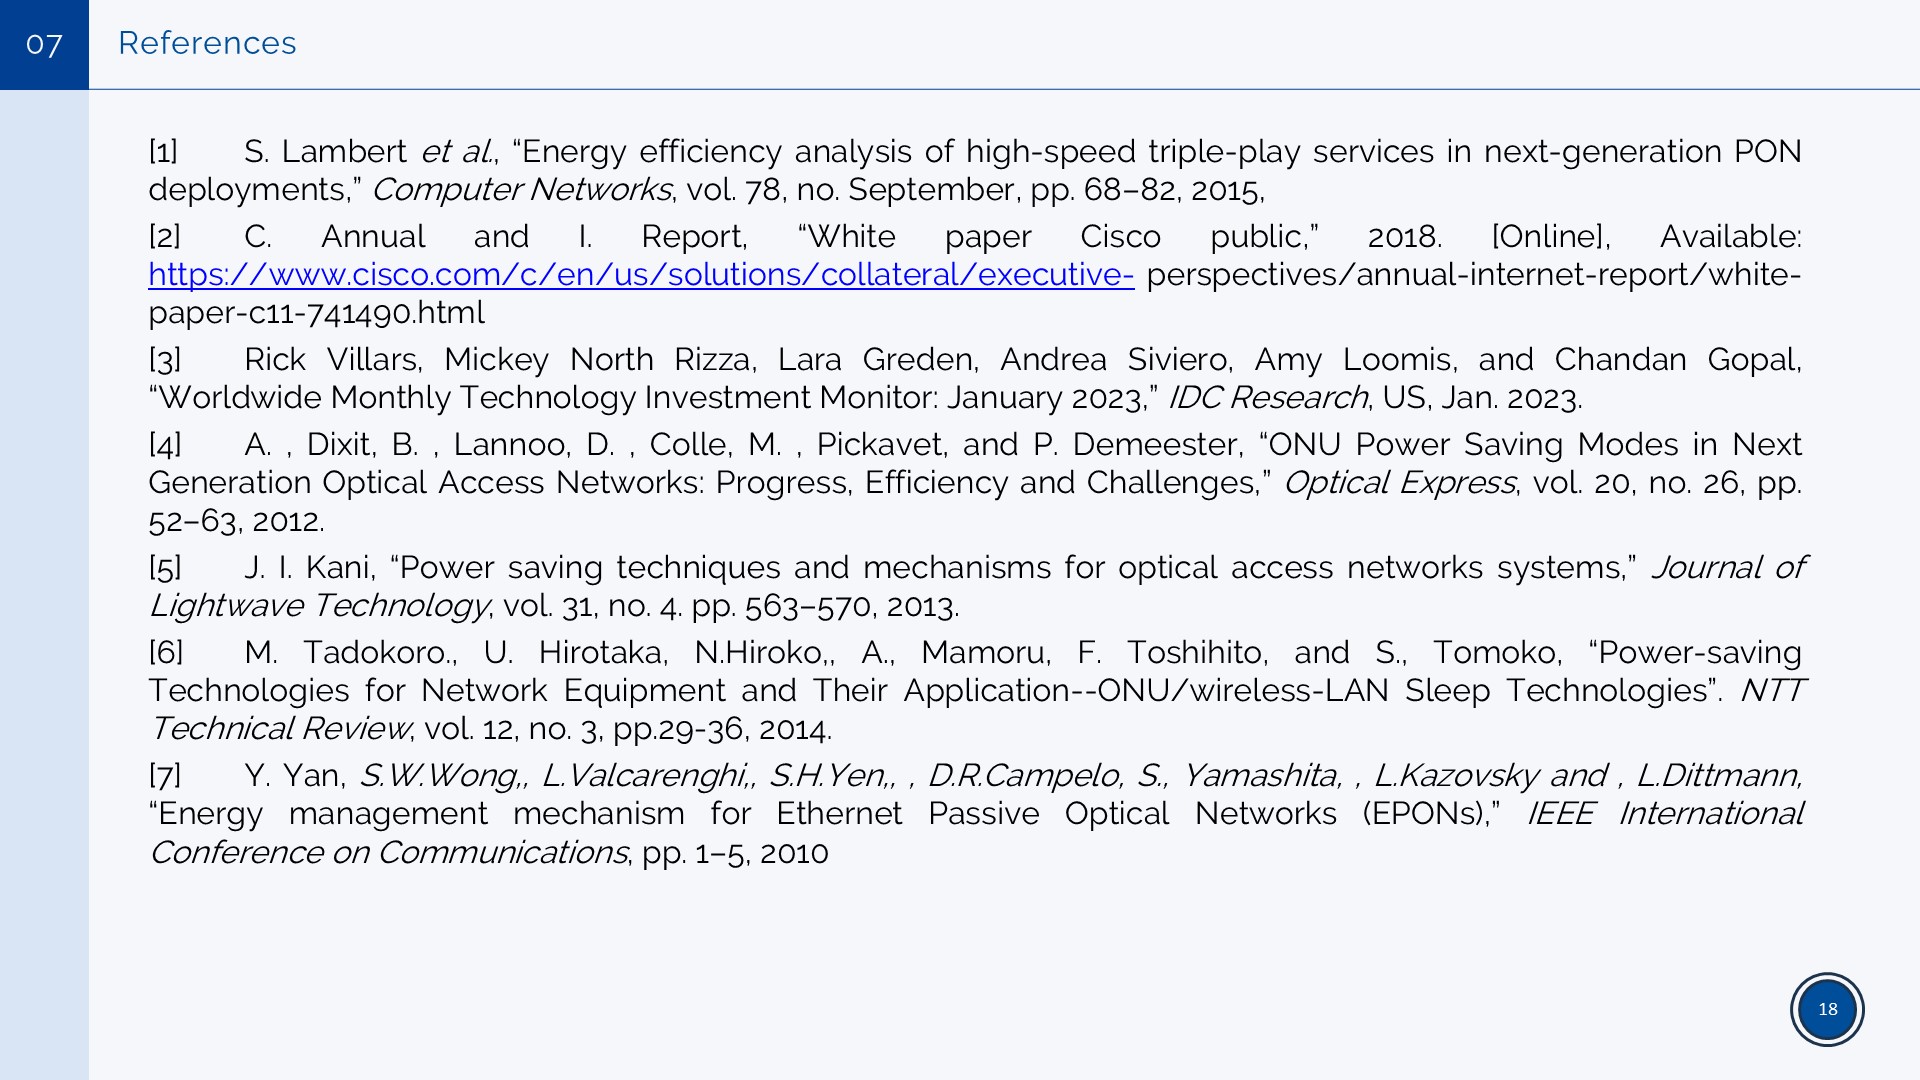
This slide lists key sources used in the research, including journal articles, conference papers, and industry reports.
The references cover topics such as energy efficiency in optical networks, power-saving mechanisms, and next-generation network technologies.
Some references come from academic journals, while others are from technical reports and industry research, ensuring a mix of theoretical and practical insights.
These references support the findings and methodologies used in the study.
|
|
ICACT20250019 Slide.16
[Big slide for presentation]
|
Chrome Text-to-Speach Click!! |
 |
Conclusion.
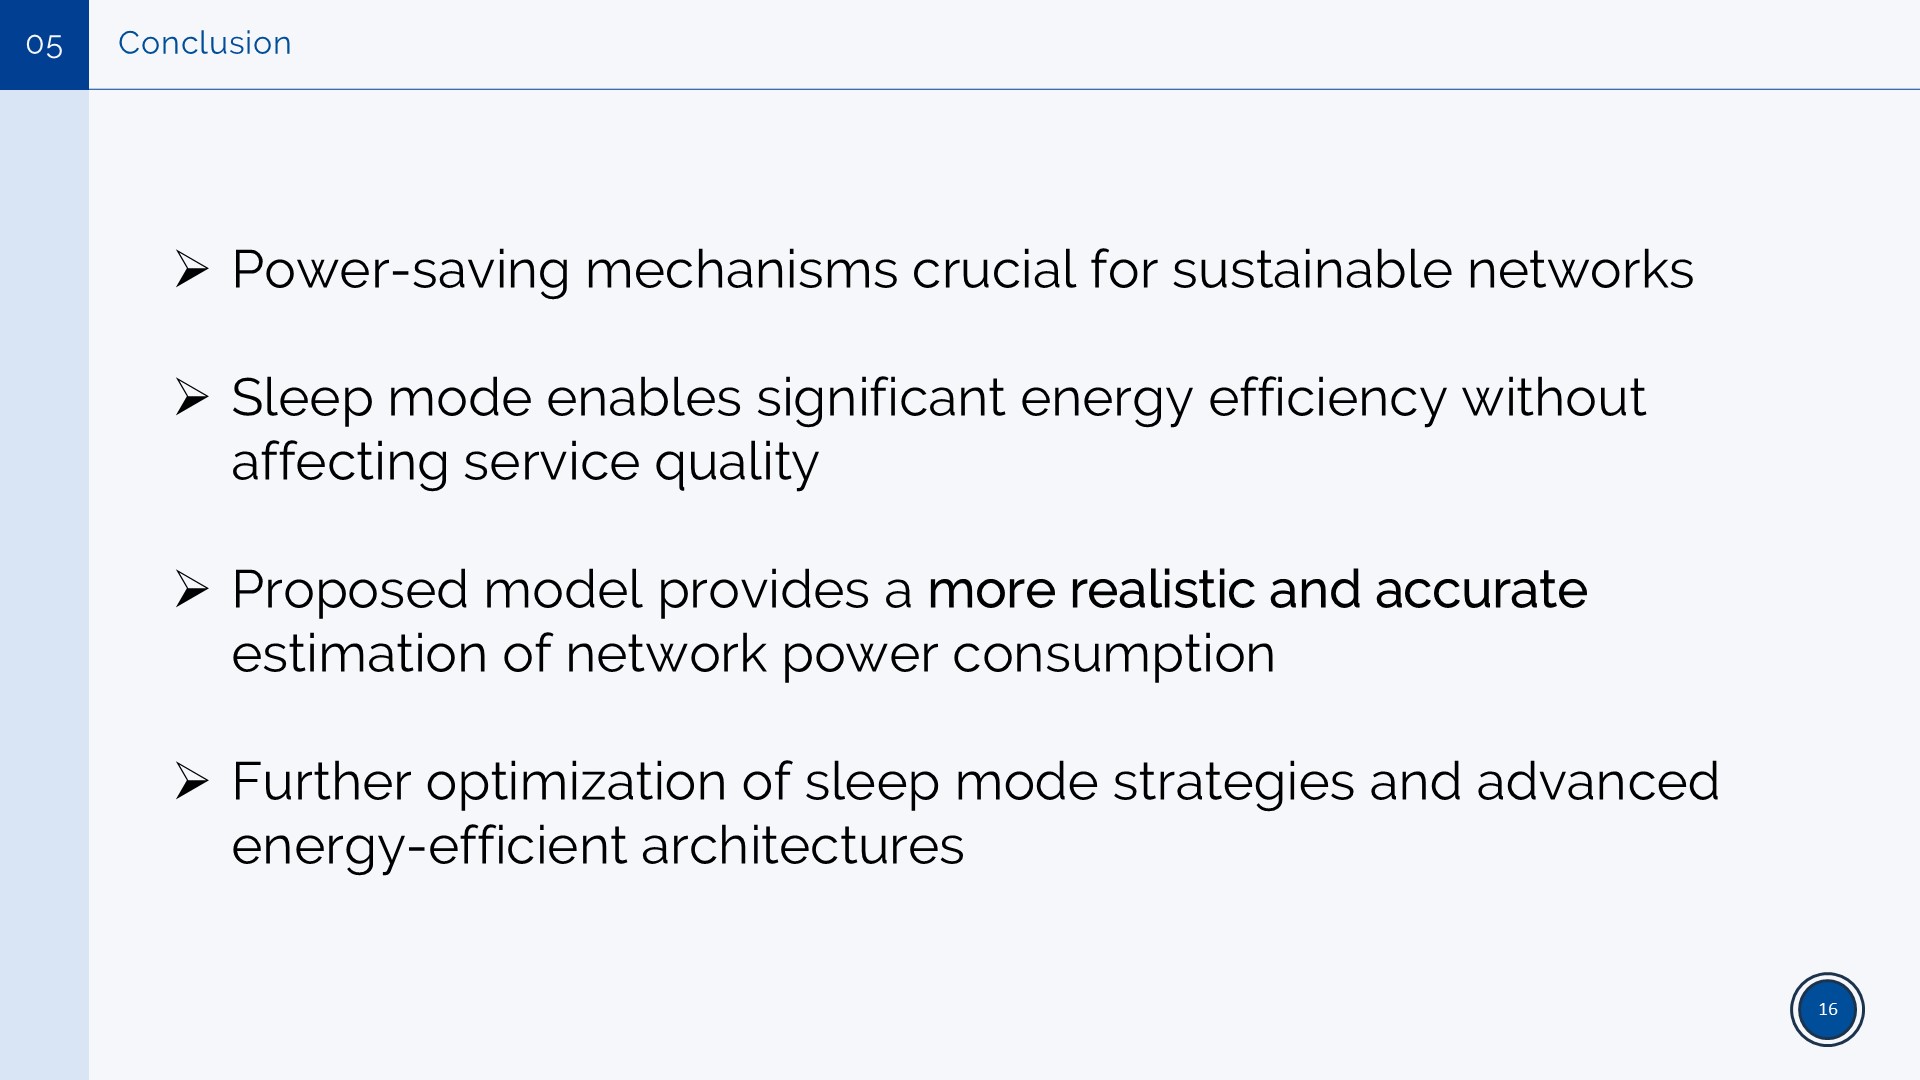
Power-saving mechanisms are essential for sustainable networks.
Sleep mode significantly reduces energy consumption without impacting service quality.
The proposed model offers a more realistic and accurate estimation of network power usage compared to conventional models.
Further optimization of sleep mode strategies and energy-efficient architectures can enhance future network efficiency.
|
|
ICACT20250019 Slide.15
[Big slide for presentation]
|
Chrome Text-to-Speach Click!! |
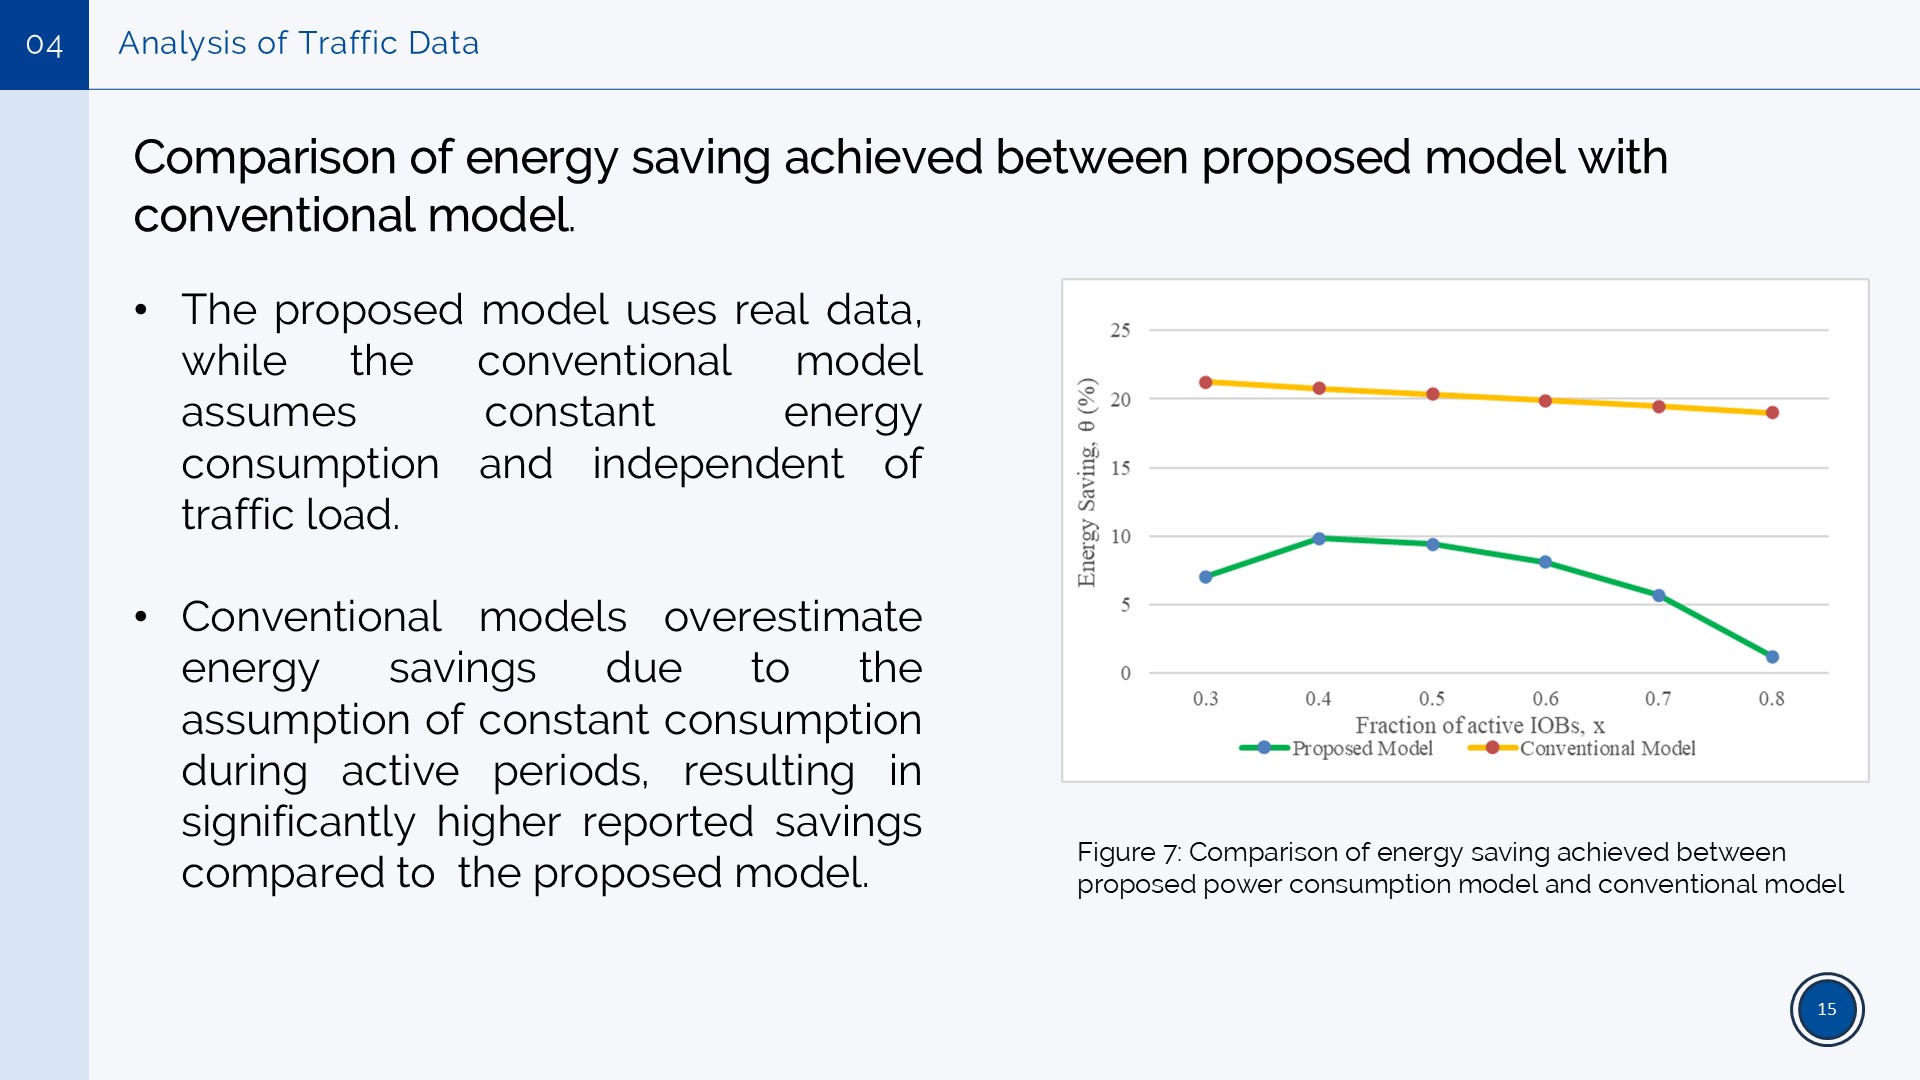 |
Comparison of Energy Savings: Proposed vs. Conventional Model.
The proposed model uses real network data, adjusting energy consumption based on actual traffic load.
The conventional model assumes constant energy consumption, regardless of traffic variations.
As a result, conventional models tend to overestimate energy savings, since they do not account for traffic-dependent variations.
The graph shows that the proposed model provides a more realistic energy-saving estimation, while the conventional model reports higher but less accurate savings.
|
|
ICACT20250019 Slide.14
[Big slide for presentation]
|
Chrome Text-to-Speach Click!! |
 |
Energy Savings Calculation.
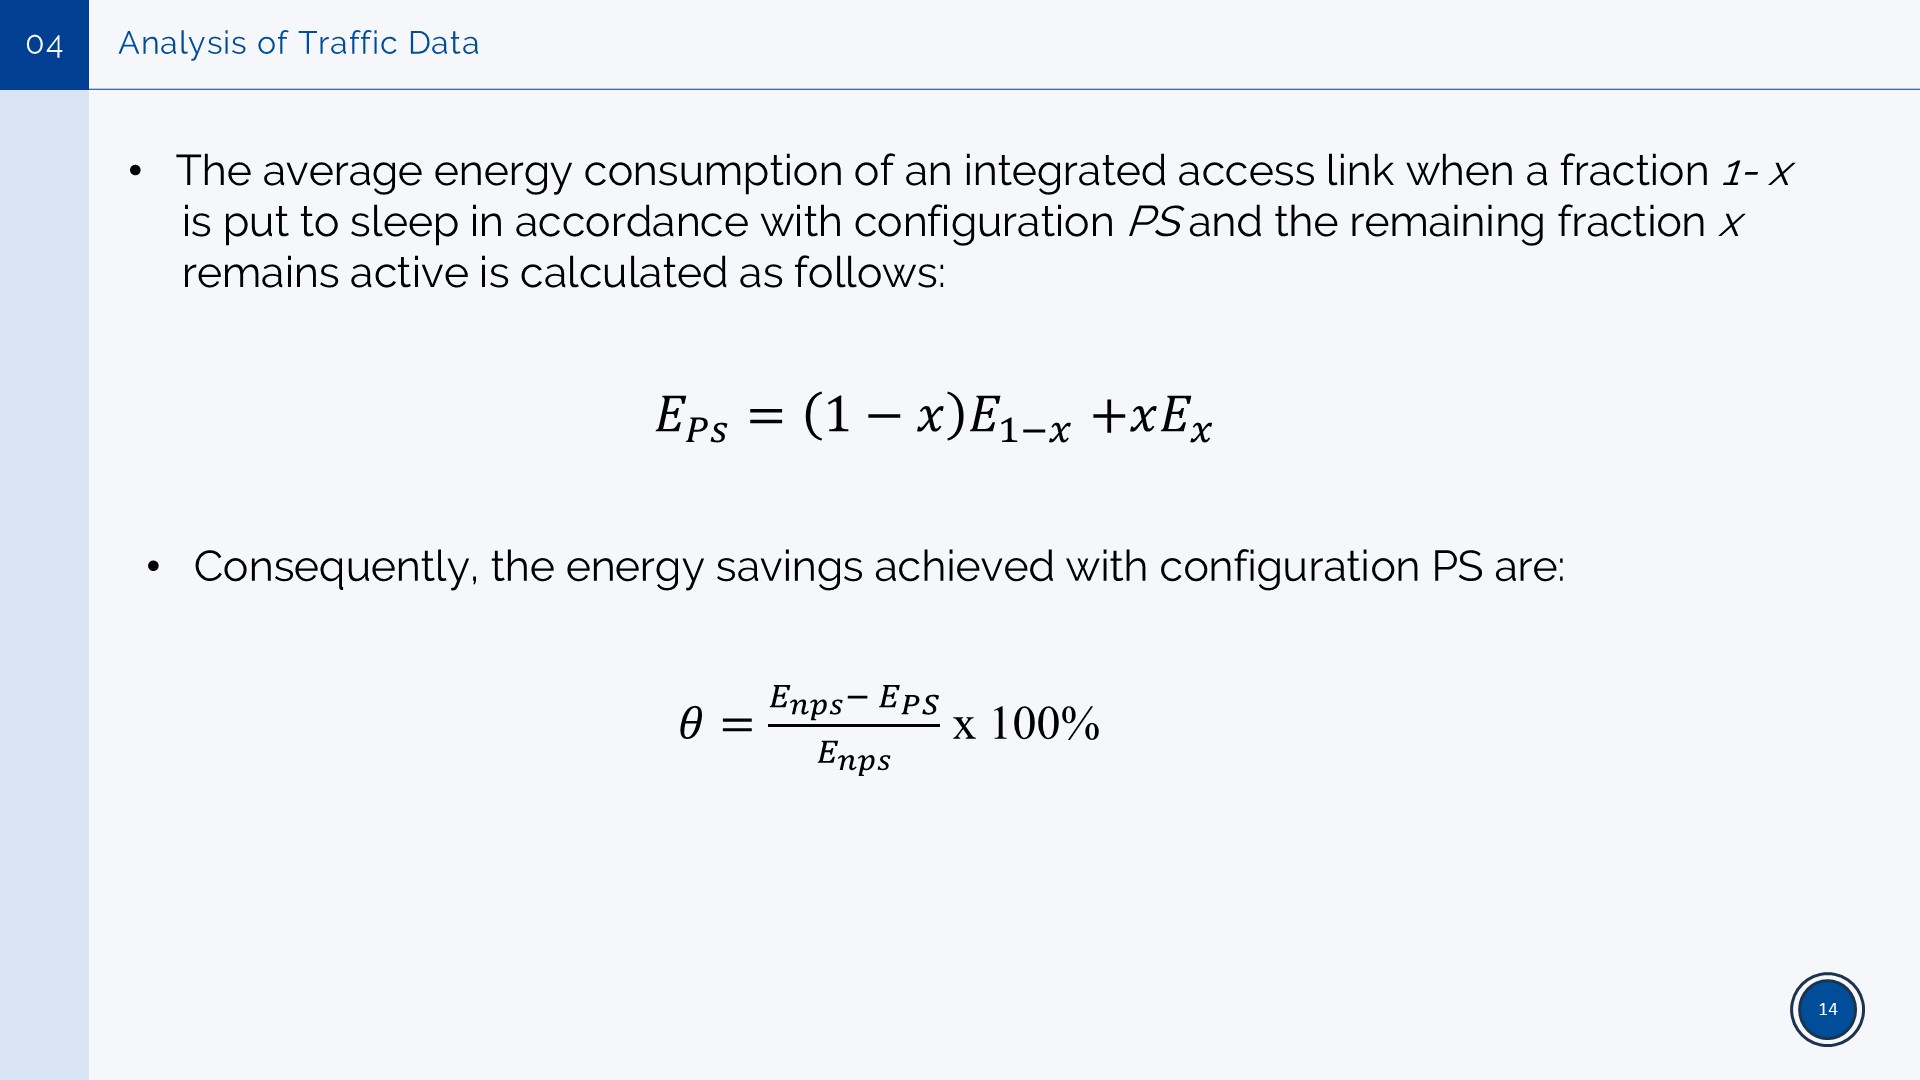
This slide presents the energy consumption model when a fraction of IOBs enter sleep mode while others remain active.
The energy consumption equation accounts for both active (x) and sleeping (1-x) IOBs.
The energy savings formula calculates the percentage of energy reduction achieved through the power-saving configuration.
This helps quantify the efficiency of power-saving strategies in integrated access networks.
|
|
ICACT20250019 Slide.13
[Big slide for presentation]
|
Chrome Text-to-Speach Click!! |
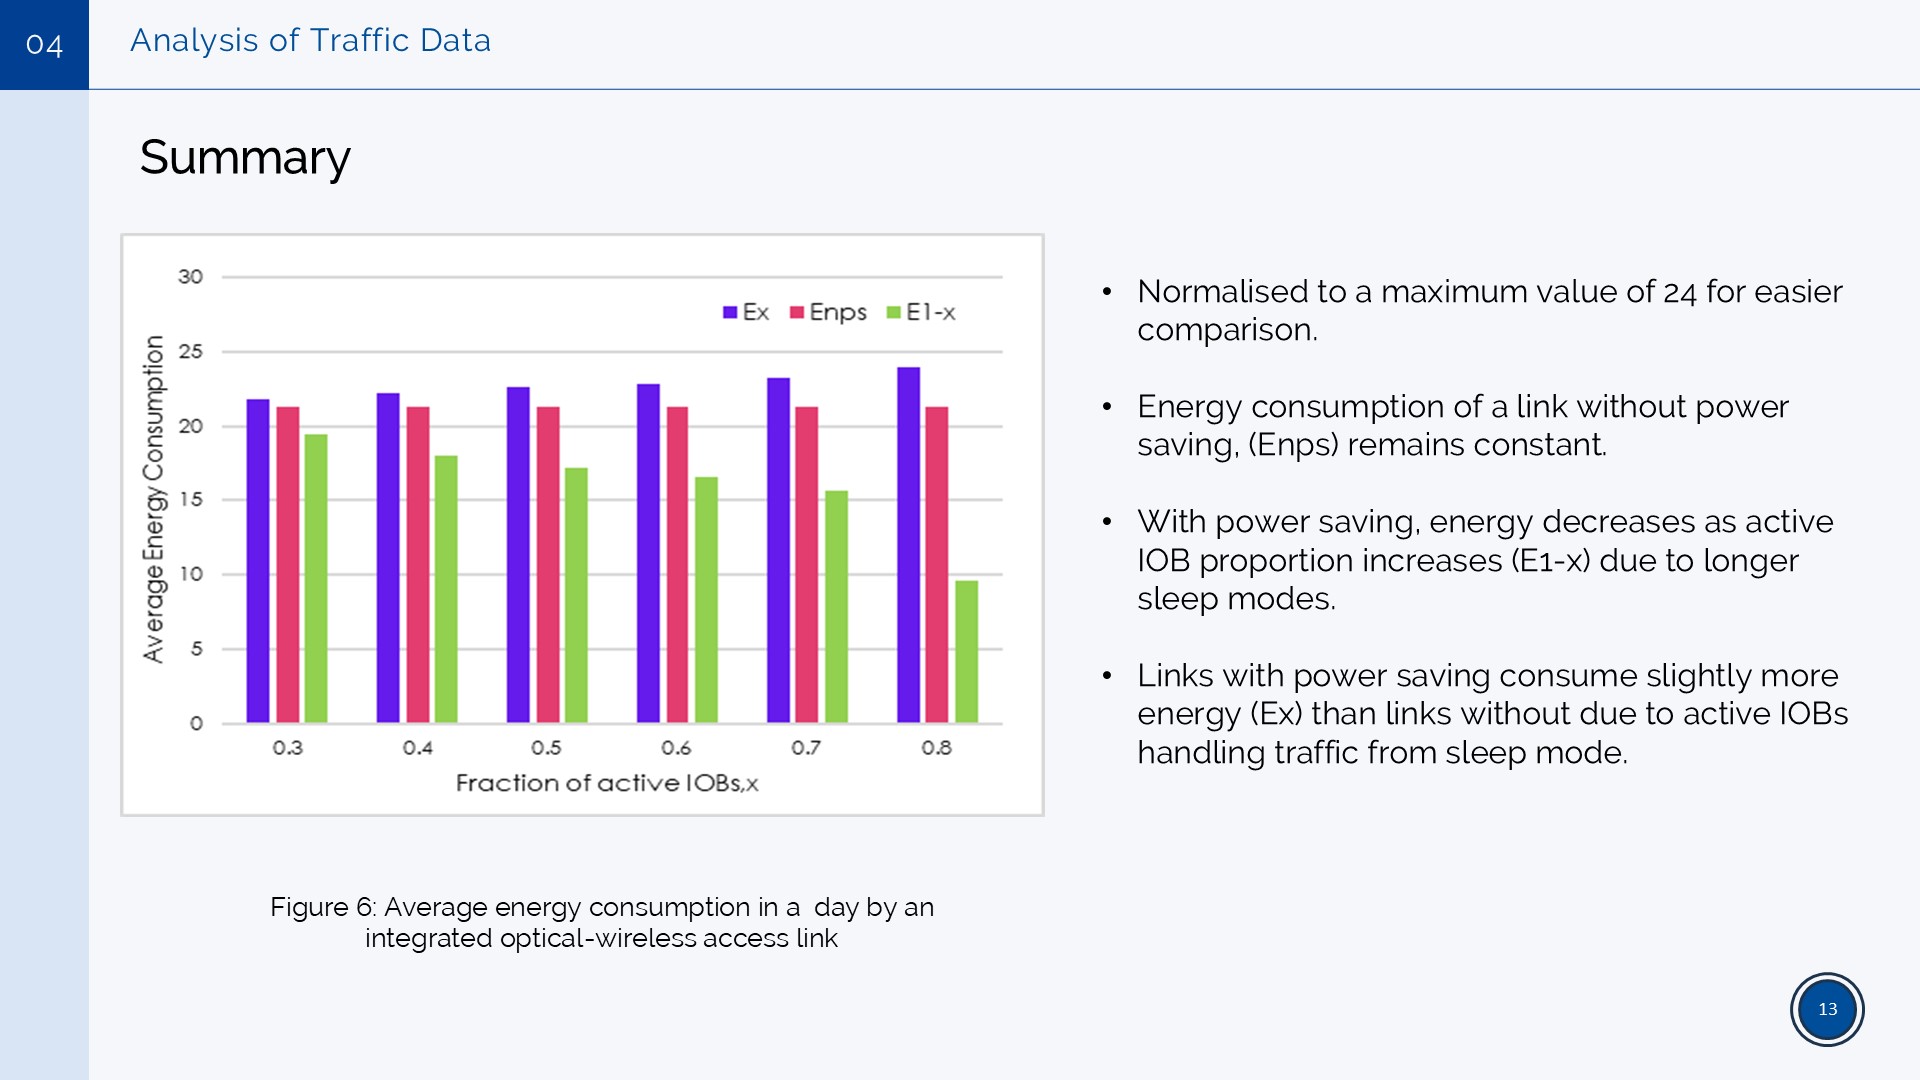 |
ummary of Energy Consumption Analysis.
The energy consumption values are normalized to a maximum of 24 for easier comparison.
Without power saving (Enps), energy consumption remains constant throughout the day.
With power saving (E1-x), energy usage decreases as more IOBs enter longer sleep modes.
Links with power saving (Ex) consume slightly more energy than expected because active IOBs handle traffic from sleeping ones.
This analysis highlights the trade-off between energy savings and network performance when implementing sleep modes.
|
|
ICACT20250019 Slide.12
[Big slide for presentation]
|
Chrome Text-to-Speach Click!! |
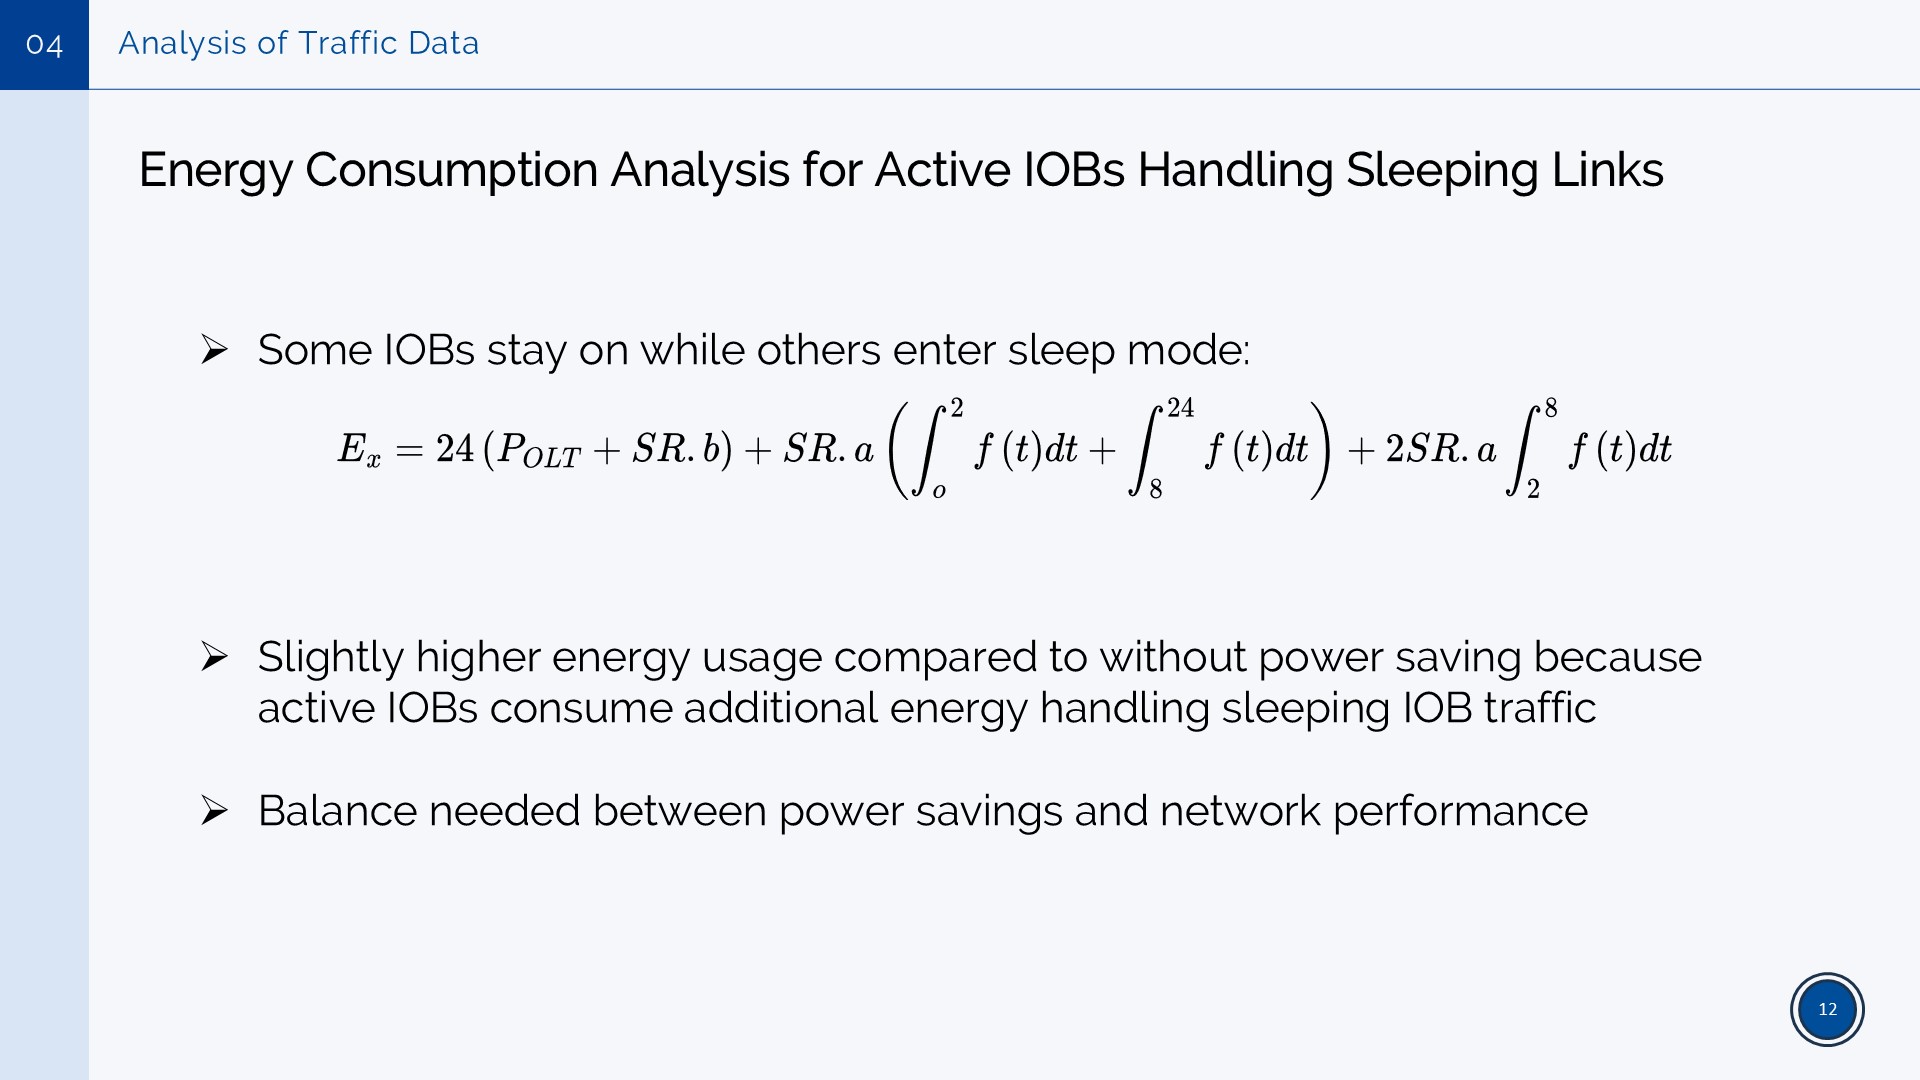 |
Energy Consumption Analysis for Active IOBs Handling Sleeping Links.
Some Integrated Optical Basestations (IOBs) remain active, while others enter sleep mode to save power.
The power consumption equation reflects the energy usage for handling both active and sleeping IOBs.
Slightly higher energy usage occurs compared to full sleep mode, as active IOBs must manage traffic from sleeping ones.
A balance is needed between power savings and maintaining network performance.
|
|
ICACT20250019 Slide.11
[Big slide for presentation]
|
Chrome Text-to-Speach Click!! |
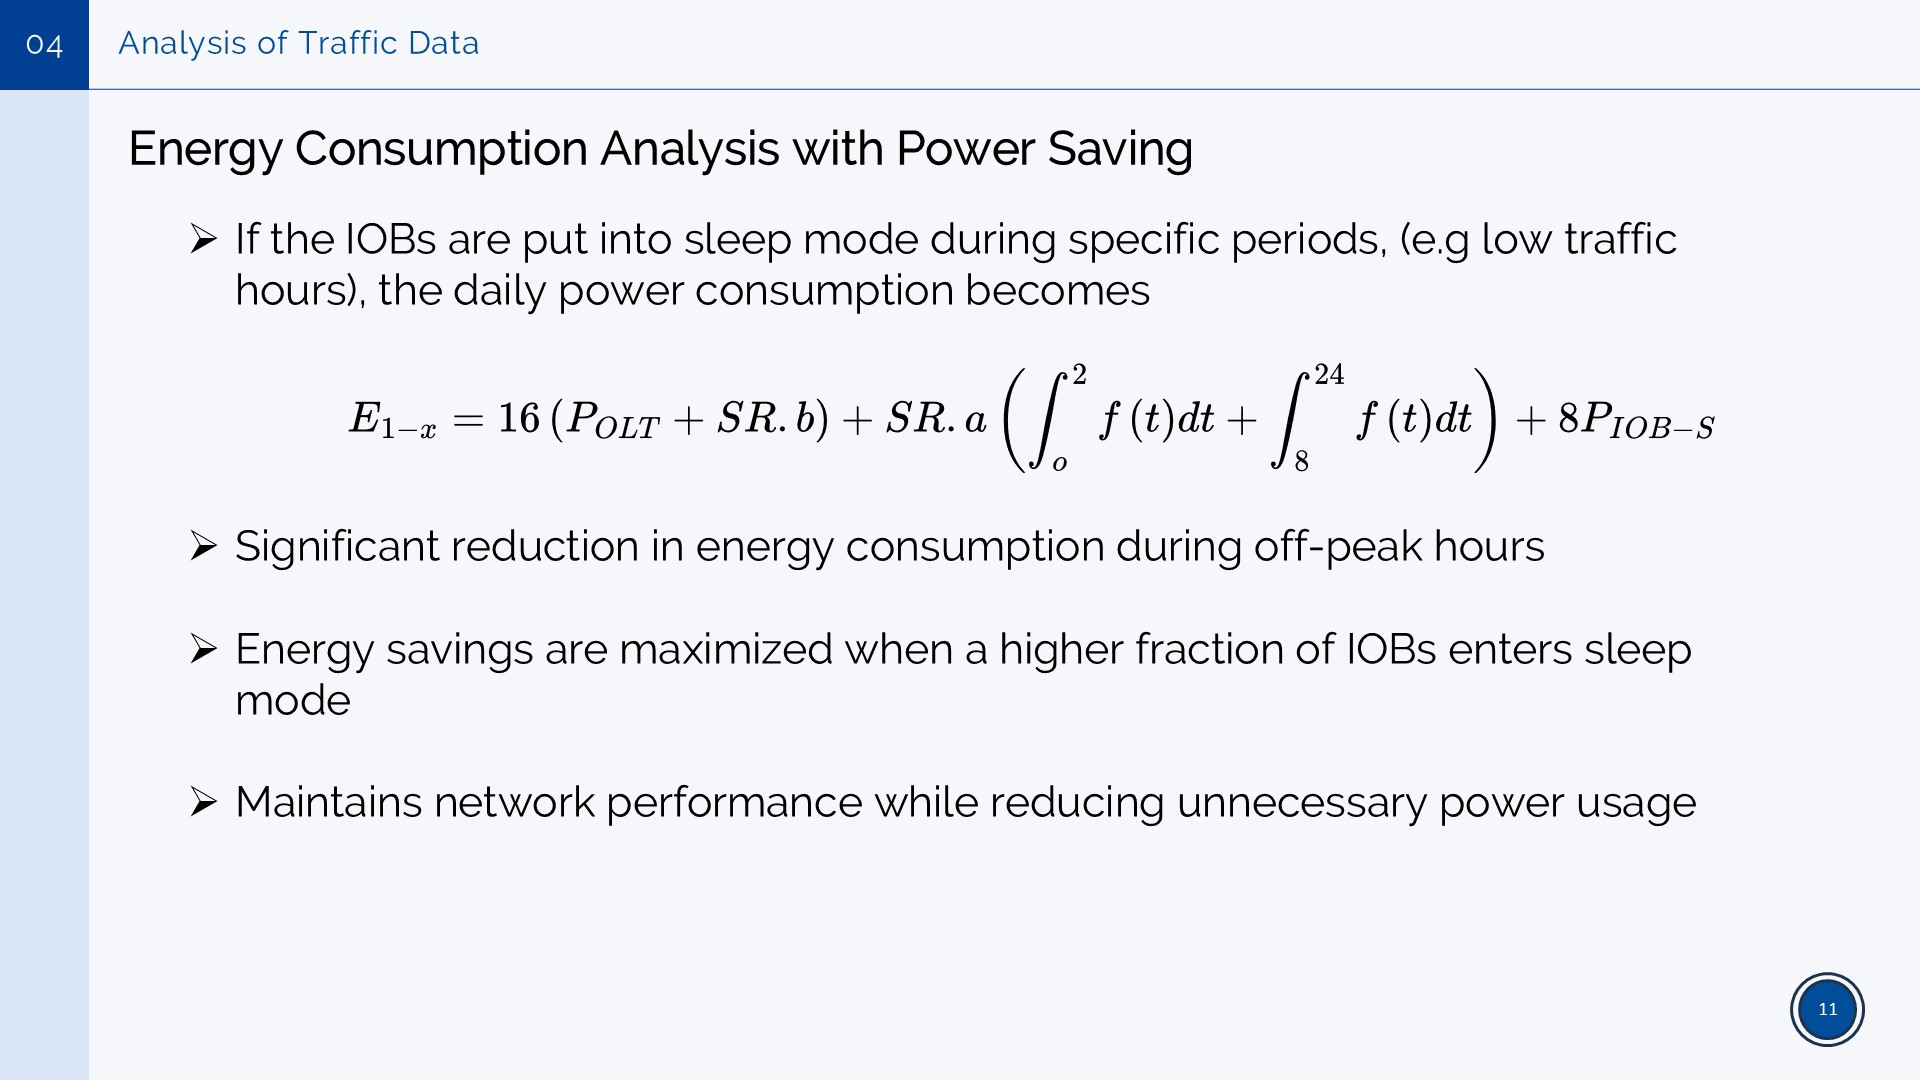 |
Energy Consumption Analysis with Power Saving.
When Integrated Optical Basestations (IOBs) enter sleep mode during low-traffic periods, overall power consumption decreases.
The power consumption equation is updated to reflect this energy-saving approach.
This results in a significant reduction in energy use, especially during off-peak hours.
More energy savings occur when a larger fraction of IOBs enter sleep mode.
This method helps maintain network performance while reducing unnecessary power usage.
|
|
ICACT20250019 Slide.10
[Big slide for presentation]
|
Chrome Text-to-Speach Click!! |
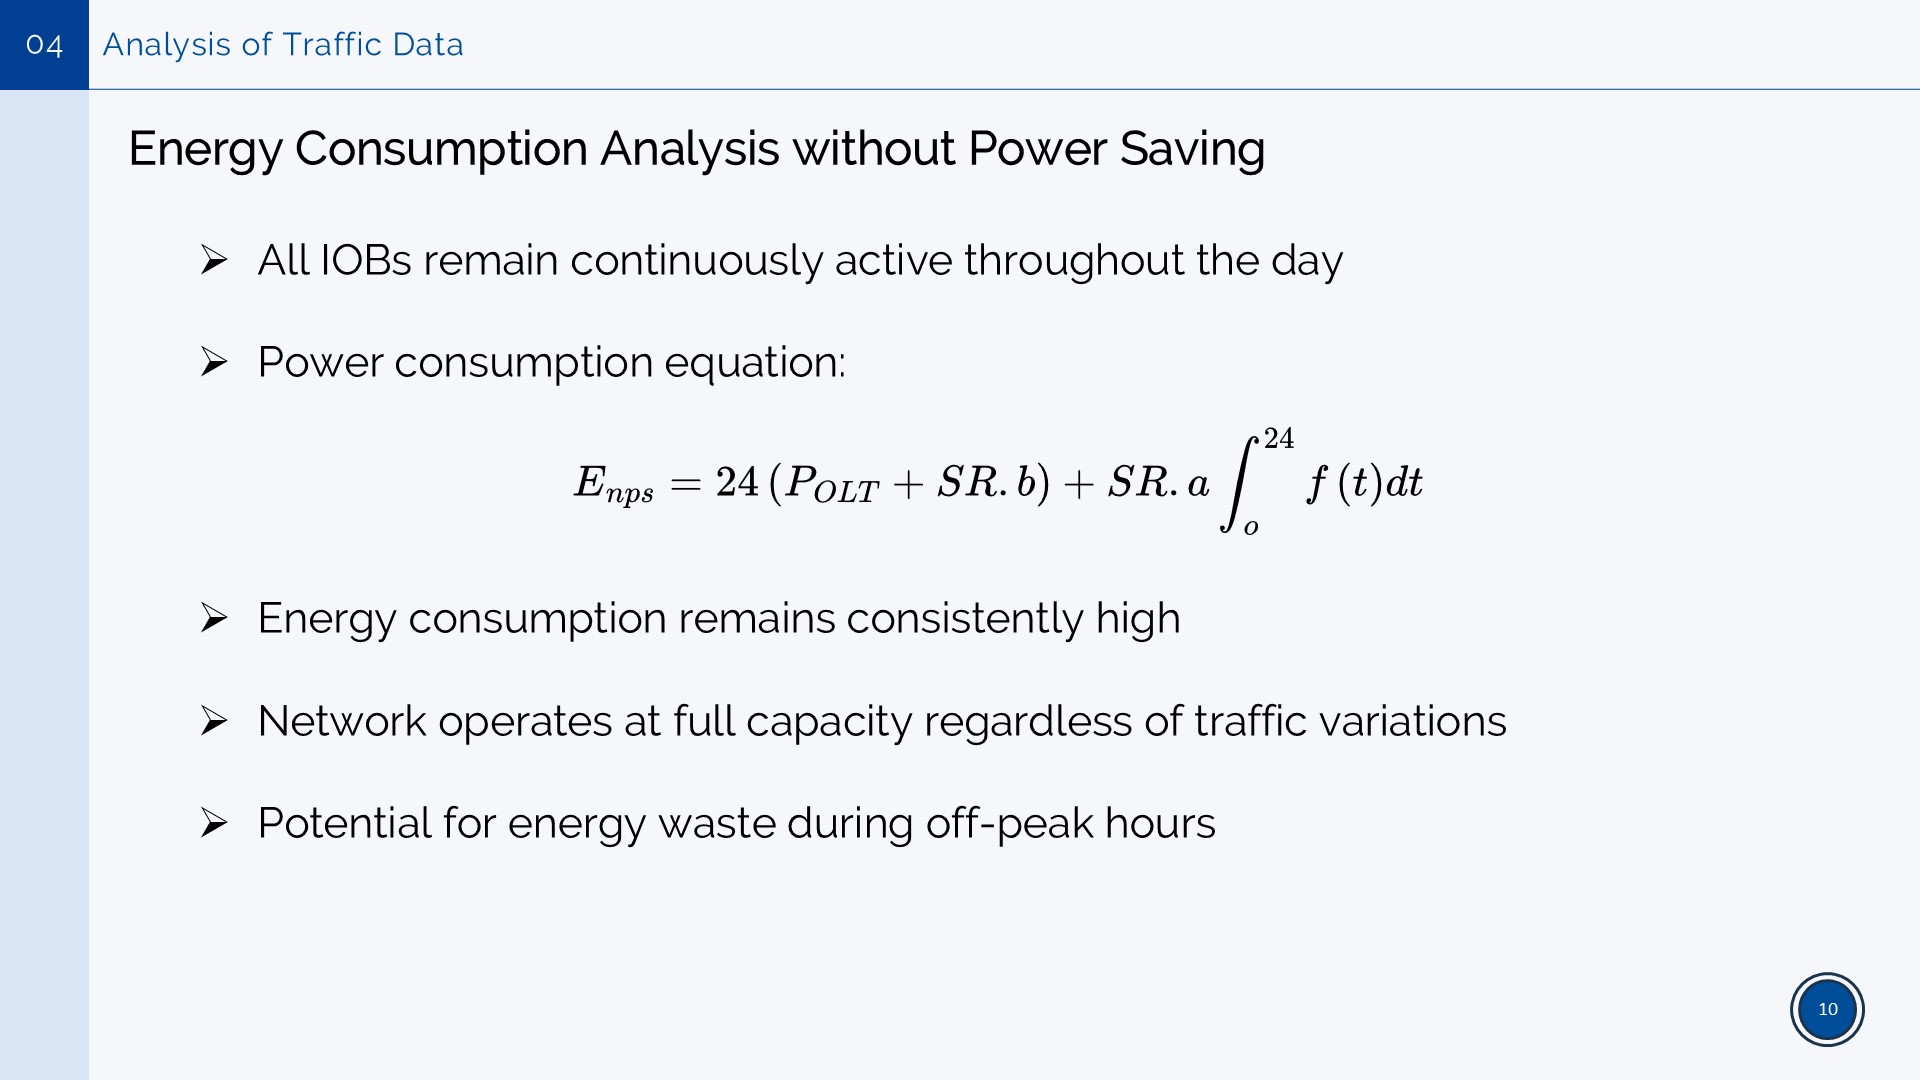 |
Energy Consumption Analysis without Power Saving.
In this scenario, all Integrated Optical Basestations (IOBs) remain active 24/7, without any power-saving measures.
The power consumption equation is presented, showing how energy usage is calculated over a full day.
This leads to high energy consumption at all times, regardless of actual network demand.
The network operates at full capacity even when traffic is low.
As a result, significant energy is wasted during off-peak hours.
|
|
ICACT20250019 Slide.09
[Big slide for presentation]
|
Chrome Text-to-Speach Click!! |
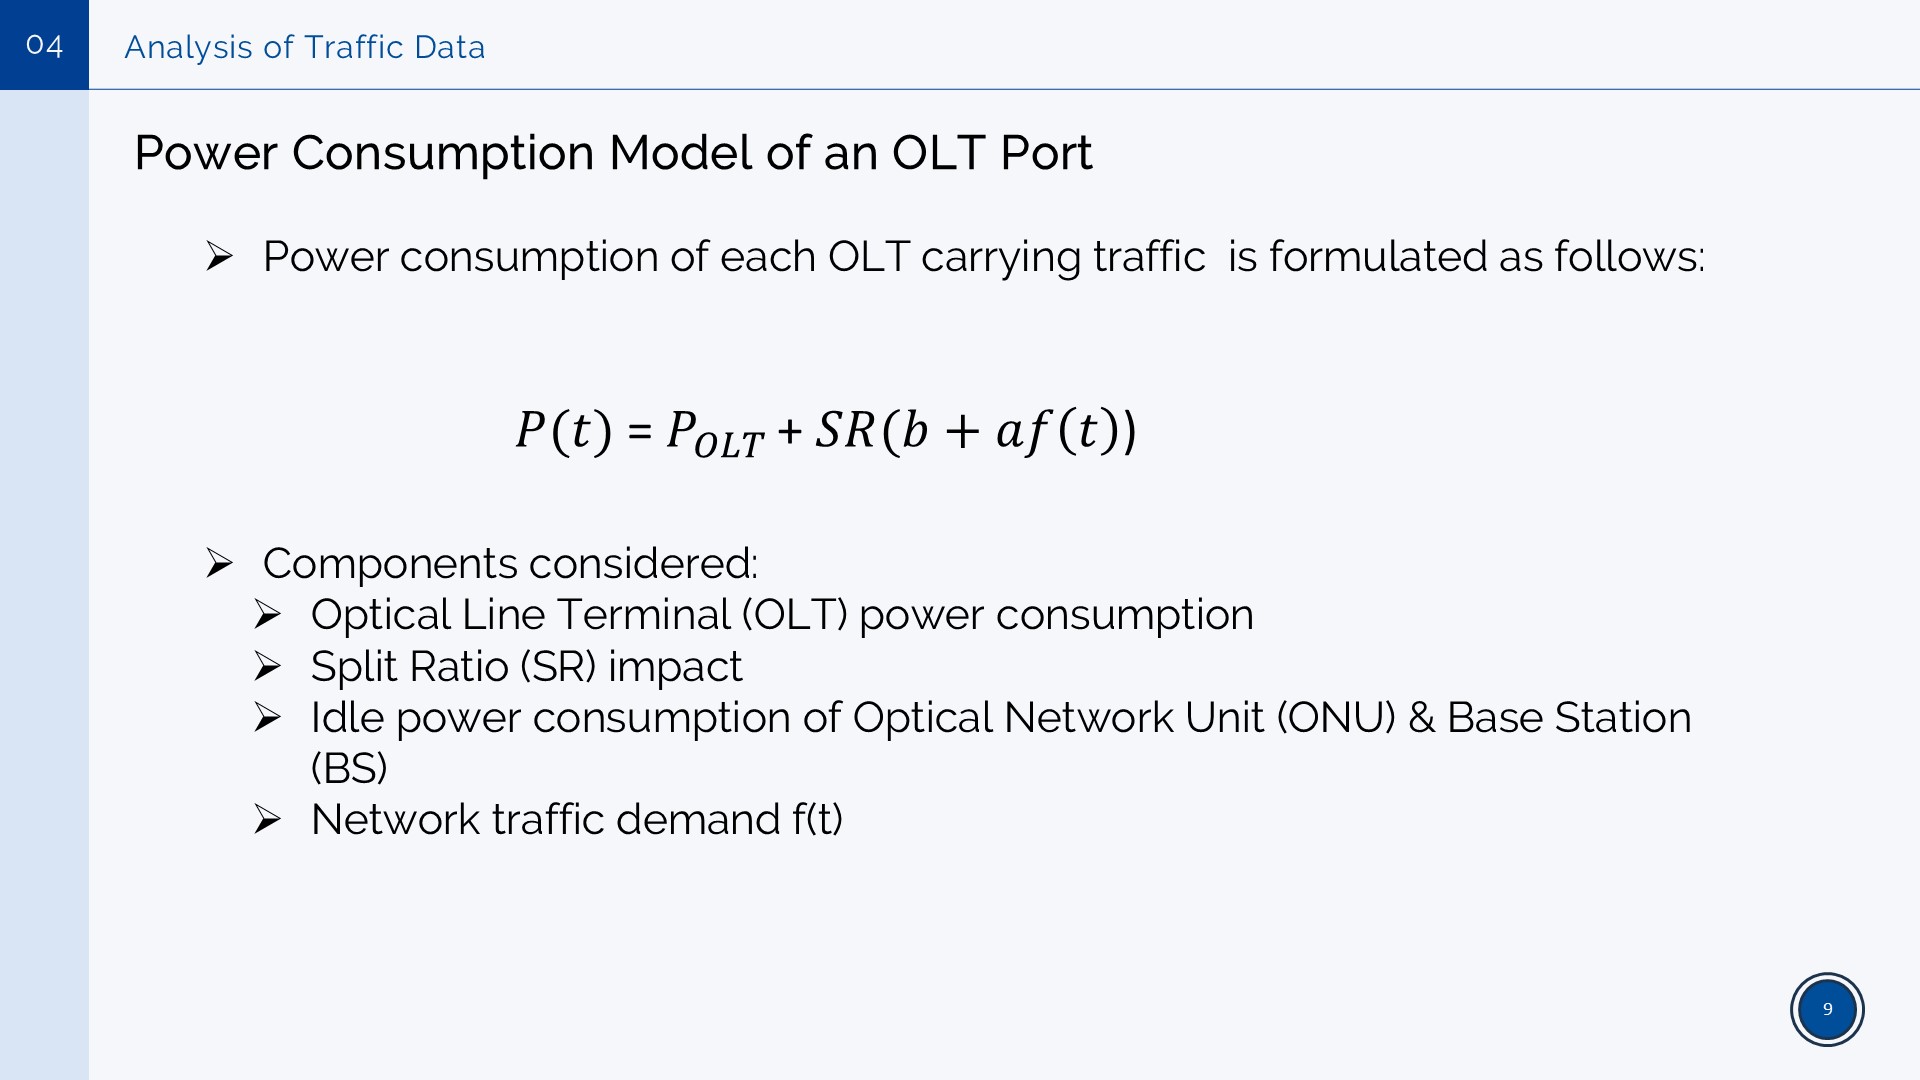 |
ower Consumption Model of an OLT Port.
This slide presents a formula for calculating the power consumption of an Optical Line Terminal (OLT) carrying network traffic.
The equation considers several factors, including:
OLT power consumption
Split Ratio (SR) impact, which affects power distribution
Idle power consumption of Optical Network Units (ONUs) and Base Stations (BS)
Network traffic demand (f(t)), which varies over time
This model helps in understanding and optimizing power usage in optical networks.
|
|
ICACT20250019 Slide.08
[Big slide for presentation]
|
Chrome Text-to-Speach Click!! |
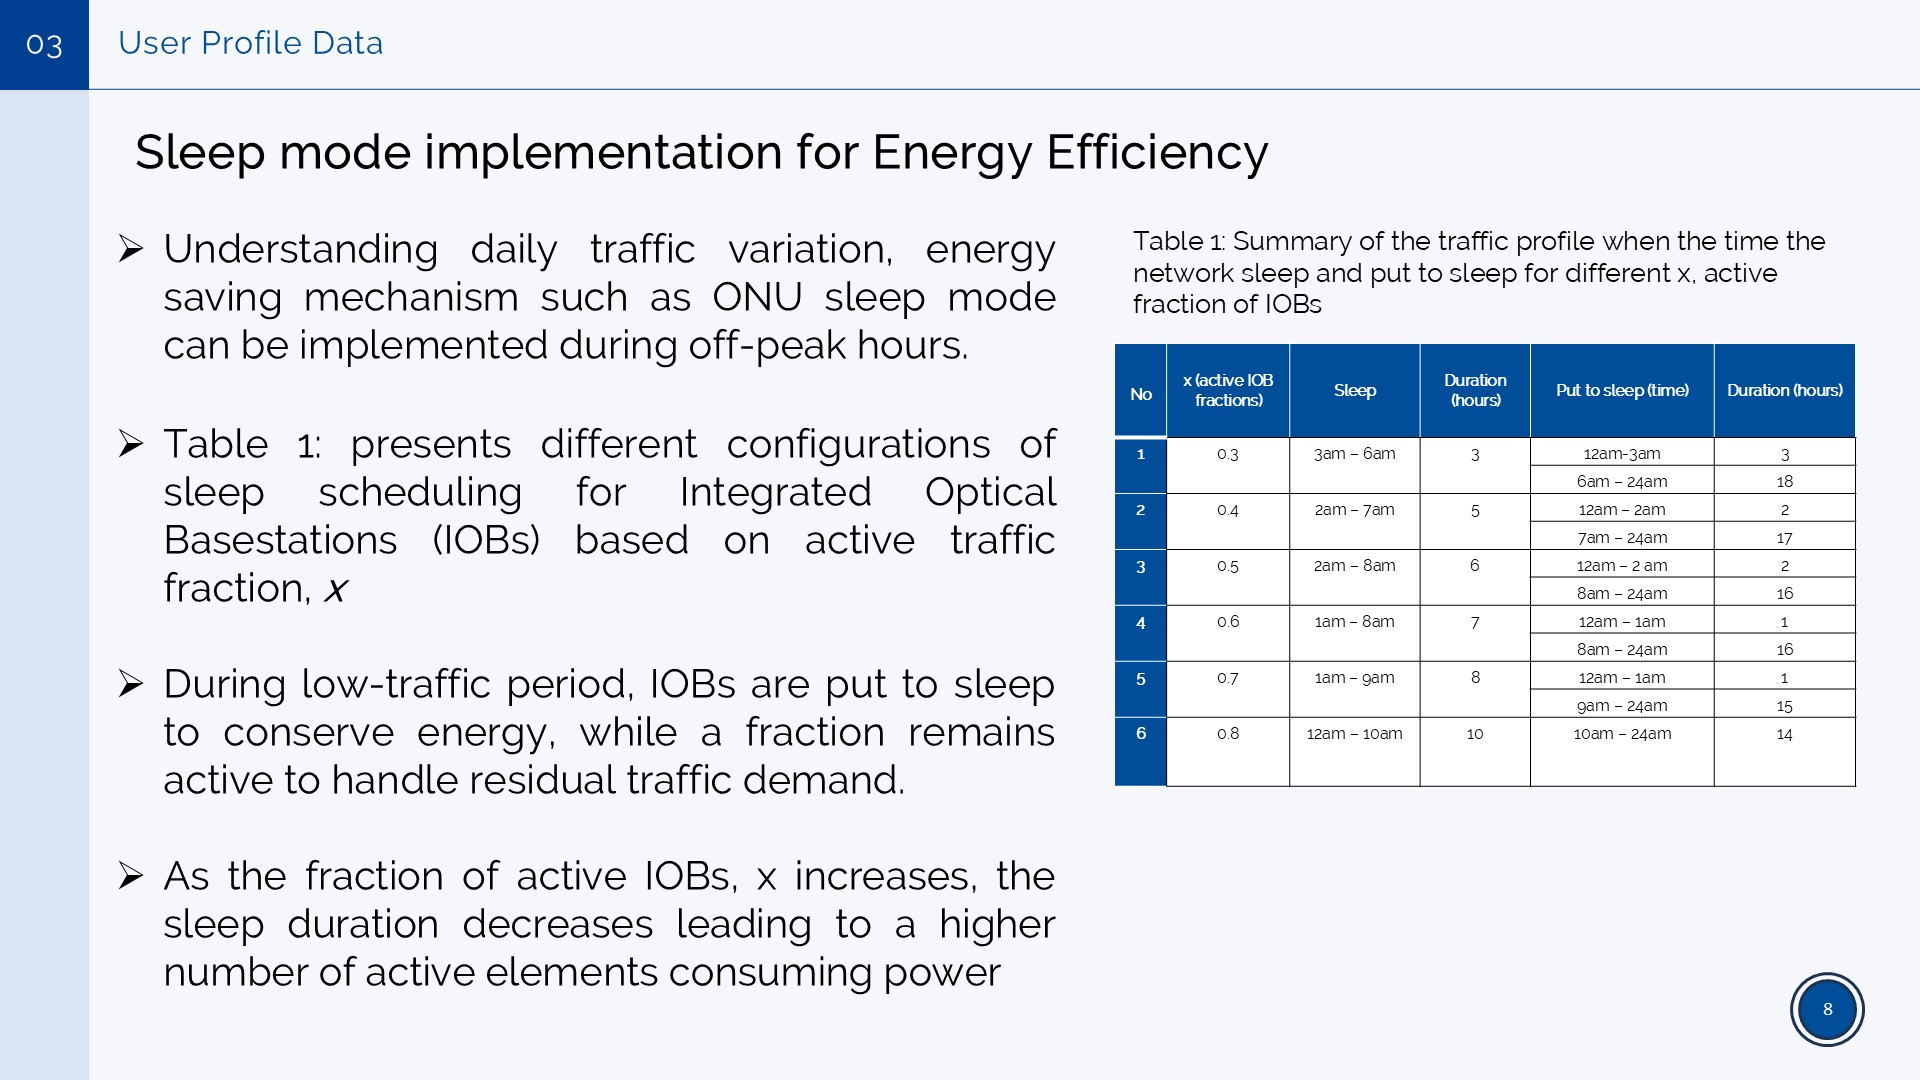 |
Sleep Mode Implementation for Energy Efficiency.
To save energy, network components like ONUs can be put into sleep mode during low-traffic hours.
Table 1 shows different sleep schedules for Integrated Optical Basestations (IOBs) based on traffic activity levels.
During low-traffic periods, some IOBs go into sleep mode, while others remain active to handle ongoing traffic.
When more IOBs remain active (higher x value), the sleep duration decreases, leading to higher power consumption.
|
|
ICACT20250019 Slide.07
[Big slide for presentation]
|
Chrome Text-to-Speach Click!! |
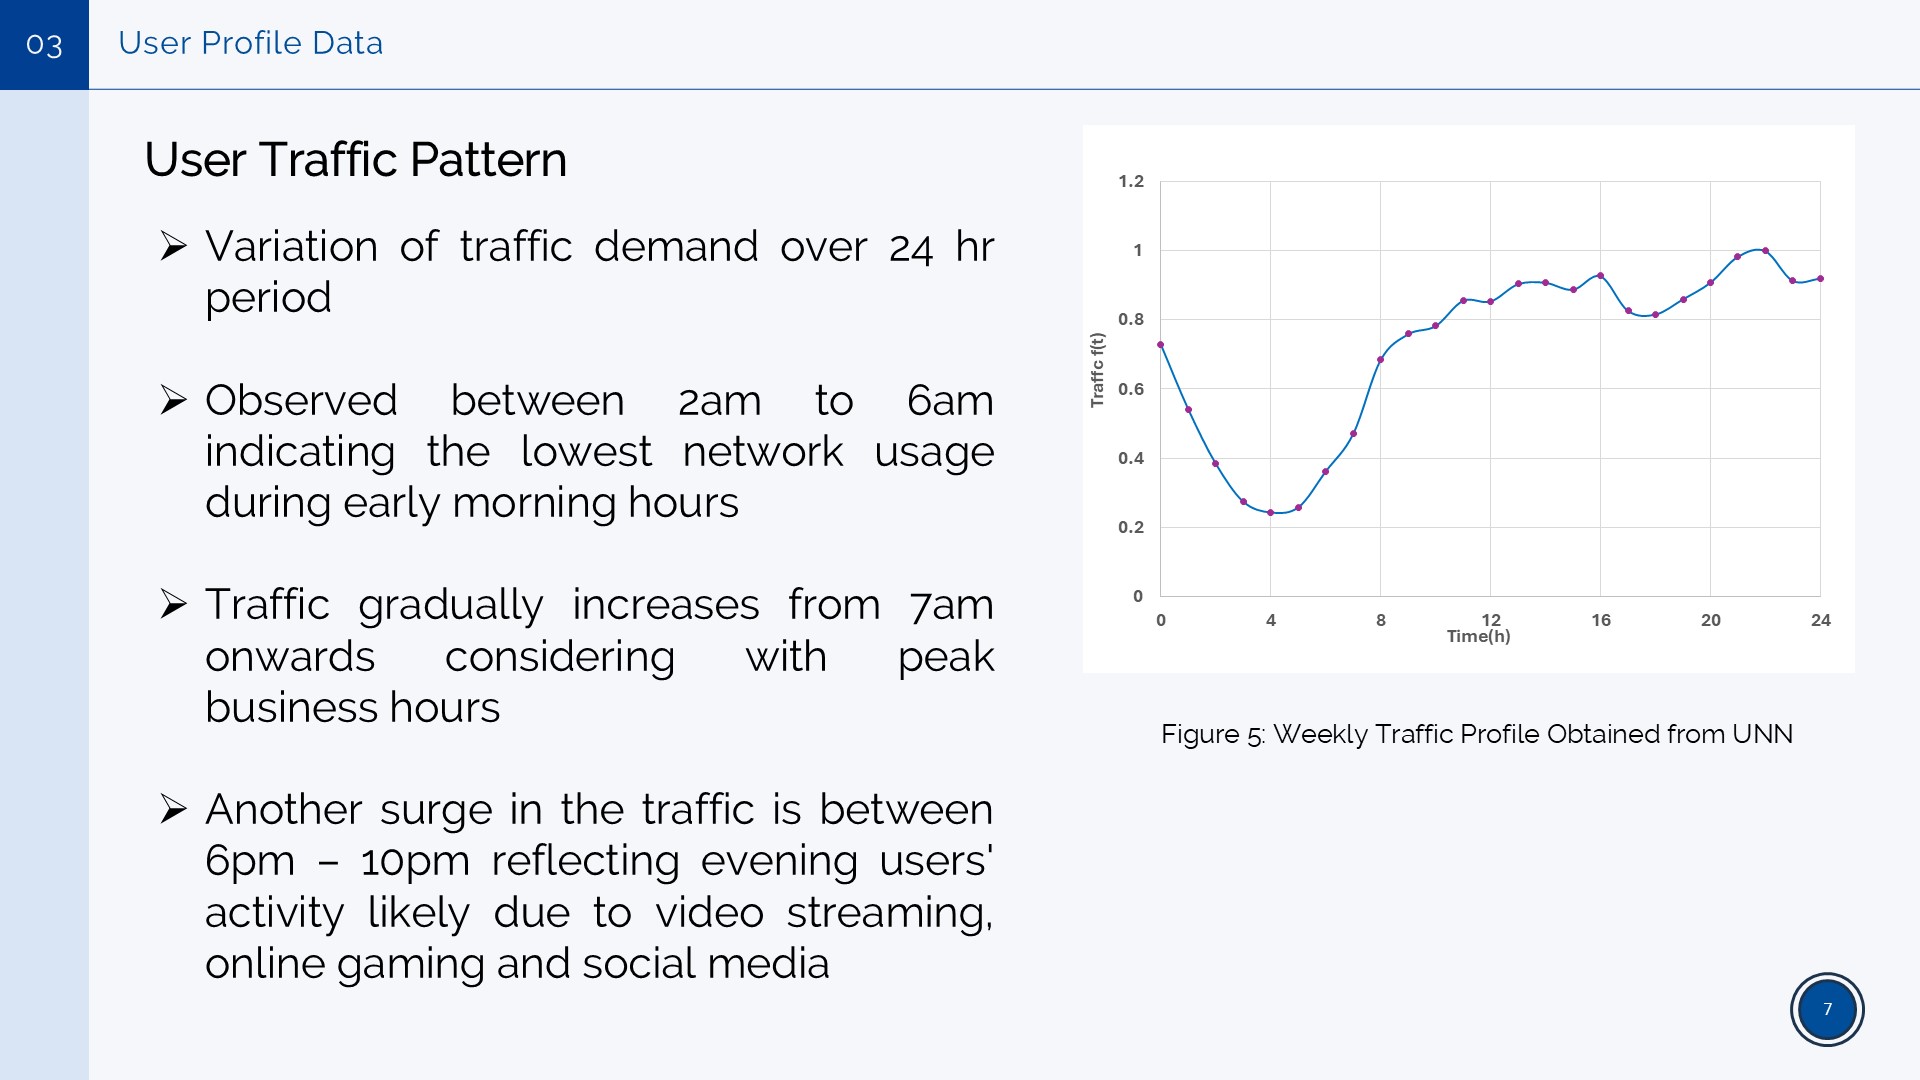 |
User Traffic Pattern.
Network traffic changes throughout the 24-hour period.
The lowest usage happens between 2 AM - 6 AM, when most users are inactive.
Traffic increases from 7 AM, highest during business hours.
Another traffic surge occurs between 6 PM - 10 PM, likely due to video streaming, gaming, and social media usage.
|
|
ICACT20250019 Slide.06
[Big slide for presentation]
|
Chrome Text-to-Speach Click!! |
 |
User Profile Data Collection.
The study evaluates energy efficiency in an integrated access network using data from Gadong, BSB.
Real network data from UNN was used.
Traffic data for one week was analyzed to understand usage patterns.
Data was adjusted based on the peak usage time, which usually happens around midnight.
Off-peak hours were identified to explore power-saving opportunities.
|
|
ICACT20250019 Slide.05
[Big slide for presentation]
|
Chrome Text-to-Speach Click!! |
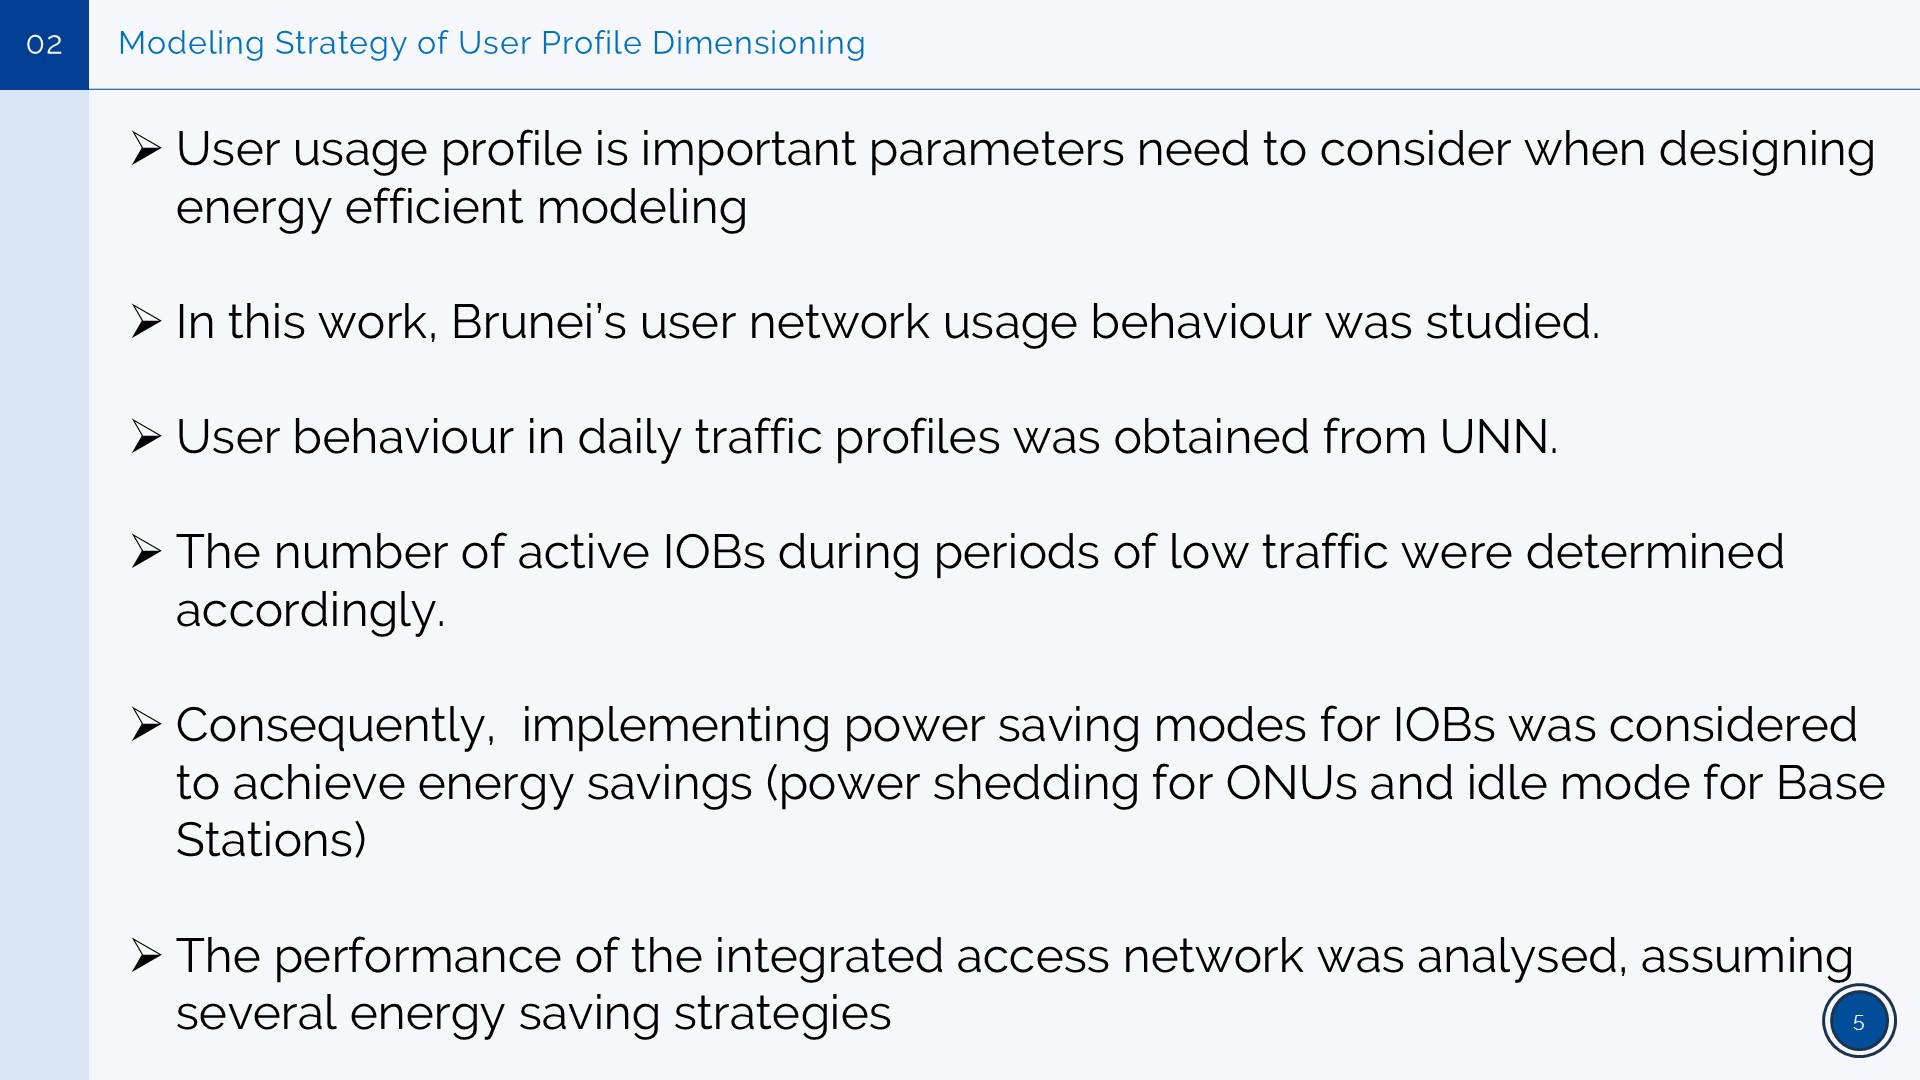 |
Modeling Strategy of User Profile Dimensioning.
Understanding user network usage is important for designing energy-efficient models.
This study focuses on Brunei’s network usage patterns using data from UNN.
User behavior in daily traffic profiles was analyzed to determine the number of active network components during low-traffic periods.
Power-saving modes were explored, such as reducing power using power shedding for ONUs and using idle mode for base stations.
The performance of the integrated access network was tested with different energy-saving strategies.
|
|
ICACT20250019 Slide.04
[Big slide for presentation]
|
Chrome Text-to-Speach Click!! |
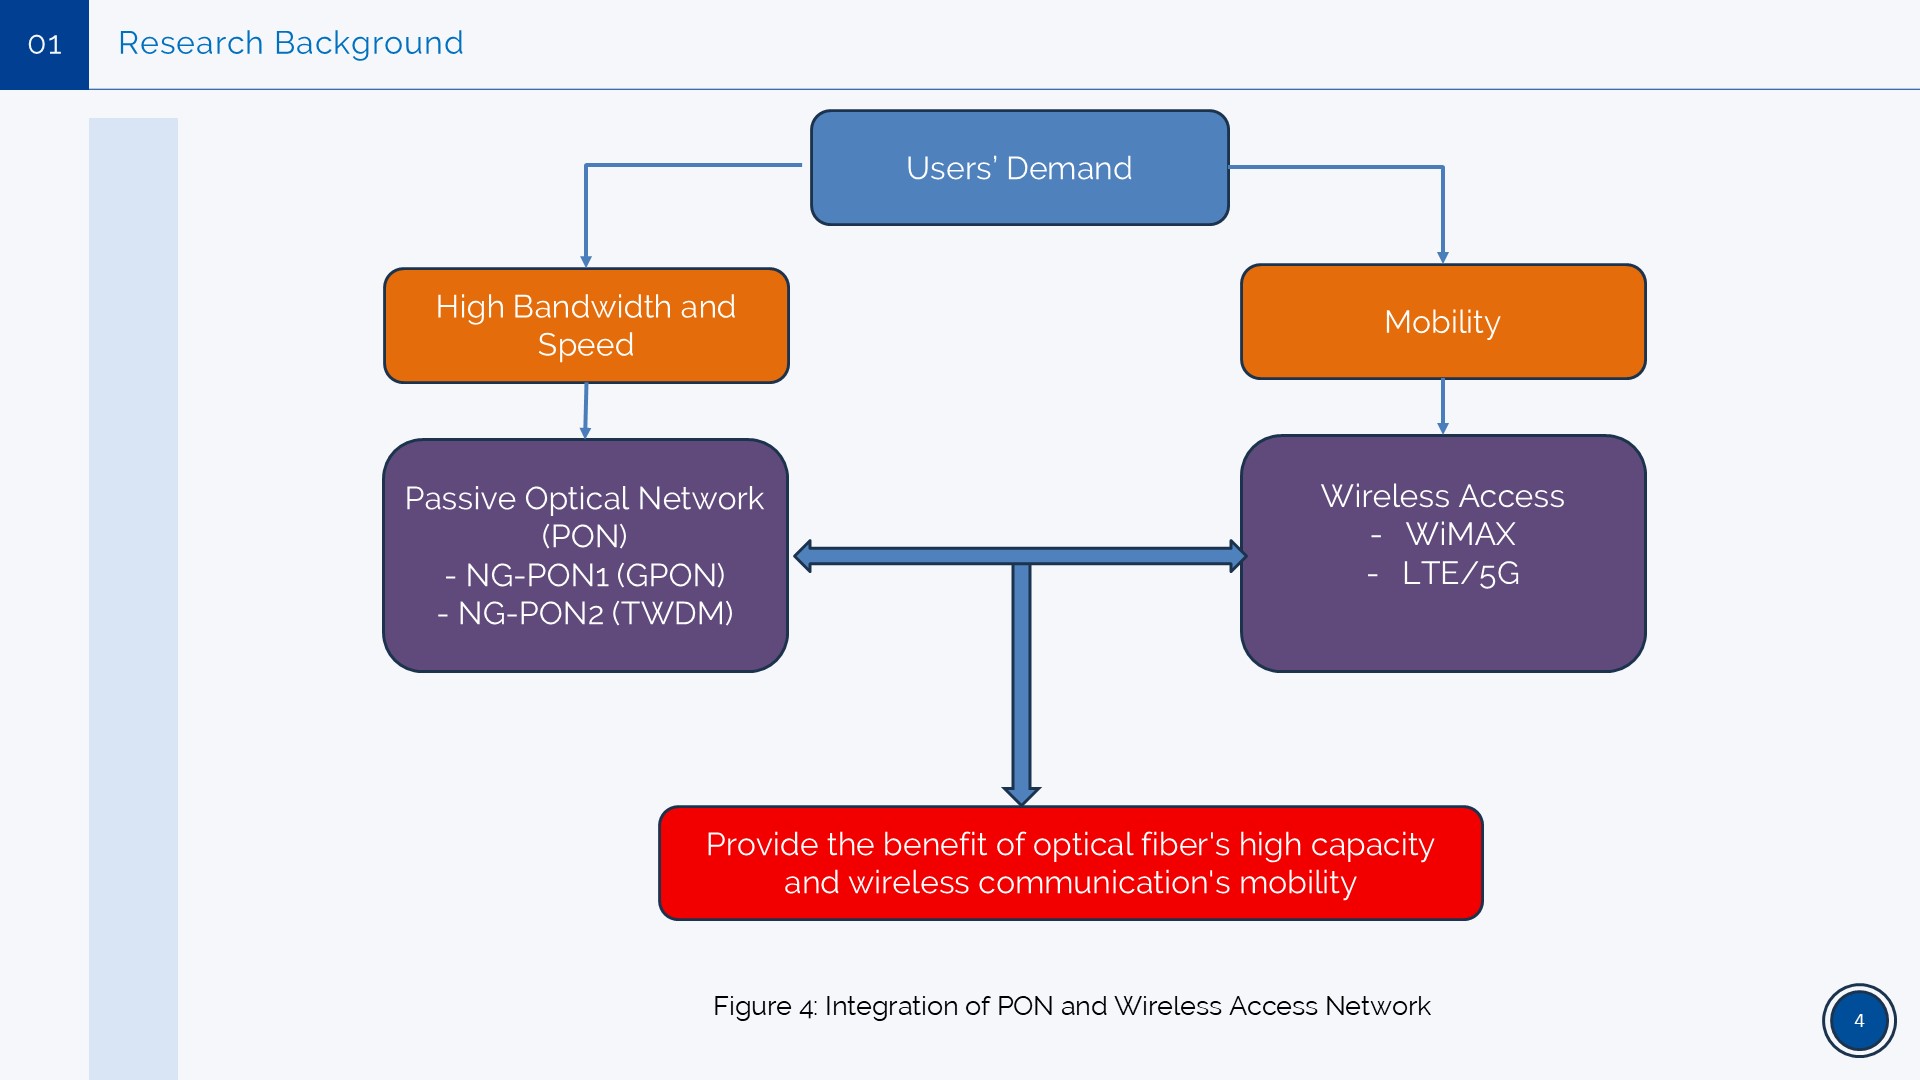 |
Integration of PON and Wireless Access Networks
Users' Demand drives the need for high bandwidth and speed as well as mobility in communication networks.
High bandwidth and speed are provided by Passive Optical Networks (PON), including NG-PON1 (GPON) and NG-PON2 (TWDM).
Mobility is supported by Wireless Access technologies such as WiMAX and LTE/5G.
Combining PON and wireless access brings the best for the high capacity of optical fiber and the mobility and flexibility of wireless communication
|
|
ICACT20250019 Slide.03
[Big slide for presentation]
|
Chrome Text-to-Speach Click!! |
 |
Research Background
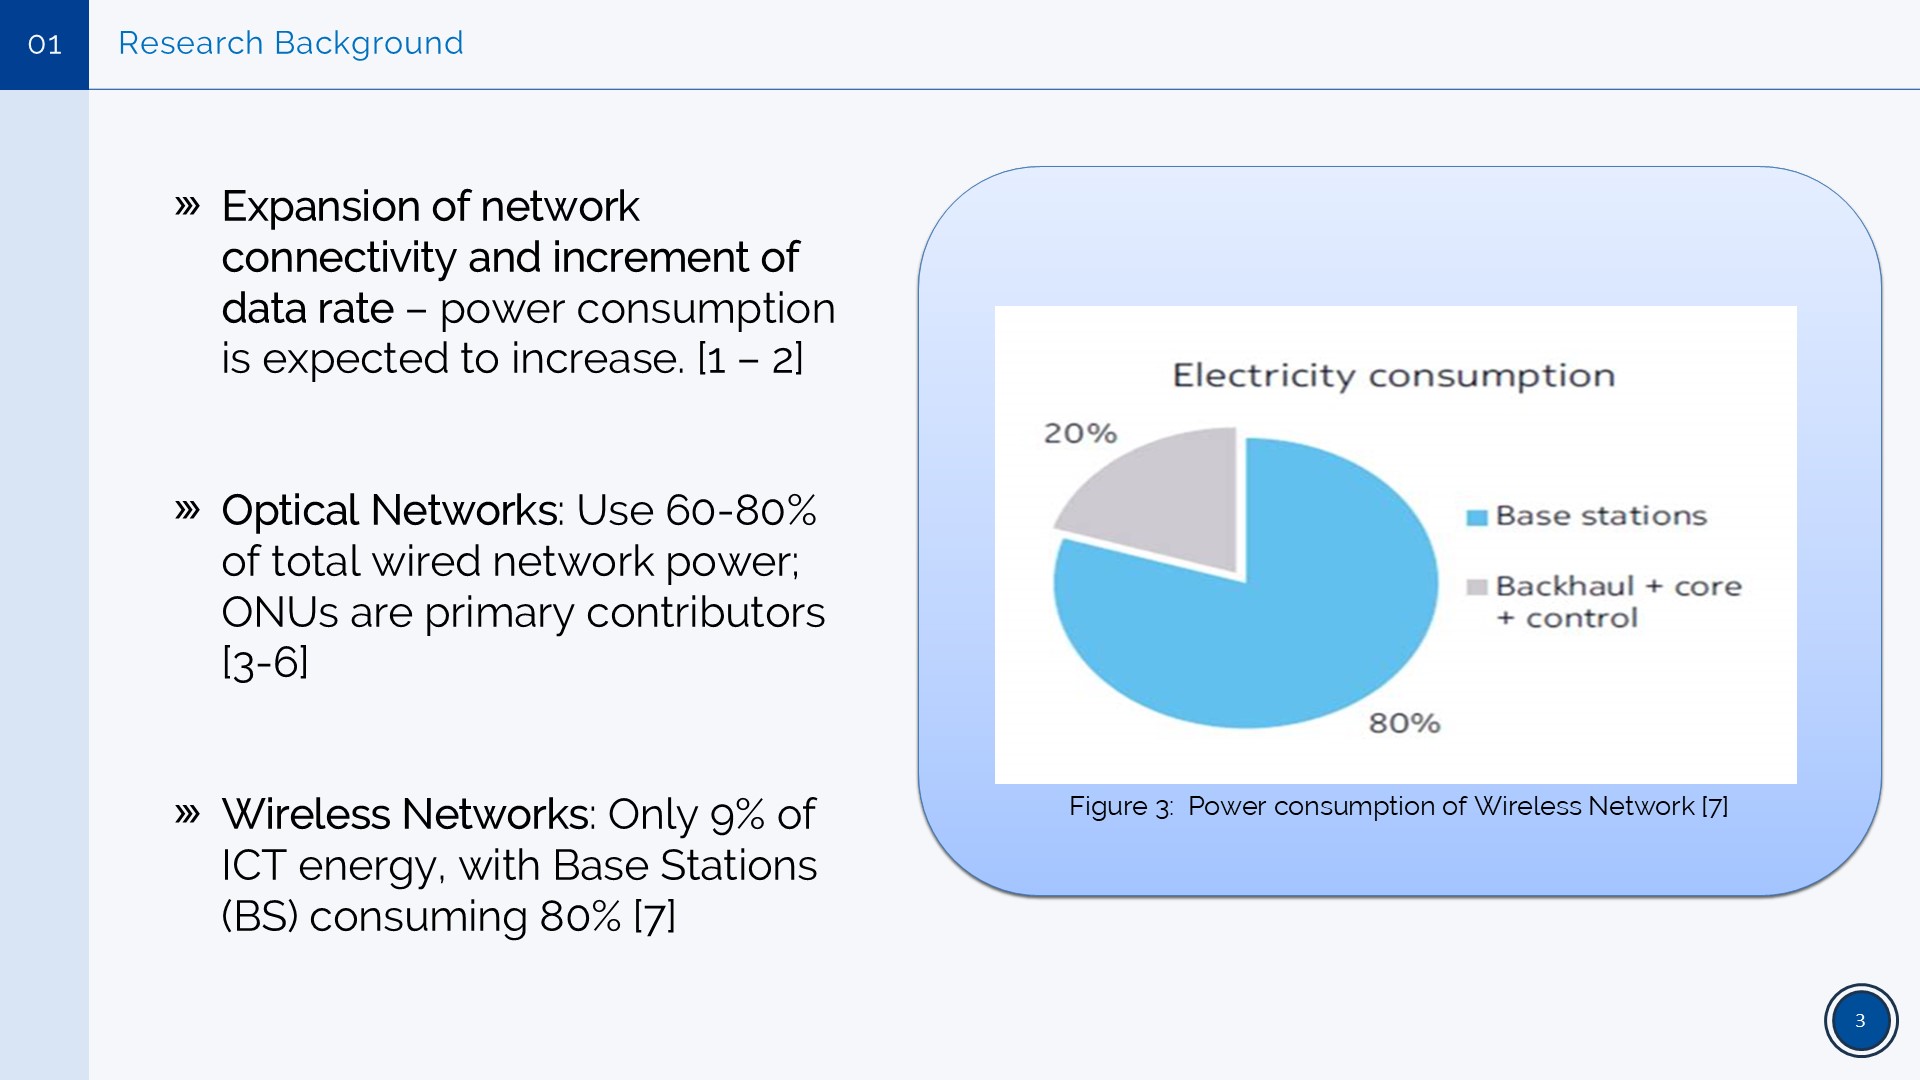
As network connectivity and data rates increase, power consumption is also expected to rise.
Optical Networks use a large portion (60-80%) of wired network power, mainly due to Optical Network Units (ONUs).
Wireless Networks consume only 9% of total ICT energy, but base stations account for 80% of that consumption.
The pie chart highlights that base stations are the main contributors to electricity usage in wireless networks.
|
|
ICACT20250019 Slide.02
[Big slide for presentation]
|
Chrome Text-to-Speach Click!! |
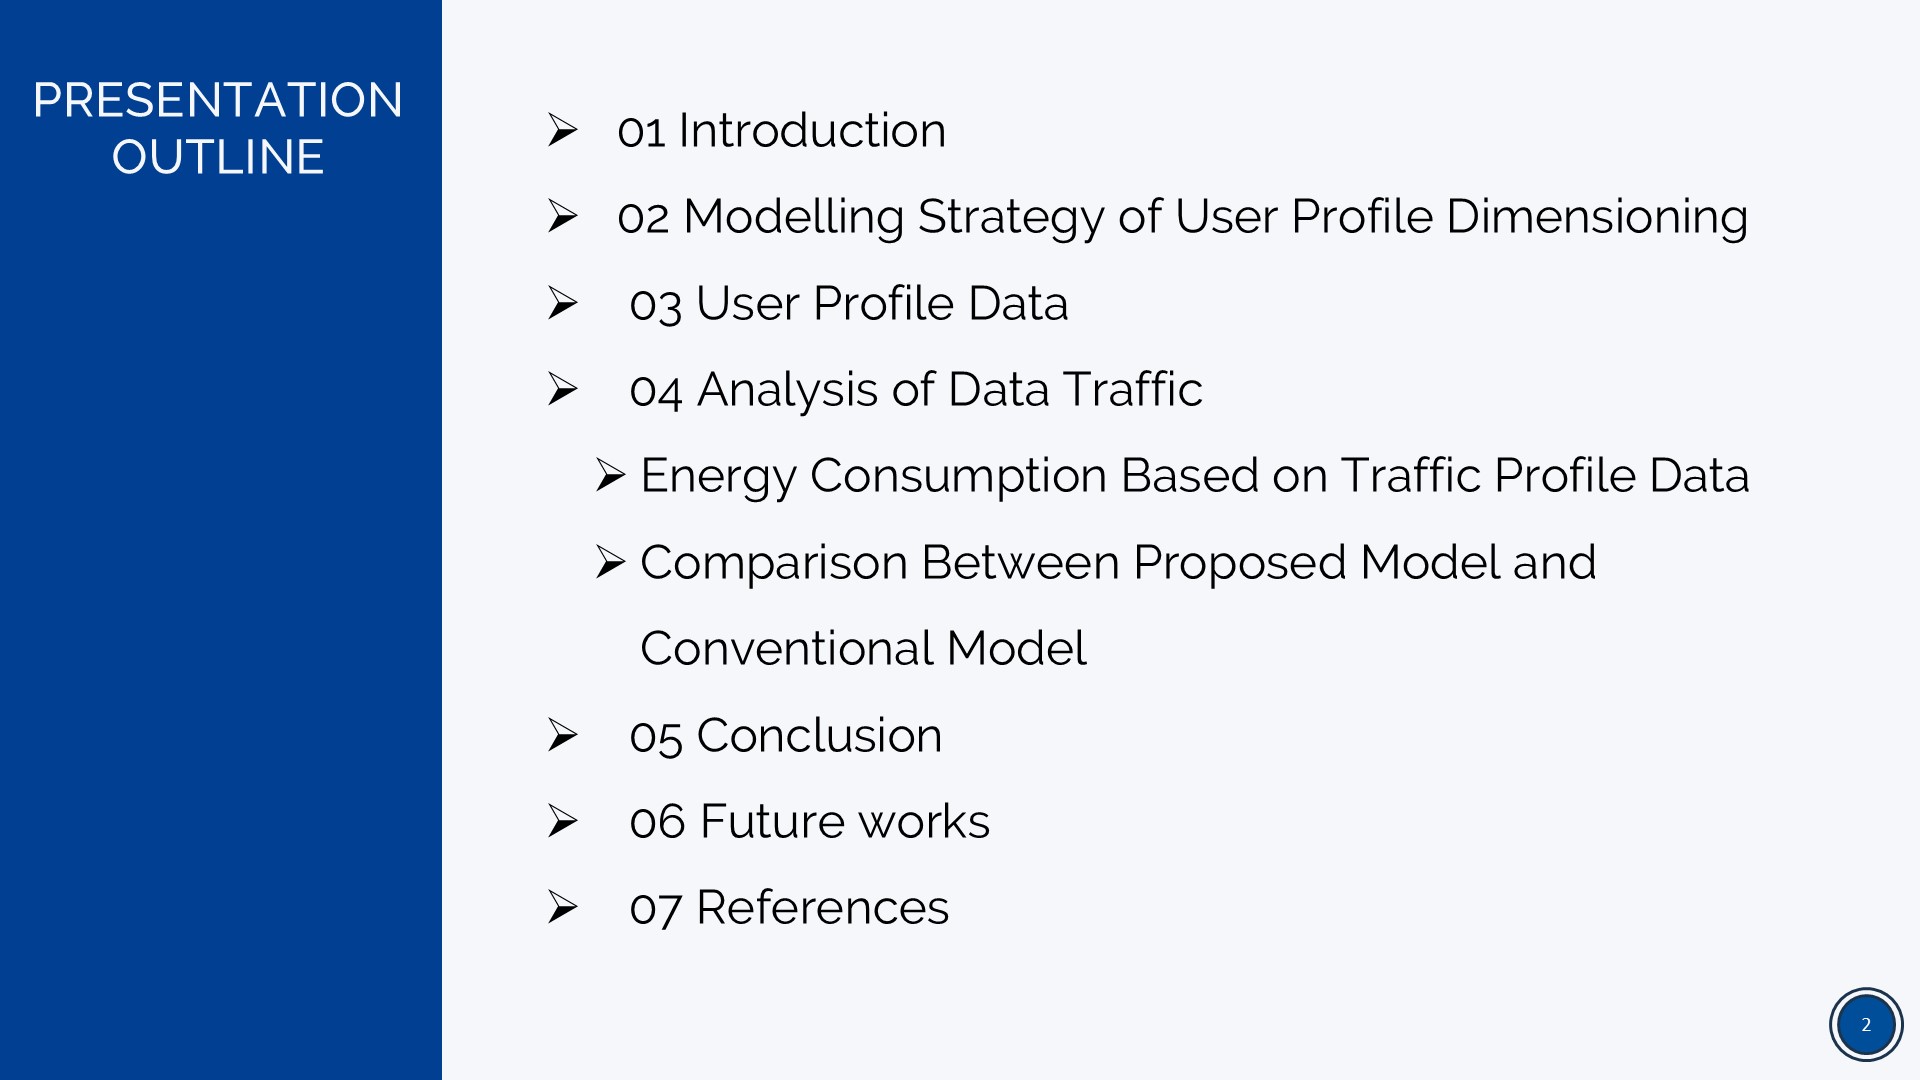 |
Before we start, let me give you a quick overview of what I’ll be covering today. First, I’ll begin with the Introduction, where I’ll explain the background and purpose of this research. Then, I’ll talk about the Modelling Strategy of User Profile dimensioning, which looks at how we define and structure user profiles. Next, I’ll discuss User Profile Data, which provides the necessary information for our analysis. After that, I’ll present the Analysis of Data Traffic, where I’ll examine how data moves across the network. I will also cover Energy Consumption Based on Traffic Profile Data, explaining how different traffic patterns affect energy usage. Then, I’ll compare our Proposed Model with the Conventional Model, showing the key differences and benefits of our approach. Finally, I’ll conclude with the Conclusion, discuss some ideas for Future Work, and briefly go over the References used in this study.
|
|
ICACT20250019 Slide.01
[Big slide for presentation]
|
Chrome Text-to-Speach Click!! |
 |
Good Morning Everyone.
I will be presenting a paper titled 'Power Saving Analysis in Integrated Optical and Wireless Access Network Using User Profile Dimensioning based on Brunei Network.
|
















