 ICACT20230034 Slide.19
[Big slide for presentation]
[YouTube] |
Chrome Text-to-Speach Click!! |
 |
Thank you very much for your attention,
Please let me know if there is any question
|
|
ICACT20230034 Slide.18
[Big slide for presentation]
[YouTube] |
Chrome Text-to-Speach Click!! |
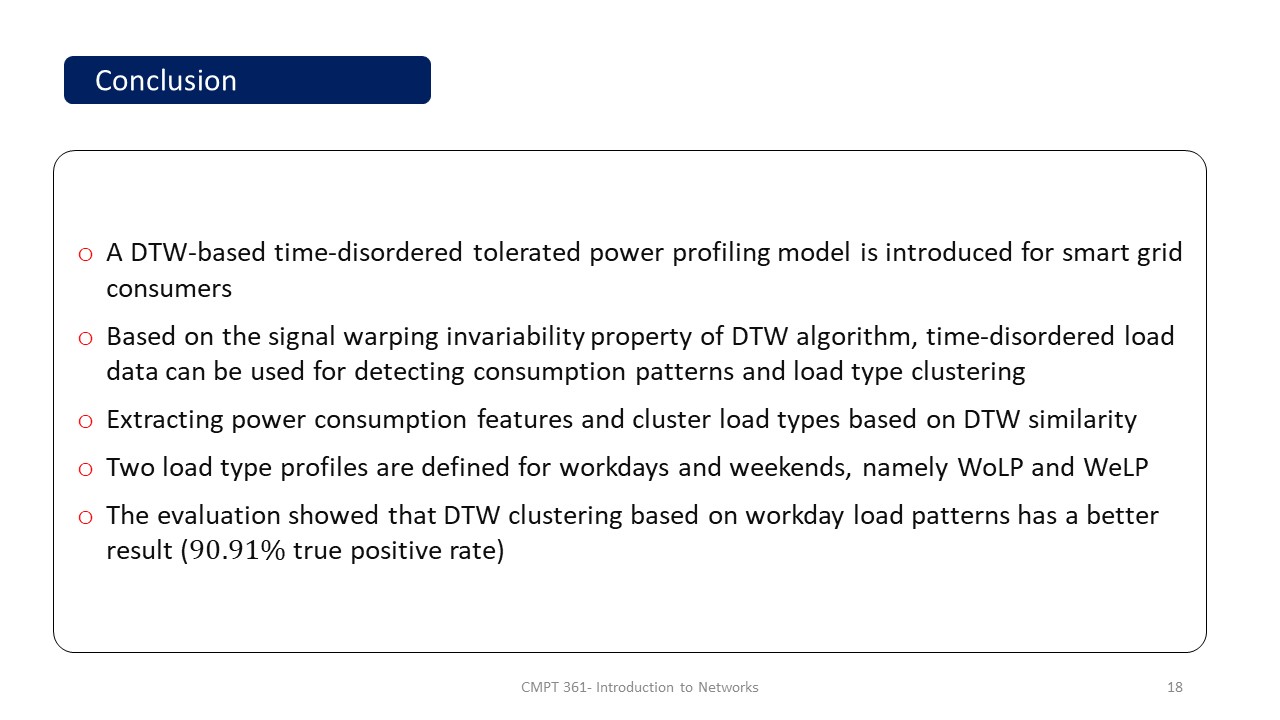 |
In this work, we introduced a time-disordered tolerated power profiling model for smart grid consumers,
It uses DTW algorithm to profile a consumer’s power consumption behaviour and analyzes the load data provided by smart meters,
Two load type profiles are defined for workdays and weekends, namely WoLP and WeLP,
The evaluation showed that DTW clustering based on workday load patterns has a better result,
This solution can be extended for power profiling several consumers based on their different appliances’ power consumption data time series,
For future, we plan to add daily load factor to each load profile to enhance the clustering accuracy,
|
|
ICACT20230034 Slide.17
[Big slide for presentation]
[YouTube] |
Chrome Text-to-Speach Click!! |
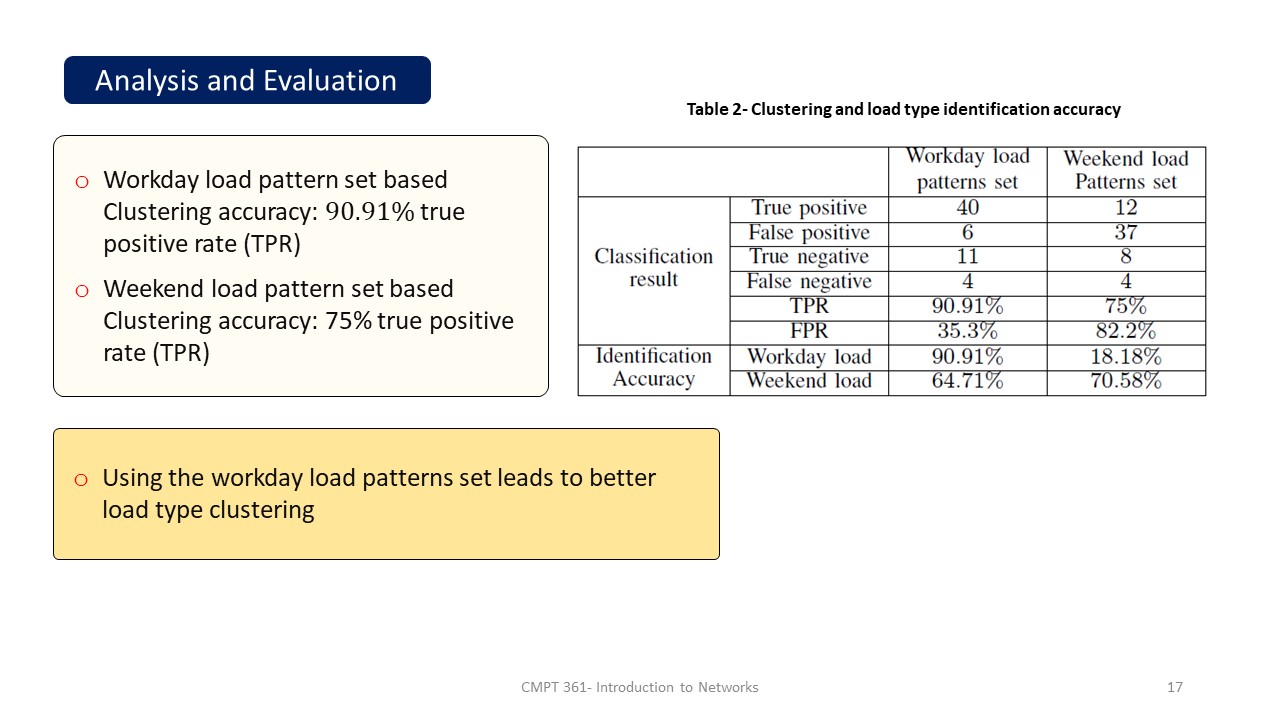 |
Our evaluation shows that using the workday load patterns set leads to better load type clustering,
Using this set to measuring Euclidean distance, it correctly identified 40 out of 44 workdays’ load type, with the true positive rate (TPR) of 90.91%,
|
|
ICACT20230034 Slide.16
[Big slide for presentation]
[YouTube] |
Chrome Text-to-Speach Click!! |
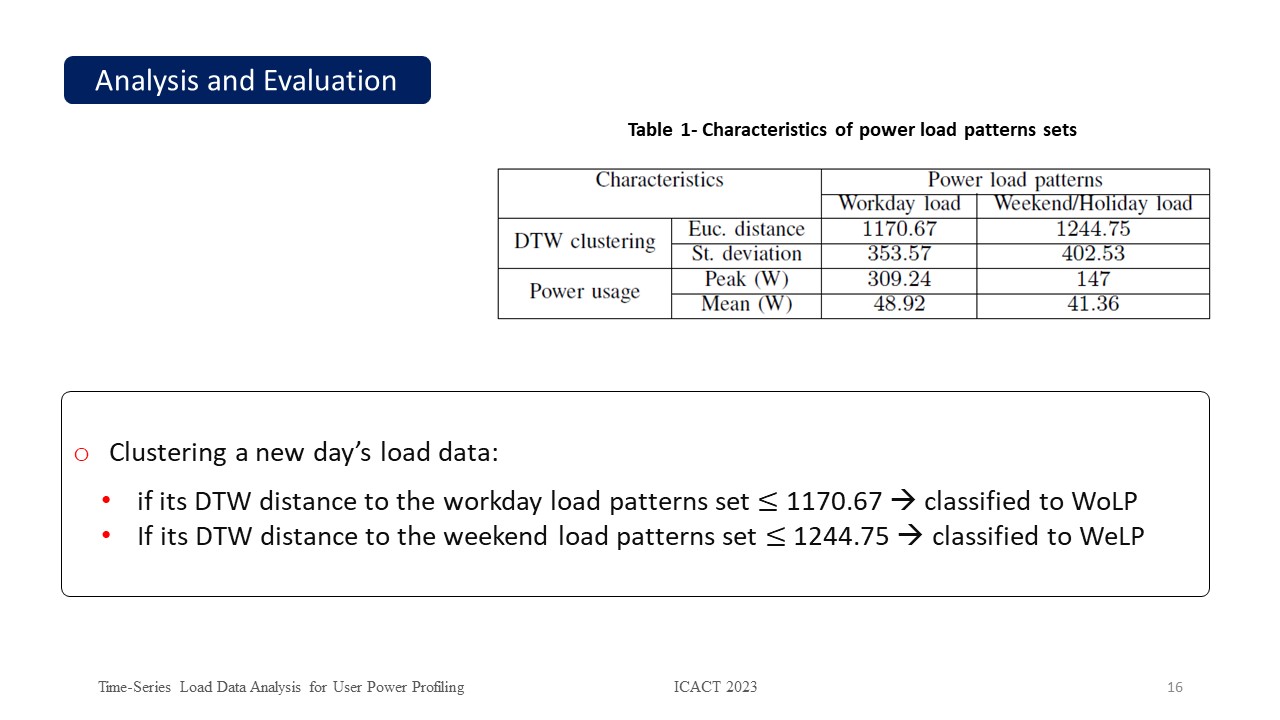 |
Based on our clustering: if the measured Euclidean distance to the workday load patterns set is less than 1170.67 the corresponding day is classified as a WoLP, else it is classified as a WeLP,
Similarly, it is classified as a WeLP if its power data time series’ distance to the weekend patterns set is less than 1244.75,
|
|
ICACT20230034 Slide.15
[Big slide for presentation]
[YouTube] |
Chrome Text-to-Speach Click!! |
 |
To evaluate our power profiling model, we analyze the time-disordered power usage data and identify the corresponding power load type,
Daily acquired power usage data of two sequent months is extracted from AMPd2,
These days totally include 61 days, namely 44 workdays and 17 weekends, both Saturdays and Sundays,
For each day, the similarities between its power data sequence and both power load patterns sets are measured by DTW,
Depends on the measured distance, a power profile (e.g., WoLP or WeLP) is assigned,
|
|
ICACT20230034 Slide.14
[Big slide for presentation]
[YouTube] |
Chrome Text-to-Speach Click!! |
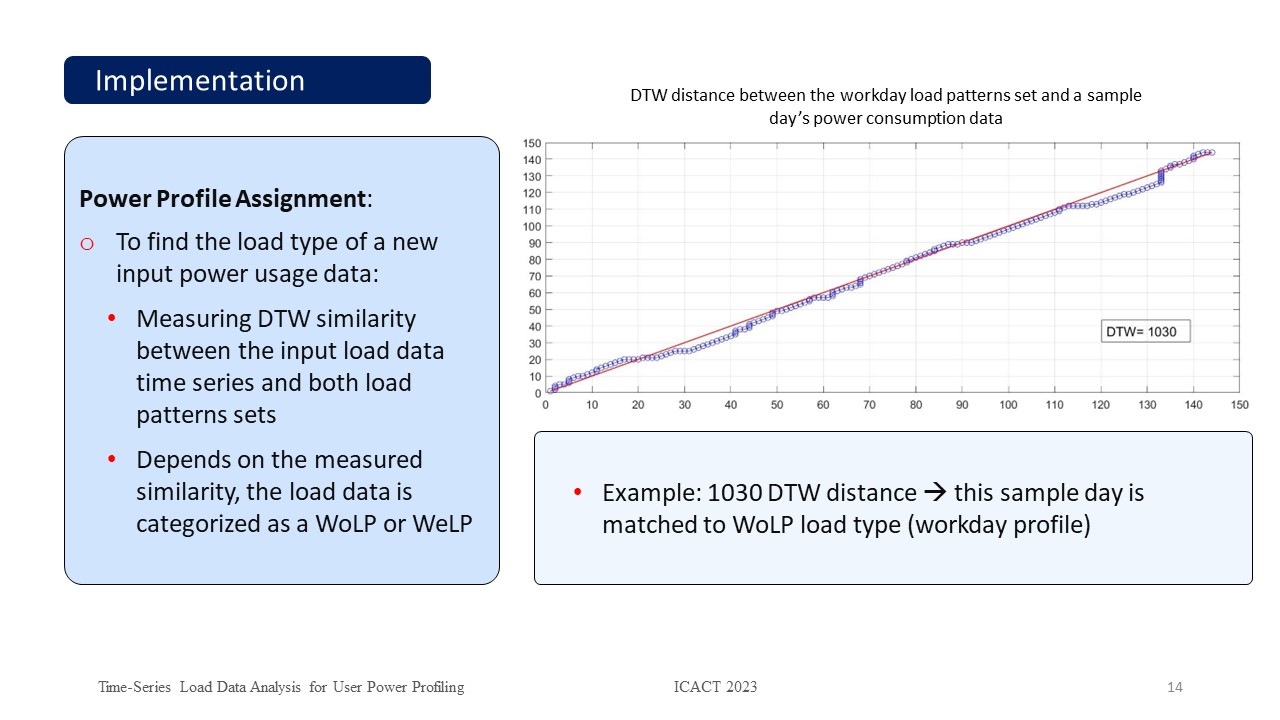 |
To profile any new input power usage data, we measure DTW similarity between this data points set and both load patterns sets of WoLP and WeLP,
Depends on the measured similarity, the load data is categorized
This figure shows DTW distance, warp path, and the straight-line fit between the load data points of the refrigerator measured on a sample day and the load data sequences of the predefined workday,
In this example, there is 1030 DTW distance between these load data points sets and this sample day is matched to WoLP load type and is profiled as a workday,
|
|
ICACT20230034 Slide.13
[Big slide for presentation]
[YouTube] |
Chrome Text-to-Speach Click!! |
 |
Since the refrigerator continuously works, we use its power consumption pattern to profile user’s power consumption
and identify his/her usage behaviour,
We use the power data points of the refrigerator in three months to train our model and extract the patterns,
Workdays and weekends/holidays are categorized into two separate categories and for each category, the similarity between the power usage time series of each day and the other days’ is measured by DTW,
Two profiles are defined for these load types based on the DTW matrix, namely workday load profile (WoLP) and
weekend/holiday load profile (WeLP),
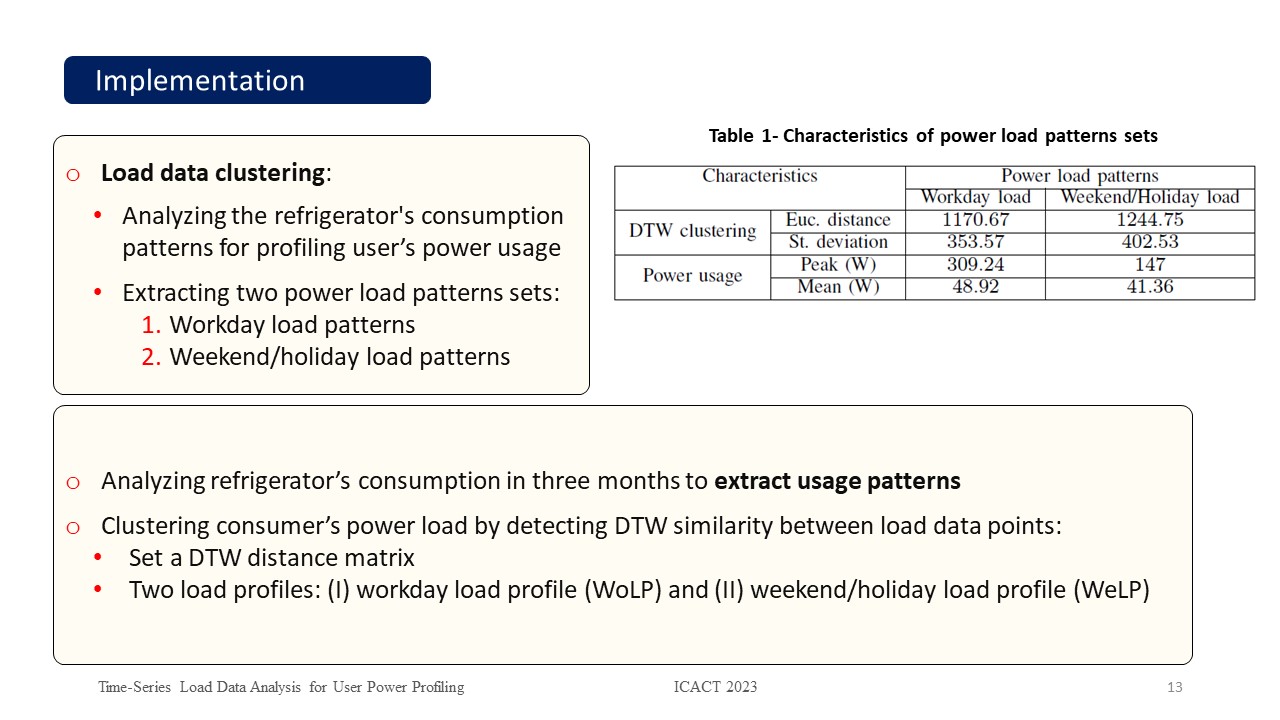
For each profile, a set of usage time series is extracted, in which has minimum Euclidean distance to other days’ load data at the same category,
As shown in Table 1, in workday profile, the extracted load patterns set averagely has 1170.67 DTW distance to other load data time series and the load patterns set in weekend profile has 1244.75 DTW distance to other load data time series,
|
|
ICACT20230034 Slide.12
[Big slide for presentation]
[YouTube] |
Chrome Text-to-Speach Click!! |
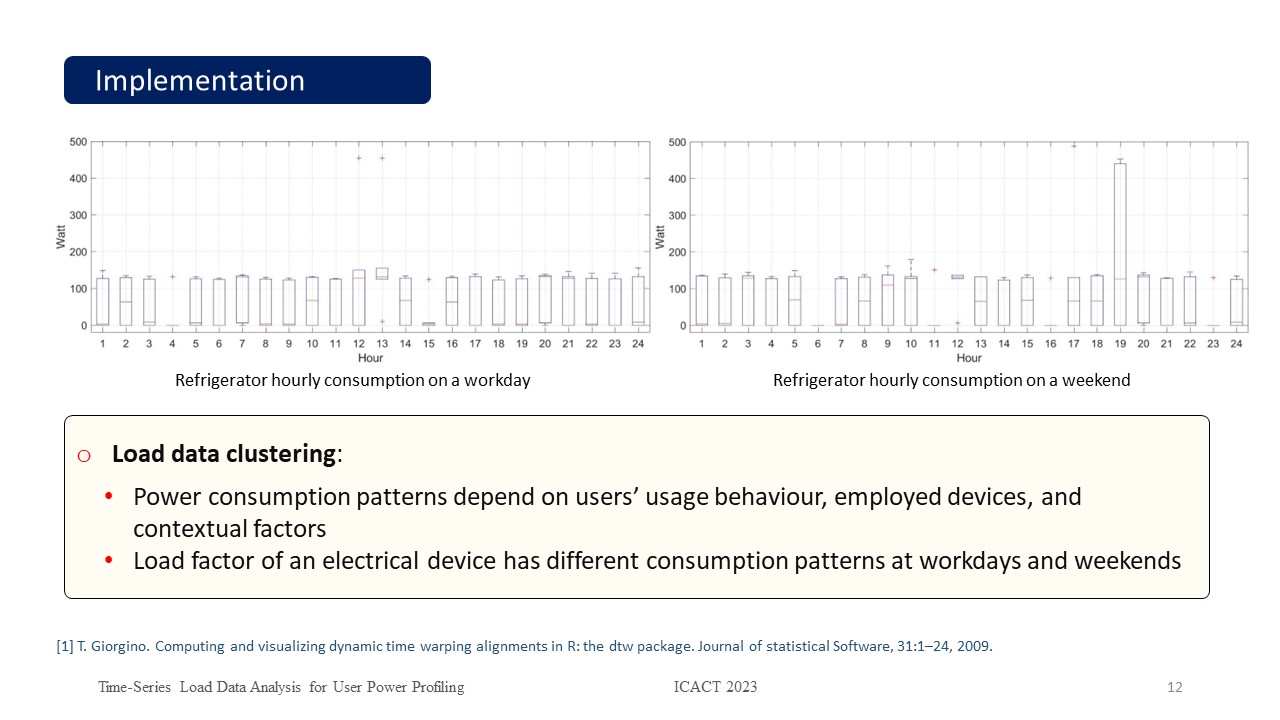 |
Consumers consume differently depending on the time of day and day of week,
For instance, the load factor of a refrigerator is influenced by its consumption patterns, which depend on factors such as thermal load, number of door openings, and opening duration,
It shows different patterns on workdays in comparison to weekends,
we select the refrigerator as the source for profiling and evaluate its power consumption to monitor the consumer’s power behaviour
|
|
ICACT20230034 Slide.11
[Big slide for presentation]
[YouTube] |
Chrome Text-to-Speach Click!! |
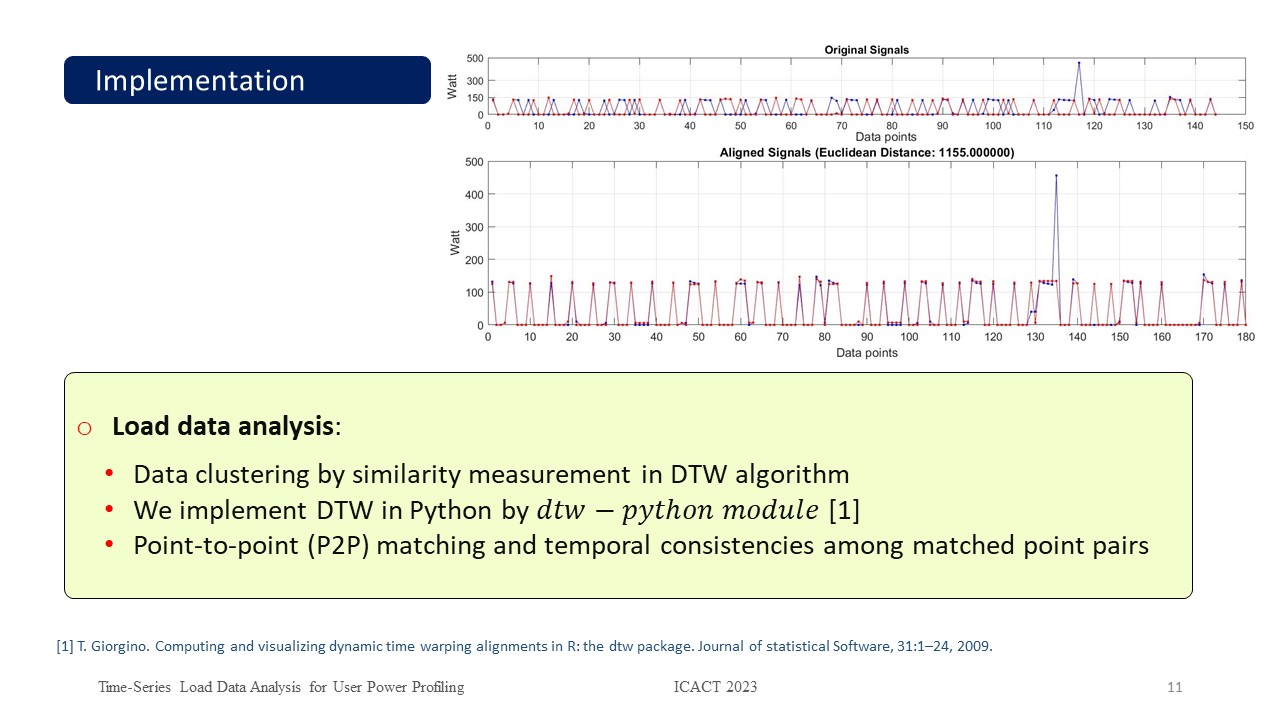 |
Power consumption patterns are extracted according to load data time series’ similarities determined by DTW algorithm,
We use dtw−python module to implement DTW in Python,
This figure shows DTW time alignment and similarity measurement between two load data time series with 144 data points,
As shown, two signals are aligned and matched by checking the similarity of their data points based on the DTW
|
|
ICACT20230034 Slide.10
[Big slide for presentation]
[YouTube] |
Chrome Text-to-Speach Click!! |
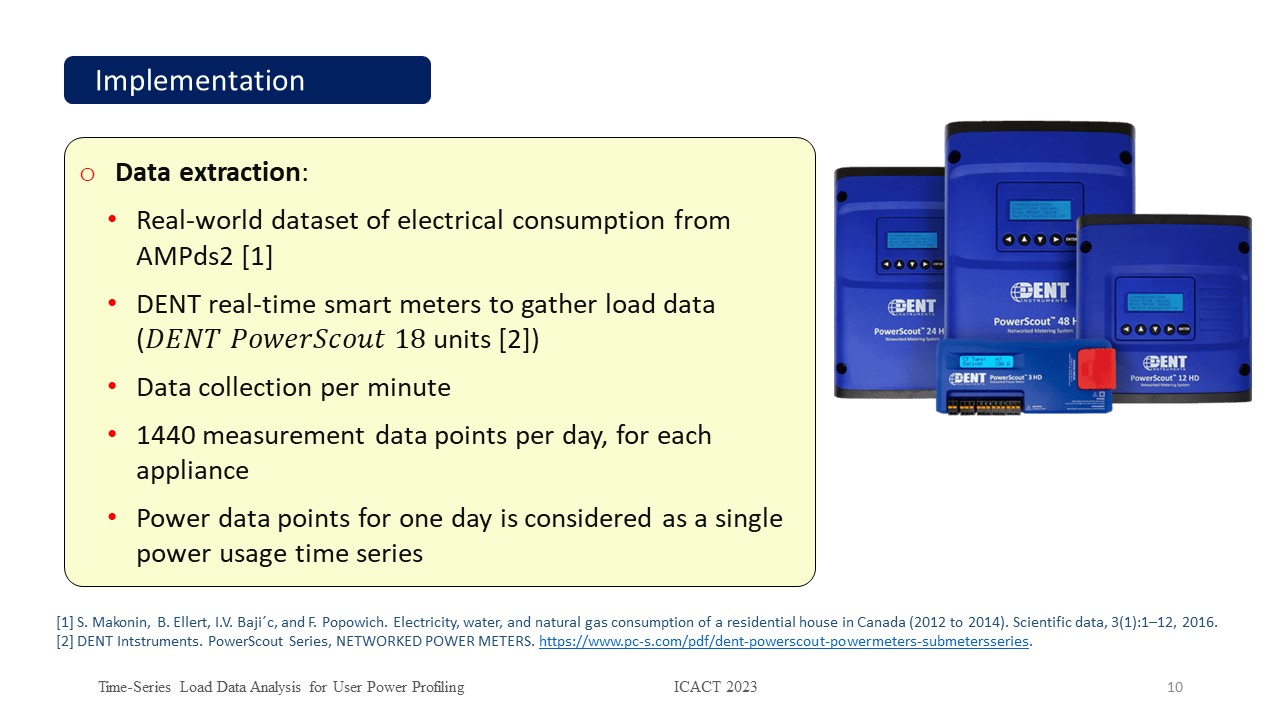 |
We use a real-world dataset of electrical consumption from AMPds2, which includes real load data of different electrical appliances collected over a long time,
DENT real-time smart meters were used to gather short-term power usage data,
DENT PowerScout 18 units, located at the electrical circuit breaker panel, collected appliances’ load data by every one minute
Each smart meter generates 1440 measurement data points per day, for each appliance,
To have a manageable size of data, we select power usage data collected every 10 minutes giving 144 acquisition data points per day
|
|
ICACT20230034 Slide.09
[Big slide for presentation]
[YouTube] |
Chrome Text-to-Speach Click!! |
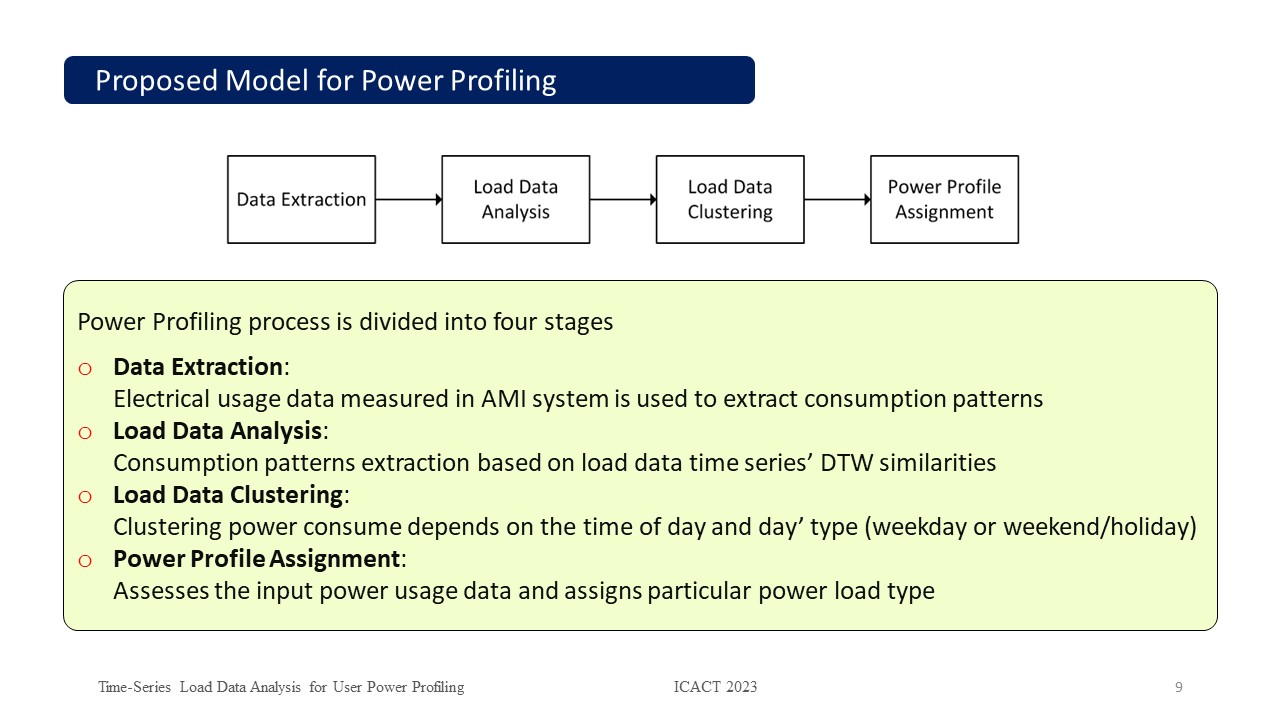 |
For power profiling, the consumer’s load data provided by AMI system is used to extract the required features,
Power consumption is profiled by comparing the time series of the consumer’s load data and observing the consumption patterns in the short-time (one-day) and by analyzing its load factor in the long-term,
Our profiling is done in four stages, namely Data Extraction, Load Data Analysis, Load Data Clustering, and Power Profile Assignment
|
|
ICACT20230034 Slide.08
[Big slide for presentation]
[YouTube] |
Chrome Text-to-Speach Click!! |
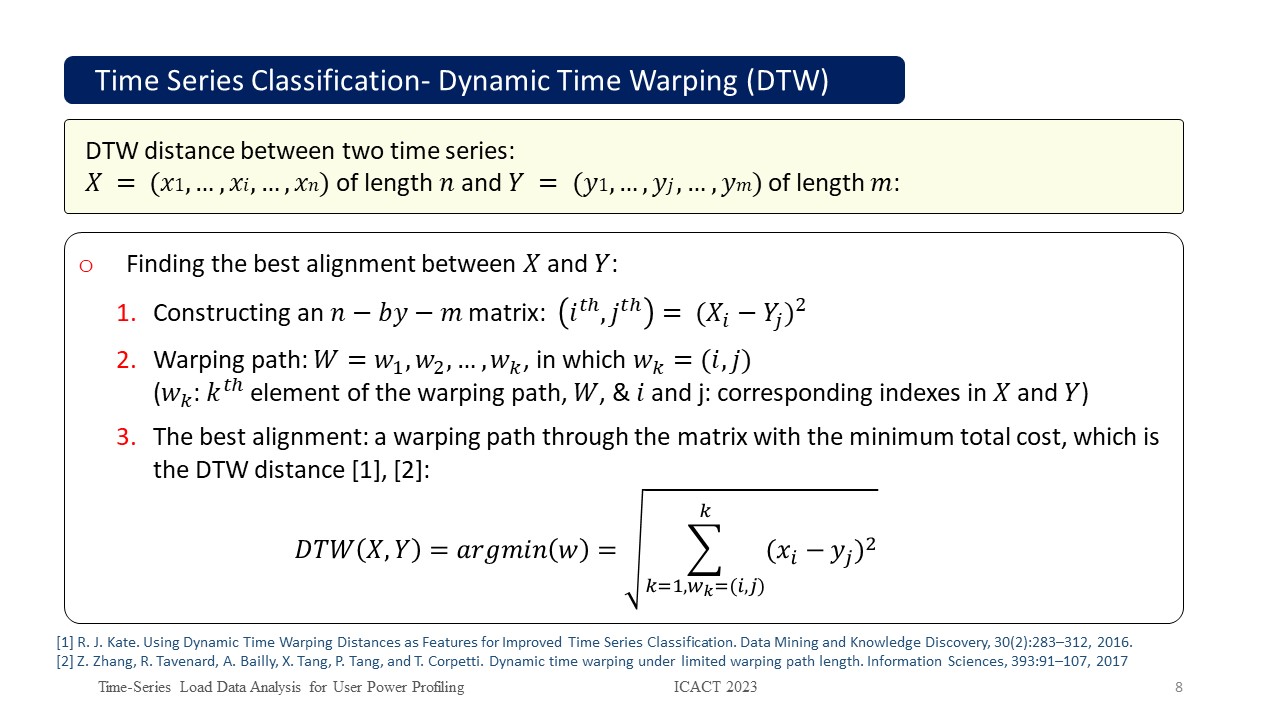 |
To find the distance between two time series, X and Y with length n and m respectively, DTW is computed by first finding the best alignment between them
An n-by-m matrix is constructed
An alignment between the two series is represented by a warping path, W,
The best alignment is given by a warping path through the matrix that minimizes the total cost of aligning its points and
The minimum total cost is the DTW distance as shown
|
|
ICACT20230034 Slide.07
[Big slide for presentation]
[YouTube] |
Chrome Text-to-Speach Click!! |
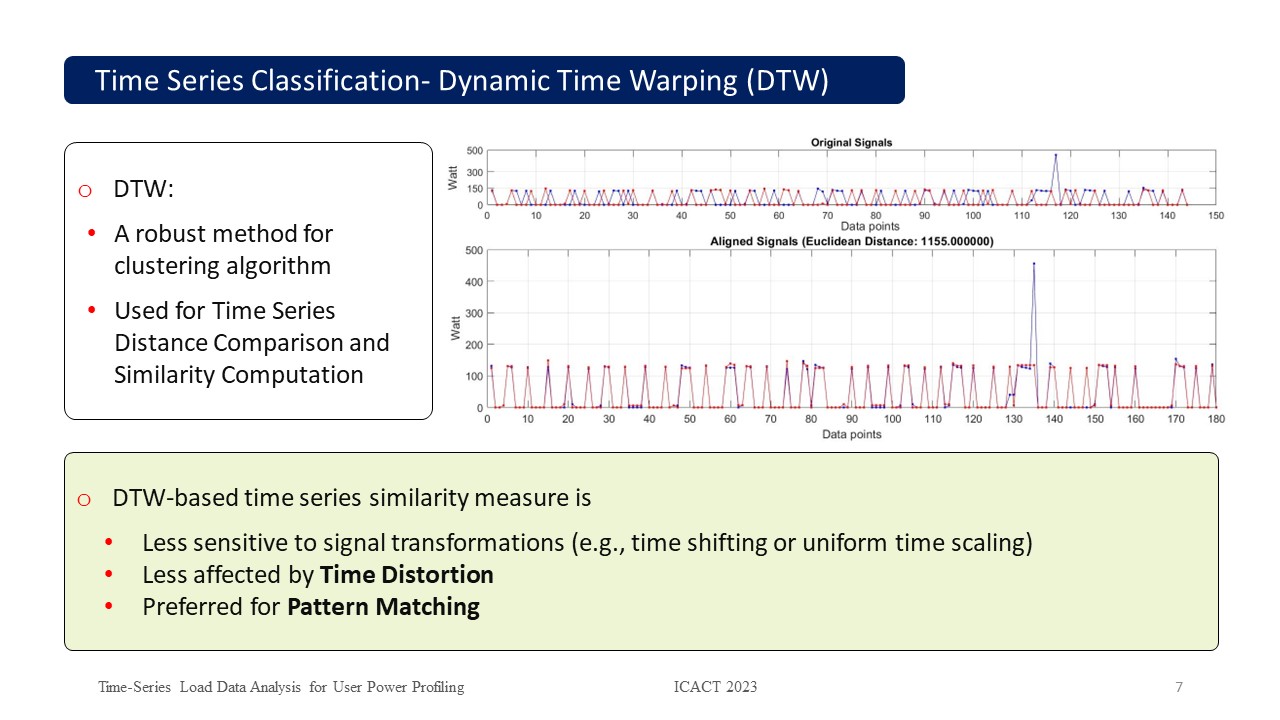 |
DTW is a very popular tool in temporal data mining, and distance comparison It is less sensitive to signal transformations such as shifting, uniform amplitude scaling, or uniform time scaling
DTW-based time series similarity measures are less affected by time distortion It allows elastic transformation of time series to detect similar shapes with different phases
Due to being invariant against signal warping, DTW is Preferred for pattern matching
|
|
ICACT20230034 Slide.06
[Big slide for presentation]
[YouTube] |
Chrome Text-to-Speach Click!! |
 |
Power profiling includes analytical approaches which lead to predictive maintenance, abnormality, and fault detection
While most consumers show variable power consumption behavior, they typically exhibit a certain amount of repetitiveness
A consumer’s consumption behaviour is affected by his/her social, professional, and economic situations, appliances used, time, and environment, e.g., weather and dwelling
|
|
ICACT20230034 Slide.05
[Big slide for presentation]
[YouTube] |
Chrome Text-to-Speach Click!! |
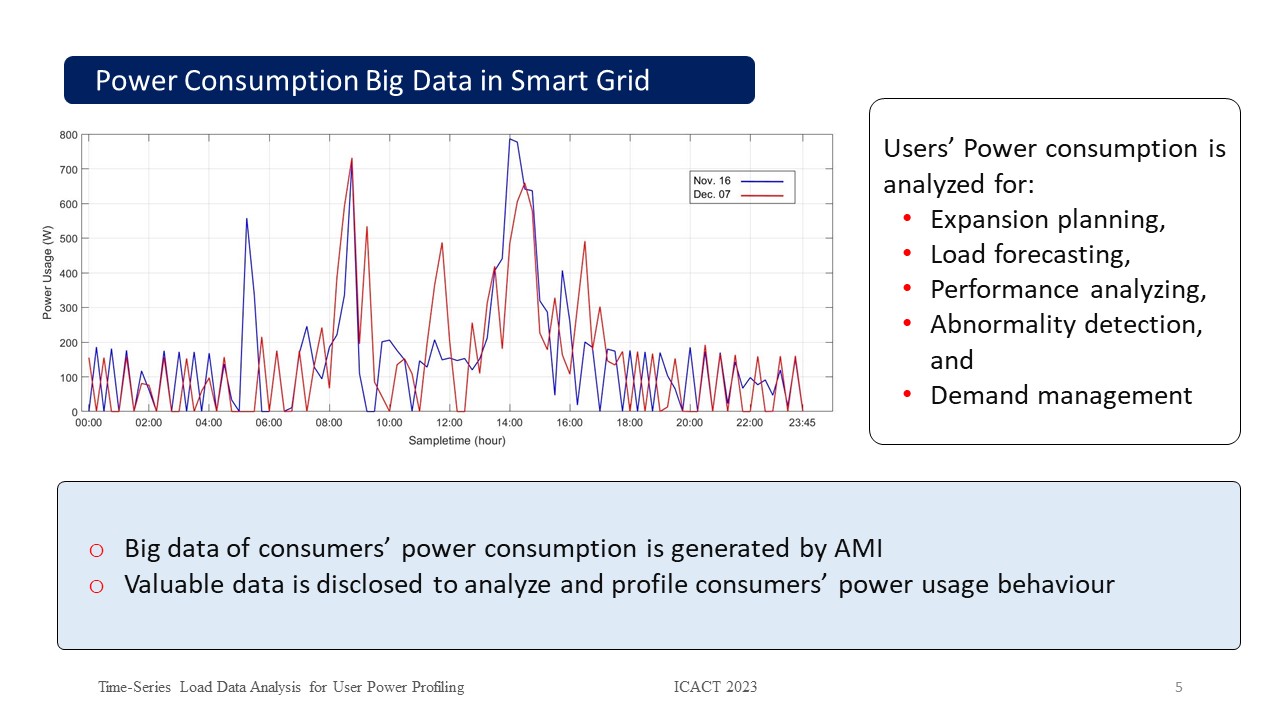 |
Power consumption is an important variable for expansion planning, load forecasting, performance analyzing, and demand management in smart grid Analyzing consumer’s power consumption behaviour, known as power profiling, is needed for demand forecasting and optimizing resource allocation
|
|
ICACT20230034 Slide.04
[Big slide for presentation]
[YouTube] |
Chrome Text-to-Speach Click!! |
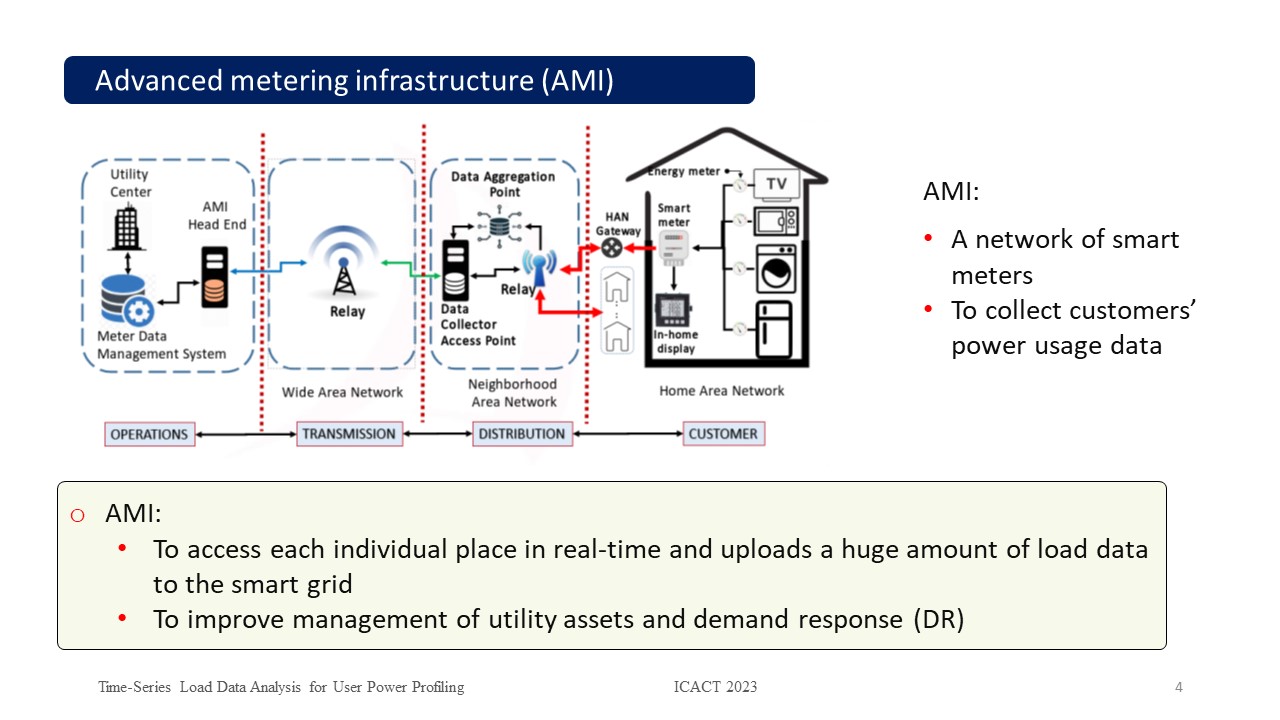 |
Advanced metering infrastructure (AMI), as a core technology, provides bidirectional information flow between utility provider and consumers
It accesses each individual place in real-time and uploads a huge amount of data to the smart grid
It helps to improve utility assets management as well as demand response (DR) systems
|
|
ICACT20230034 Slide.03
[Big slide for presentation]
[YouTube] |
Chrome Text-to-Speach Click!! |
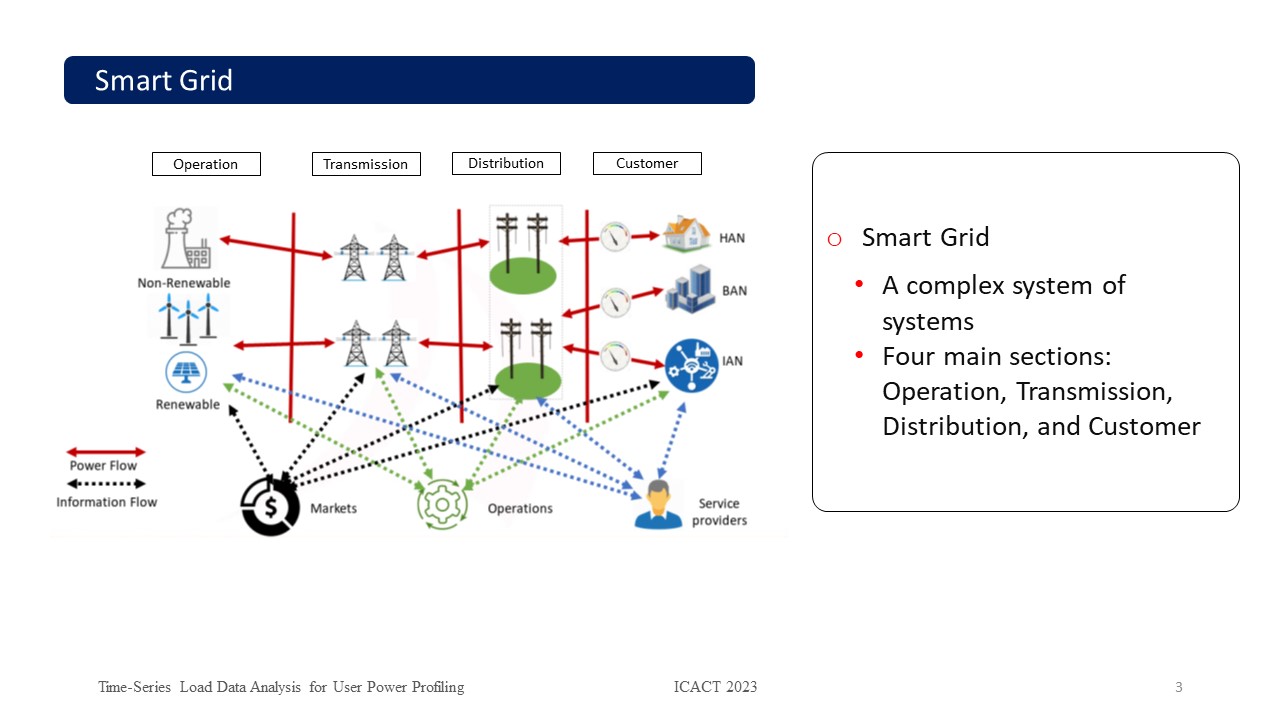 |
Smart Grid is a system of systems
It includes two networks, namely information flow, managed by market, operations, and service providers domains,
and two-way electrical flows across power generation, transmission, distribution, and customer
|
|
ICACT20230034 Slide.02
[Big slide for presentation]
[YouTube] |
Chrome Text-to-Speach Click!! |
 |
This presentation includes:
Reviewing Power Consumption Big Data in Smart Grid,
Reviewing Dynamic Time Warping (DTW), a Time Series Classification,
Introducing our Users Power Profiling model,
Analyzing Time-Series Load Data, and Conclusion
|
|
ICACT20230034 Slide.01
[Big slide for presentation]
[YouTube] |
Chrome Text-to-Speach Click!! |
 |
Hi, I am Mahdi Firoozjaei, from University of Windsor
In this presentation, I present one of our current work in smart grid, Time-Series Load Data Analysis for User Power Profiling
In this work, my colleagues, Minchang Kim from ETRI, and Dima Alhadidi from University of Windsor helped me to introduce a power profiling method for smart grid users
|
















