 ICACT20230194 Slide.16
[Big slide for presentation] |
Chrome Text-to-Speach Click!! |
 |
Thank you very much for your attention. You are most welcome to ask any comments or questions about the presentation. I would be happy to clarify best of my ability. Thank you once again. Kia Ora
|
|
ICACT20230194 Slide.15
[Big slide for presentation]
|
Chrome Text-to-Speach Click!! |
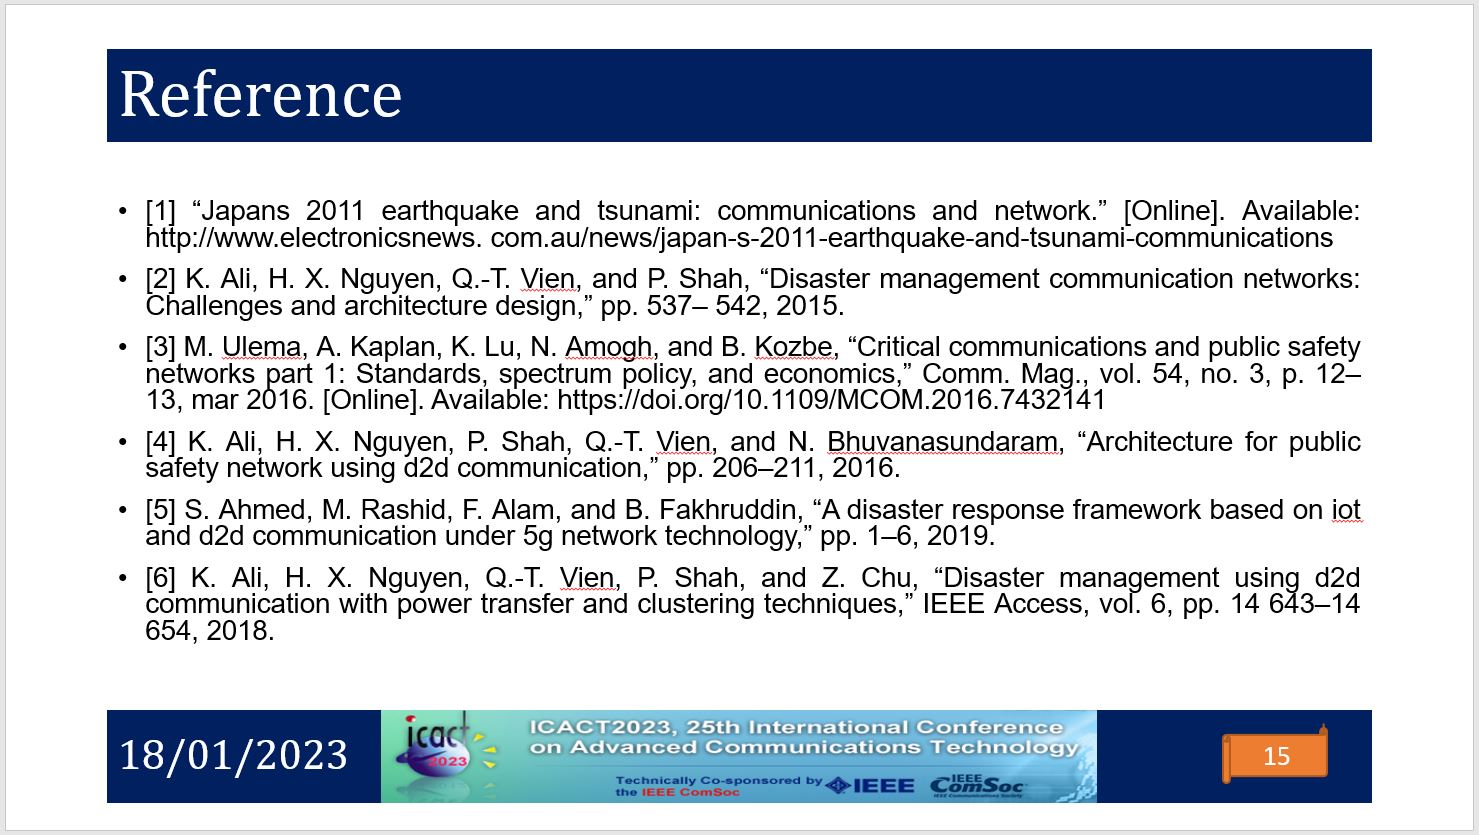 |
This slide shows some of the references which are used for the paper.
|
|
ICACT20230194 Slide.14
[Big slide for presentation]
|
Chrome Text-to-Speach Click!! |
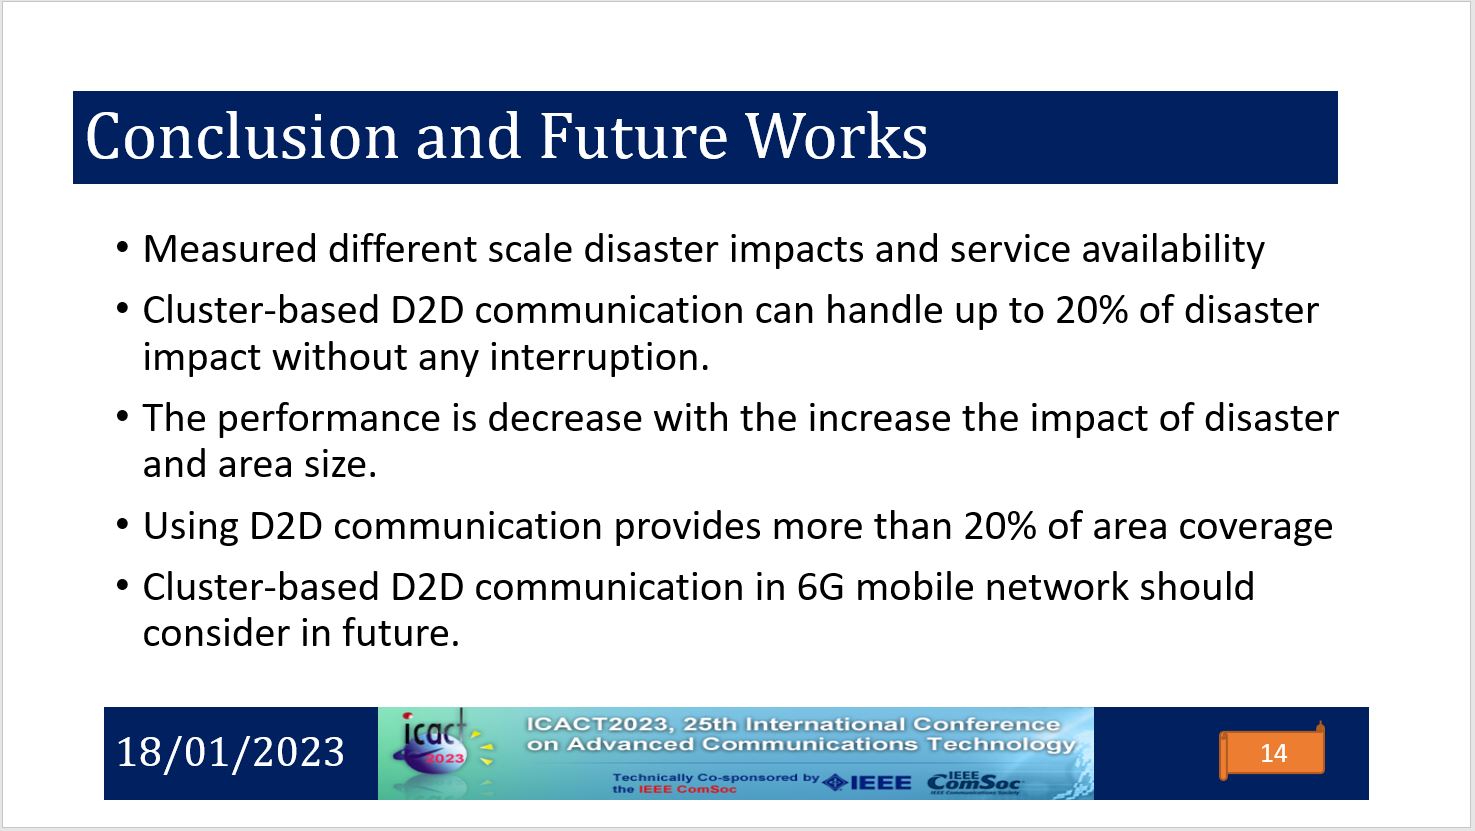 |
This slide concludes the presentation. It summarises the analysis result to use cluster-based D2D communication in a disaster situation. Measured different scale disaster impacts and service availability
Cluster-based D2D communication can handle up to 20% of disaster impact without any interruption.
The performance is decrease with the increase the impact of disaster and area size.
Using D2D communication provides more than 20% of area coverage
Cluster-based D2D communication in 6G mobile network should consider in future.
|
|
ICACT20230194 Slide.13
[Big slide for presentation]
|
Chrome Text-to-Speach Click!! |
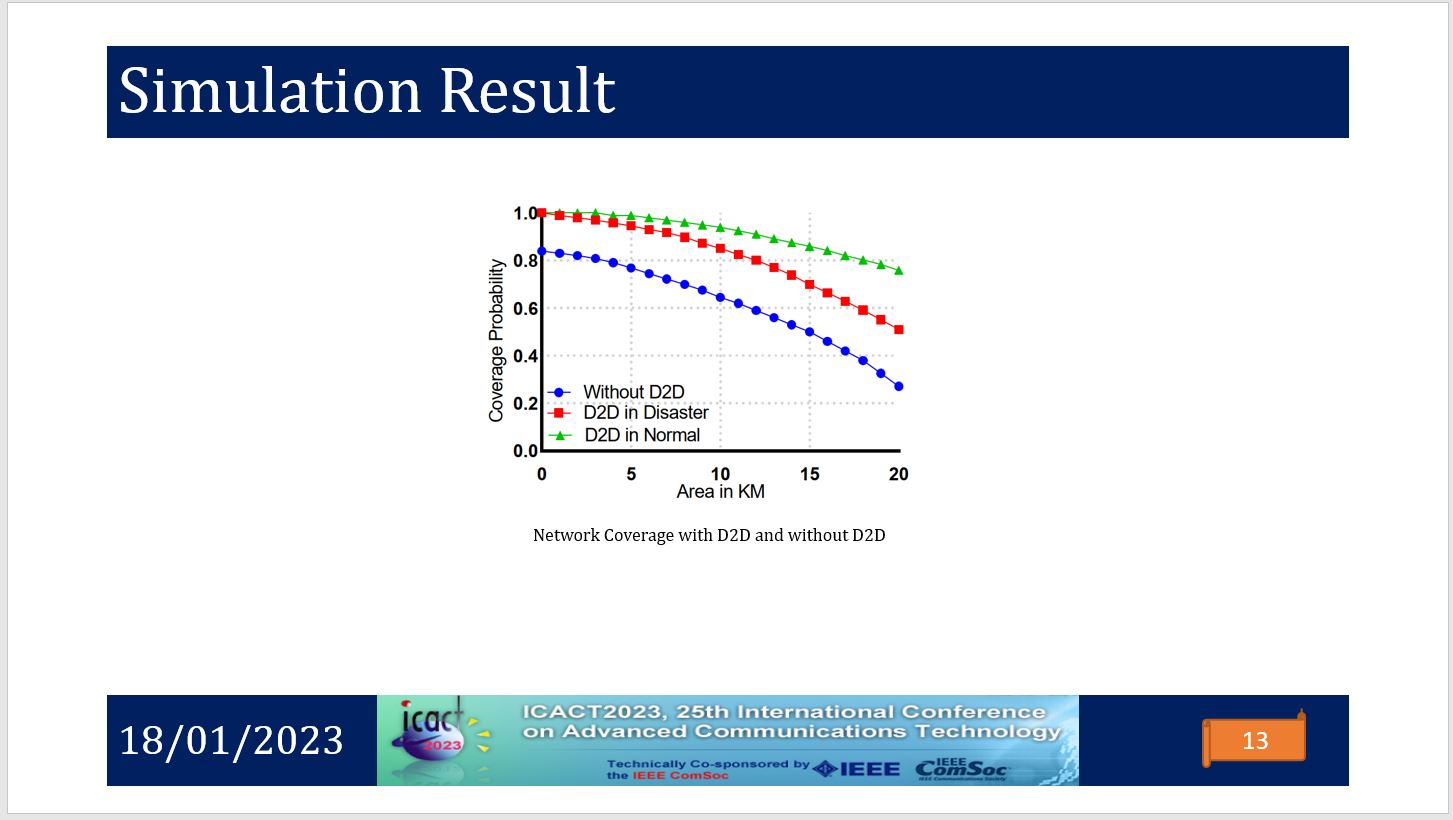 |
This slide shows the coverage probability in a different situation. With D2D in a Normal situation, without D2D in a Disaster situation and with D2D in a disaster situation. More than 20 % area can cover when we use cluster-based D2D communication.
|
|
ICACT20230194 Slide.12
[Big slide for presentation]
|
Chrome Text-to-Speach Click!! |
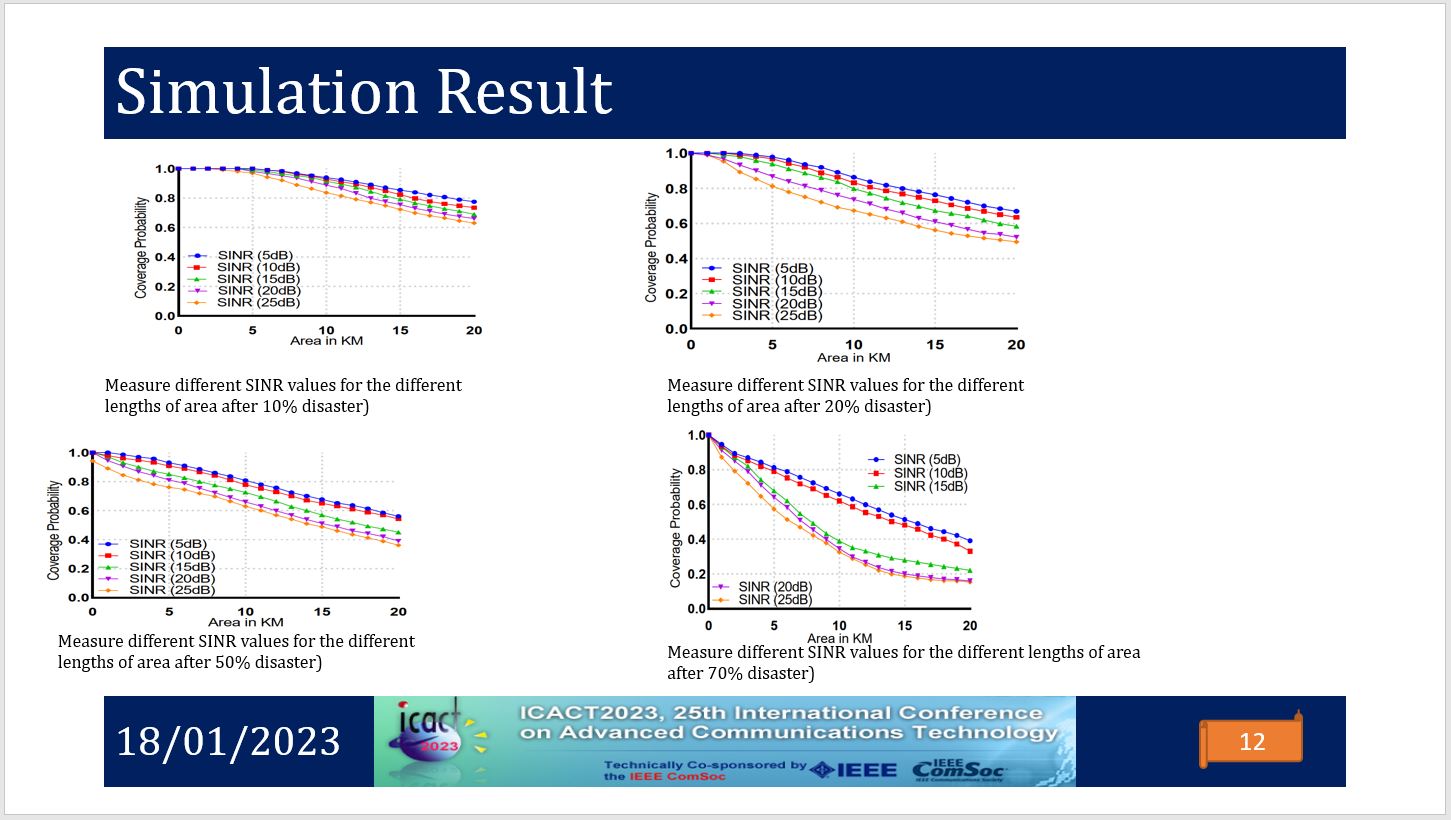 |
This slide shows the coverage probability in different kM wrt different scales of the disaster. For example, 70% disaster: blow 20% people get 25dB. However, on avg 60% of users can get 10dB SINR. For the details refers to the paper.
|
|
ICACT20230194 Slide.11
[Big slide for presentation]
|
Chrome Text-to-Speach Click!! |
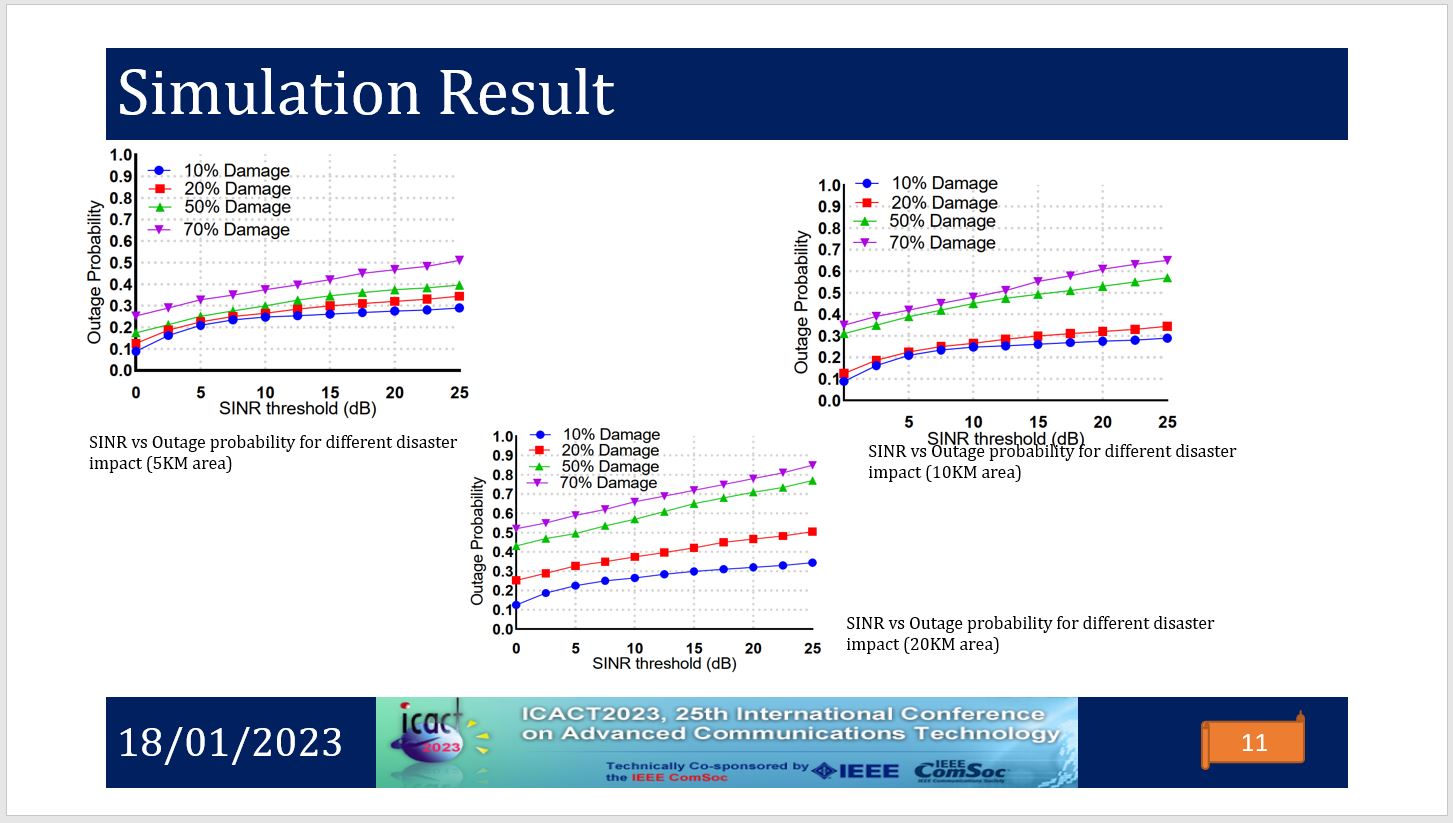 |
This figure shows the simulation result. The top left figure shows the outage probability vs SINR in 5KM wrt different scales of disaster impact. Top right shows for 10 km area and the bottom shows for 20 km area. considering the 5 km area there is not much impact up to 50 % damage. However, when it is a big disaster impact 50% damage in 20 KM means only 10 BS are in working condition. Only 20 % of users will get the best quality of service for communication. The details results are described in the paper.
|
|
ICACT20230194 Slide.10
[Big slide for presentation]
|
Chrome Text-to-Speach Click!! |
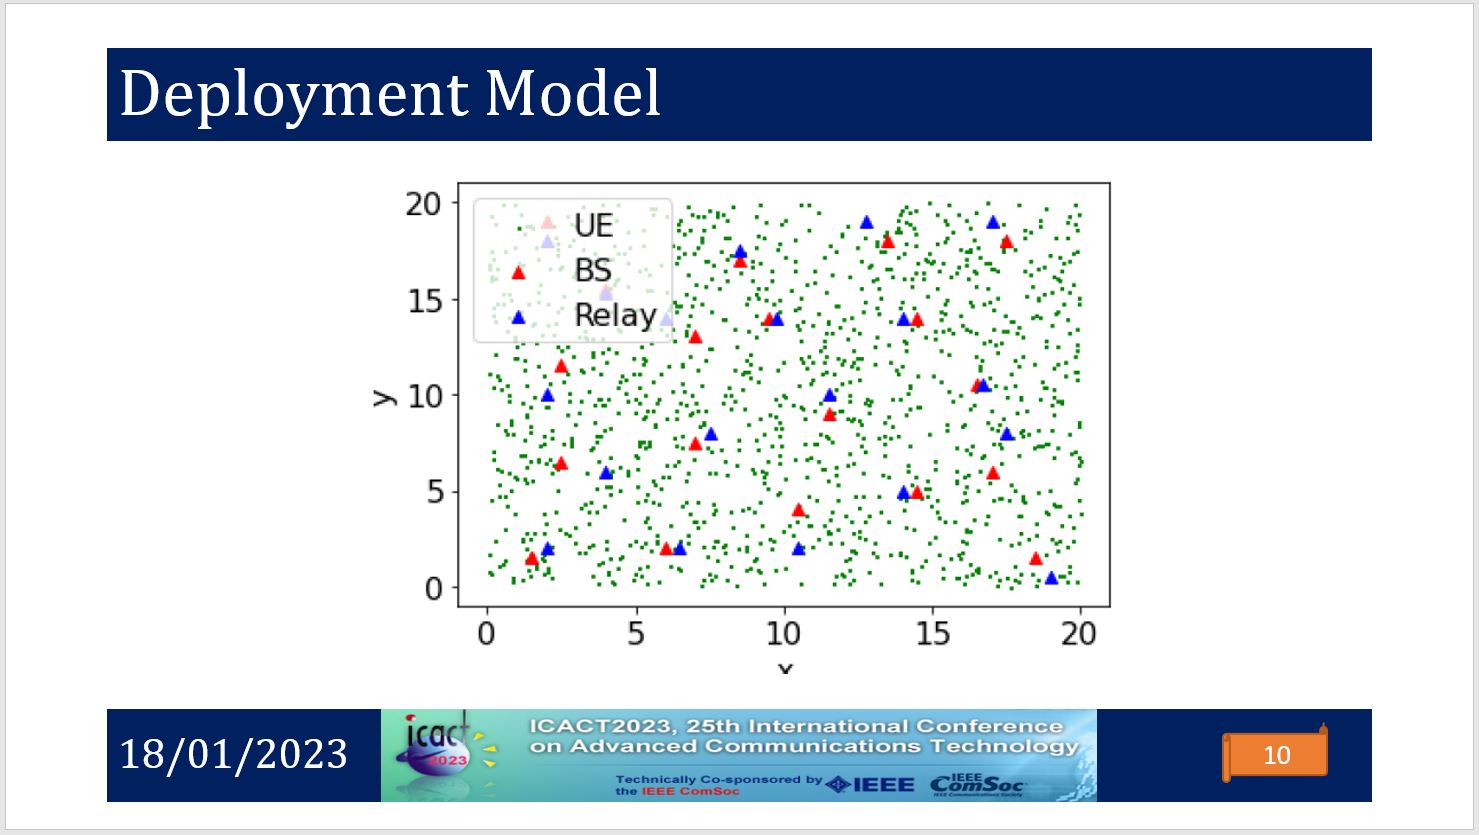 |
This is the deployment model of the simulation. As per table parameters, 20x20 km was used with 20 BS and 20 relay nodes. Red colours are the BS and Blue are the relay node. all the green are UE in this deployment.
|
|
ICACT20230194 Slide.09
[Big slide for presentation]
|
Chrome Text-to-Speach Click!! |
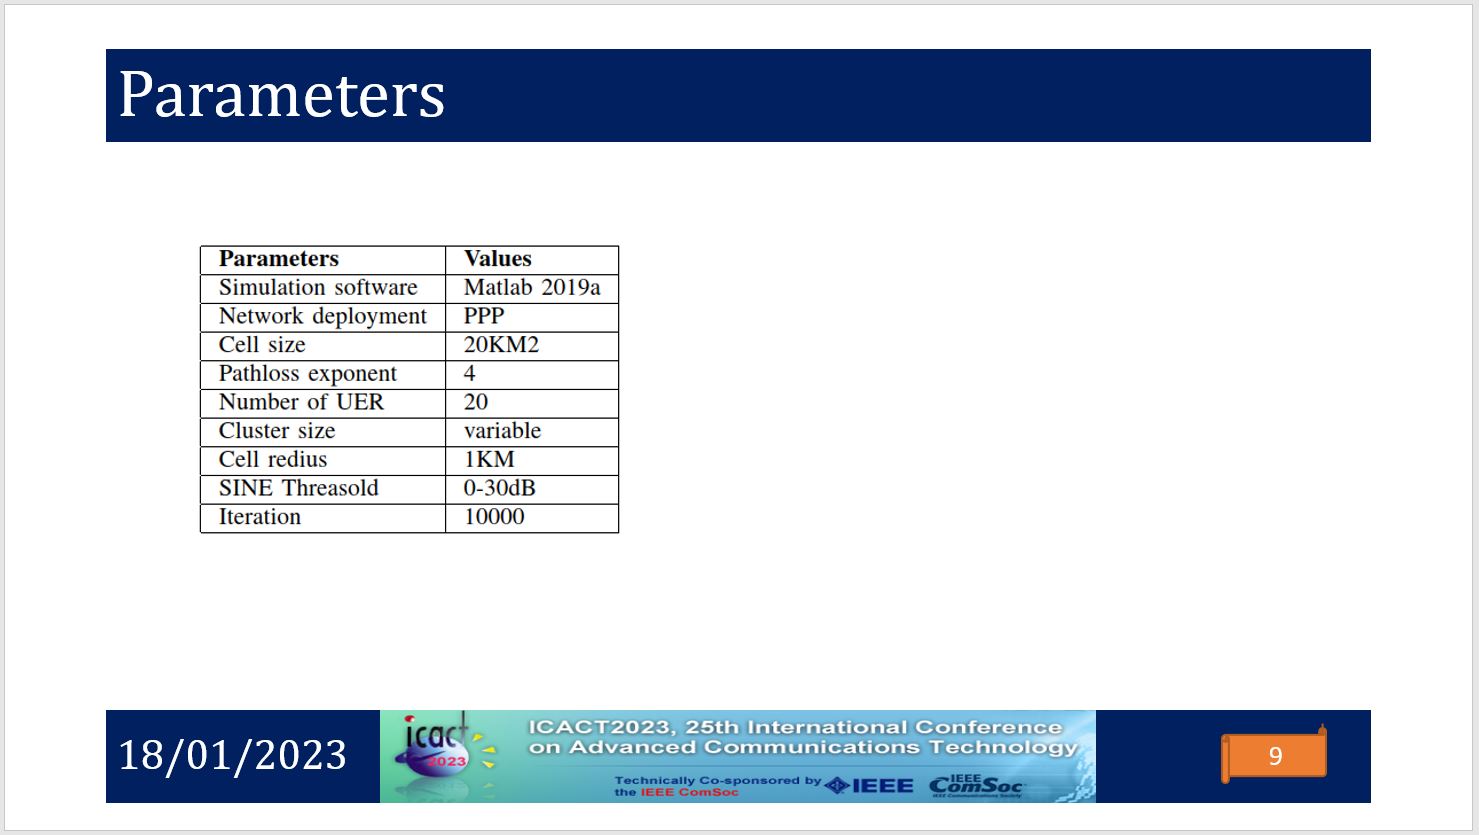 |
This slide shows the parameter used for the simulation of this paper. Monte Carlo simulation is used to analyse the result.
|
|
ICACT20230194 Slide.08
[Big slide for presentation]
|
Chrome Text-to-Speach Click!! |
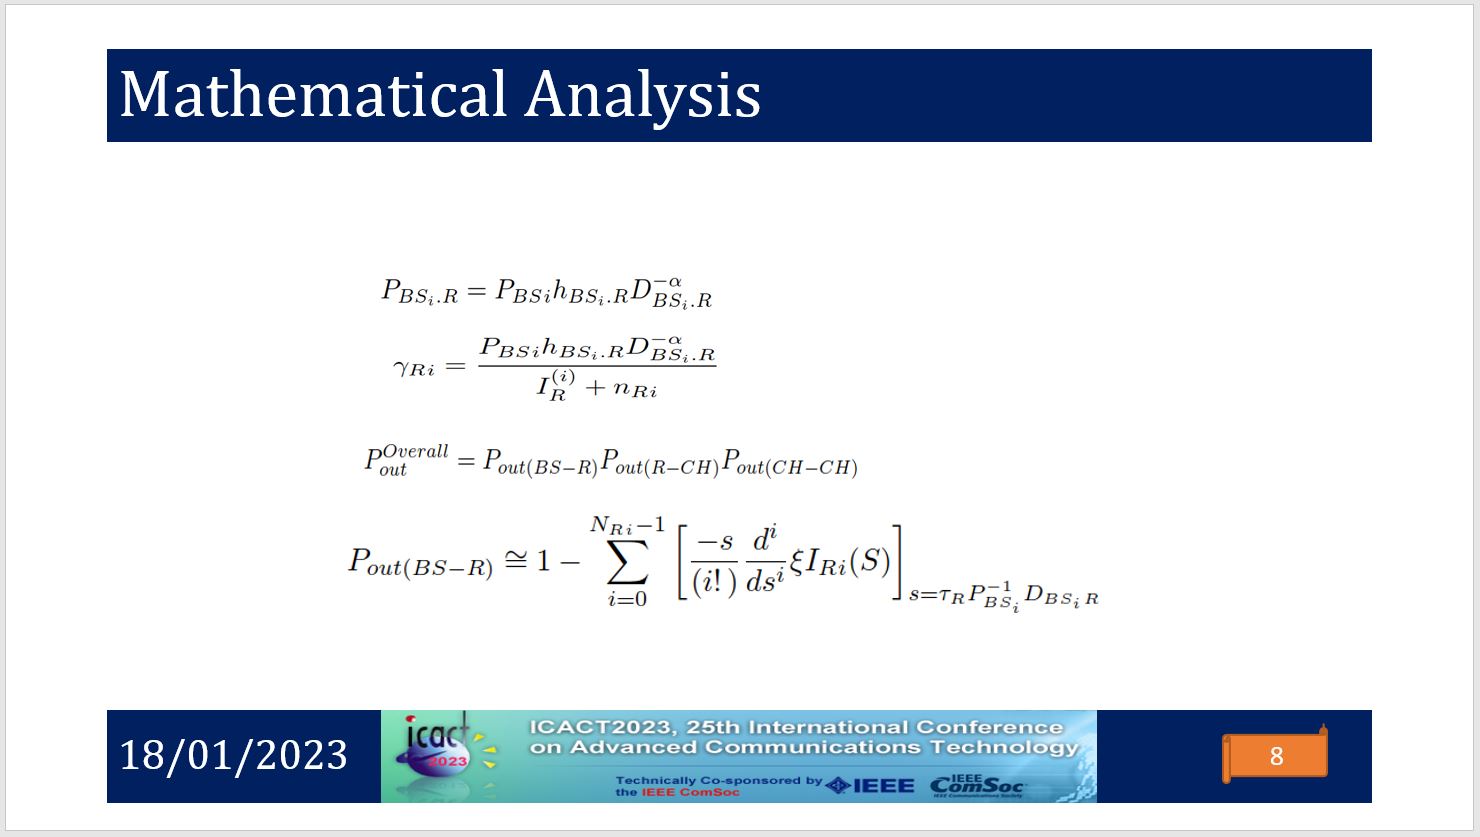 |
The first equation shows the power calculation from BS to the relay node. The second equation shows the interference equation for the BS to relay node. The overall outage probability is shown in the third equation. The fourth equation shows the only outage probability for the BS to really. The details derivation is out of the scope of the presentation. Please refer to the paper.
|
|
ICACT20230194 Slide.07
[Big slide for presentation]
|
Chrome Text-to-Speach Click!! |
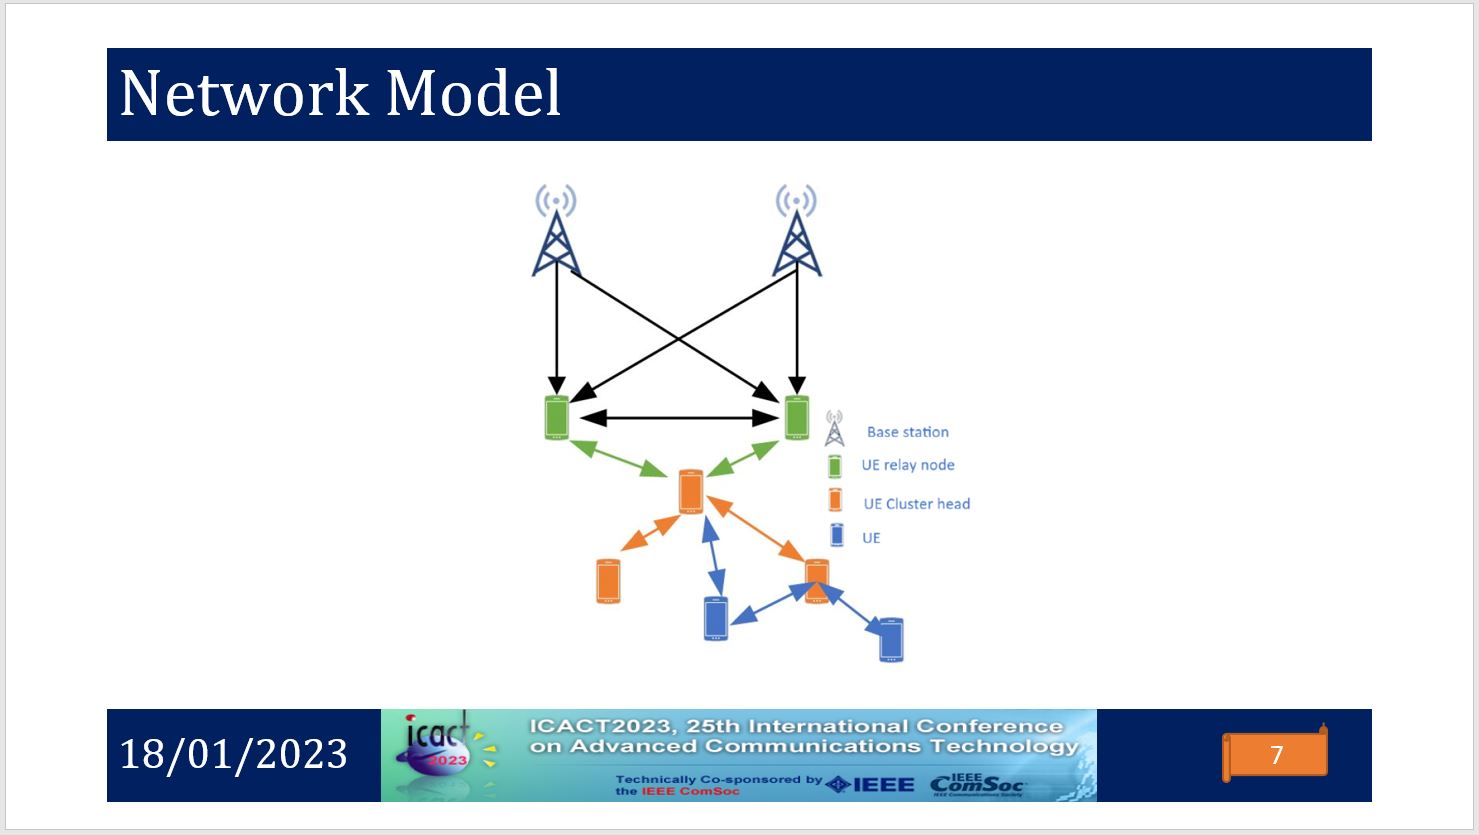 |
This slide shows the network model for this paper. it shows the blue and orange colour users are in a disaster area. The green colour users are in the range of BS. From the disaster area, some of the UE will act as Cluster Heads (CH). All other nodes/ UE are cluster members. Cluster member only communicates via CH. To find the outage probability of the network, it needs to calculate the outage probability relay node (which are in the range of BS) and the outage probability of the UE nodes in the disaster area. The mathematical analysis showing in the next slide.
|
|
ICACT20230194 Slide.06
[Big slide for presentation]
|
Chrome Text-to-Speach Click!! |
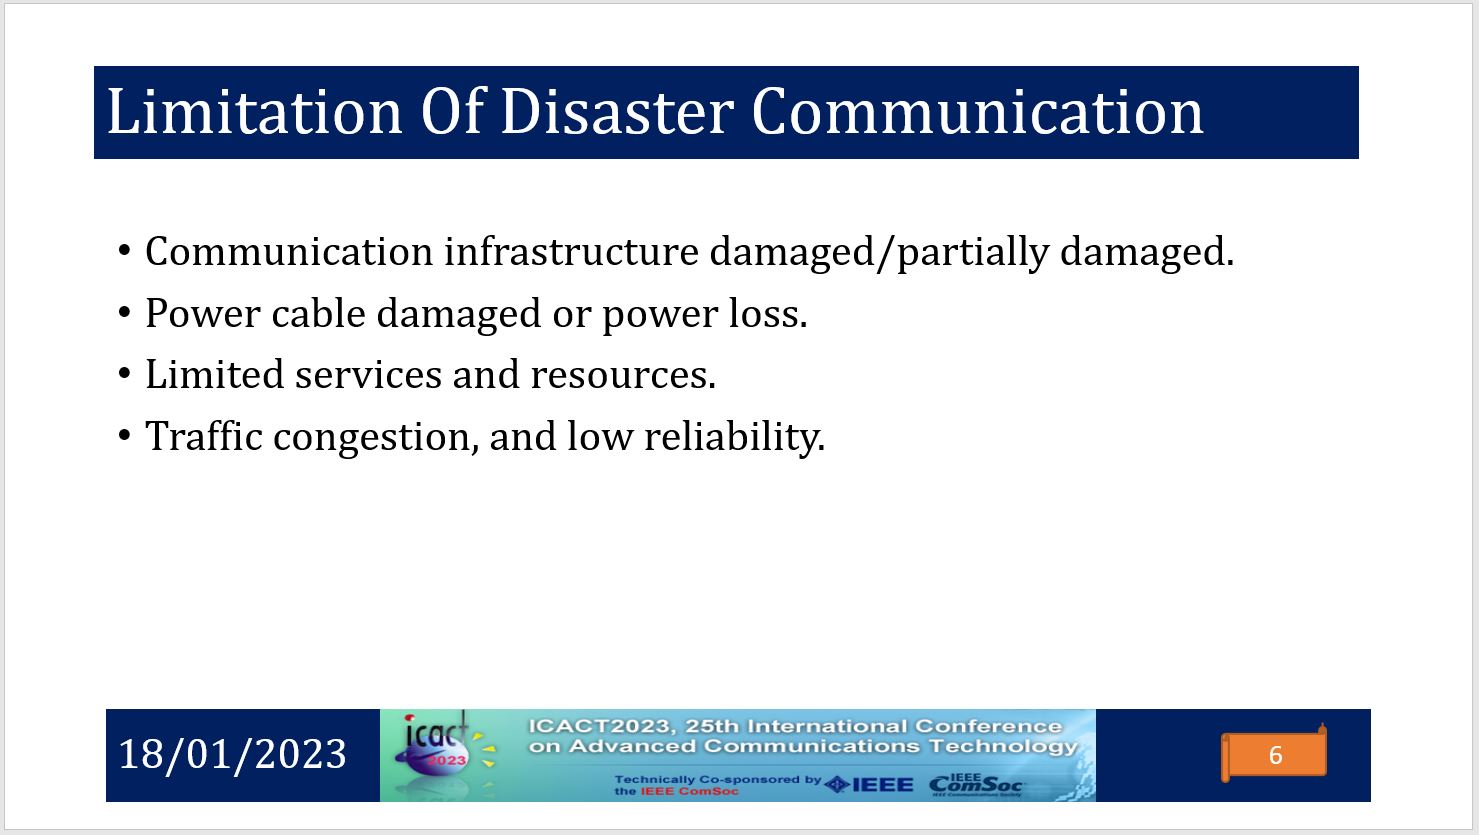 |
This slide shows some of the limitations of disaster communication when a single or multiple BS is damaged either partially or fully. It creates huge traffic congestion, which occurs limited services and resources.
|
|
ICACT20230194 Slide.05
[Big slide for presentation]
|
Chrome Text-to-Speach Click!! |
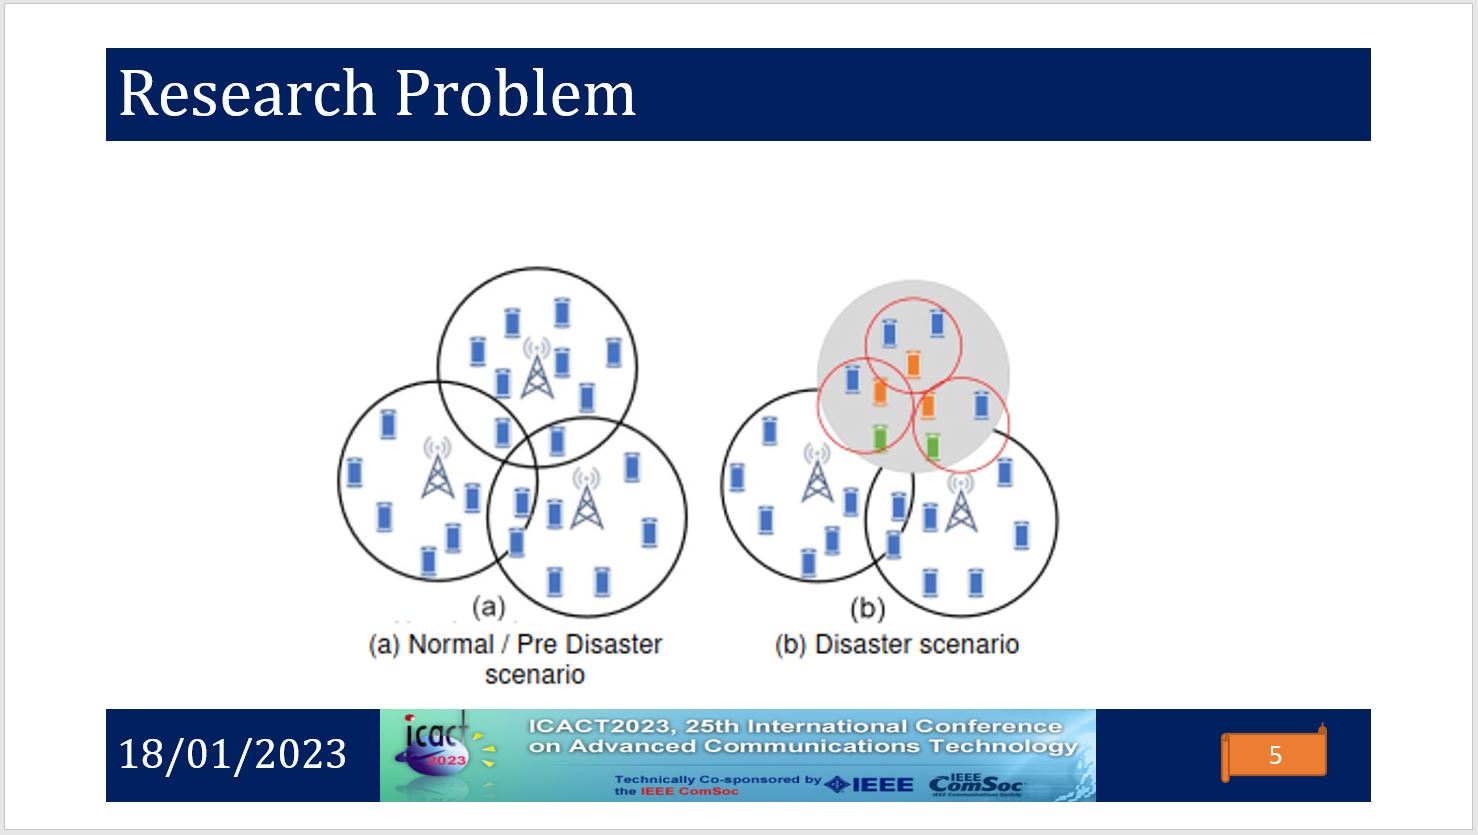 |
The left figure shows the Normal scenario or pre-disaster scenario where all the users are able to communicate normal way. The right-hand side figure shows the scenario after the disaster impact when the BS is damaged in a certain area. The users who are under that damaged BS not able to communicate normally. It is essential to collect information promptly about the people who are inside the damaged area. In this paper, I calculated how many people are able to communicate at different scales of disaster when using cluster-based D2D communication.
|
|
ICACT20230194 Slide.04
[Big slide for presentation]
|
Chrome Text-to-Speach Click!! |
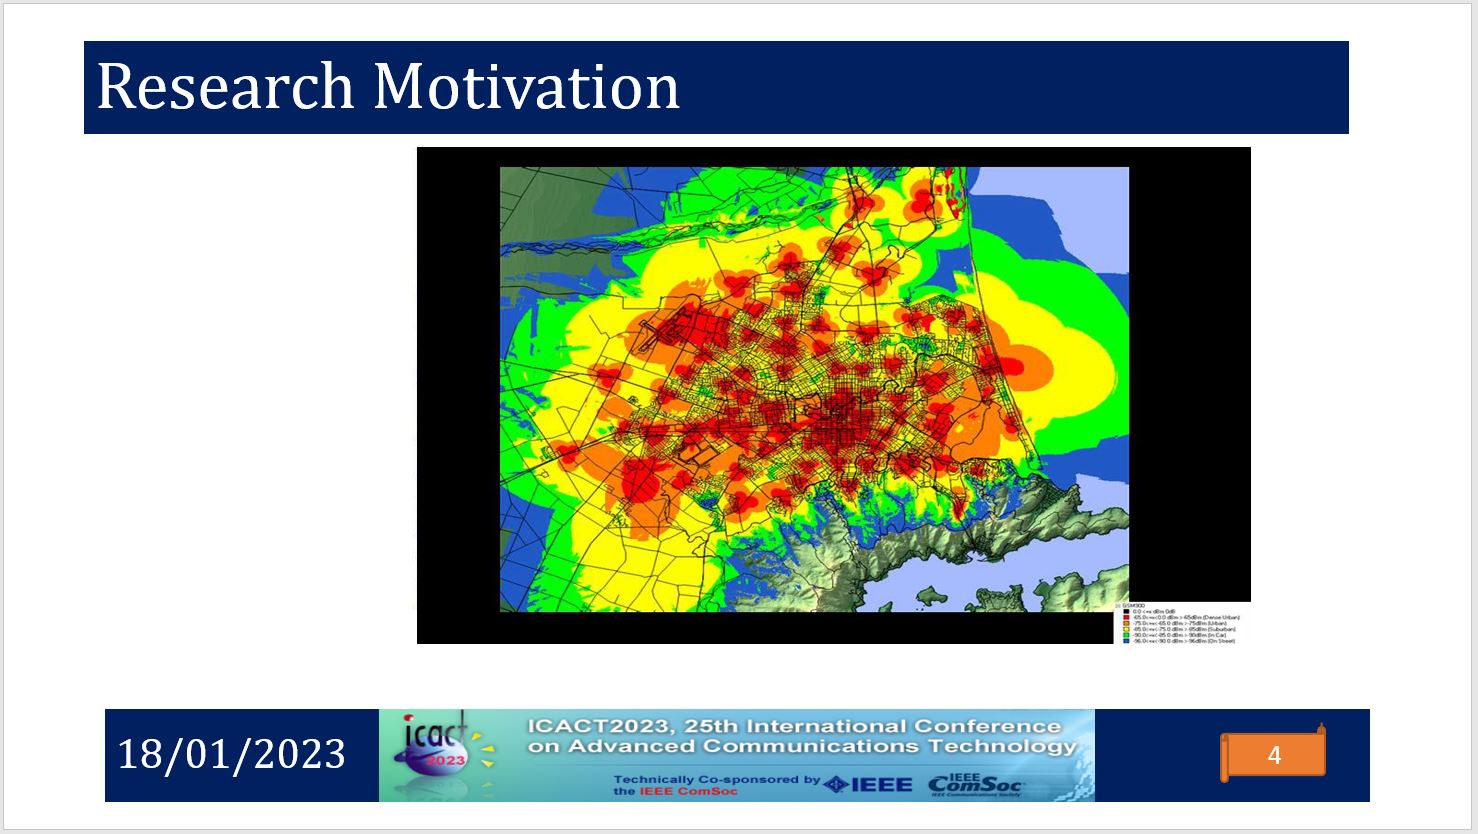 |
This figure shows the communication outage during the NZ earthquake in 2011.
People could not make an emergency calls. Communication was restored after six days. Though the first 72 after the disaster are very crucial for saving lives.
|
|
ICACT20230194 Slide.03
[Big slide for presentation]
|
Chrome Text-to-Speach Click!! |
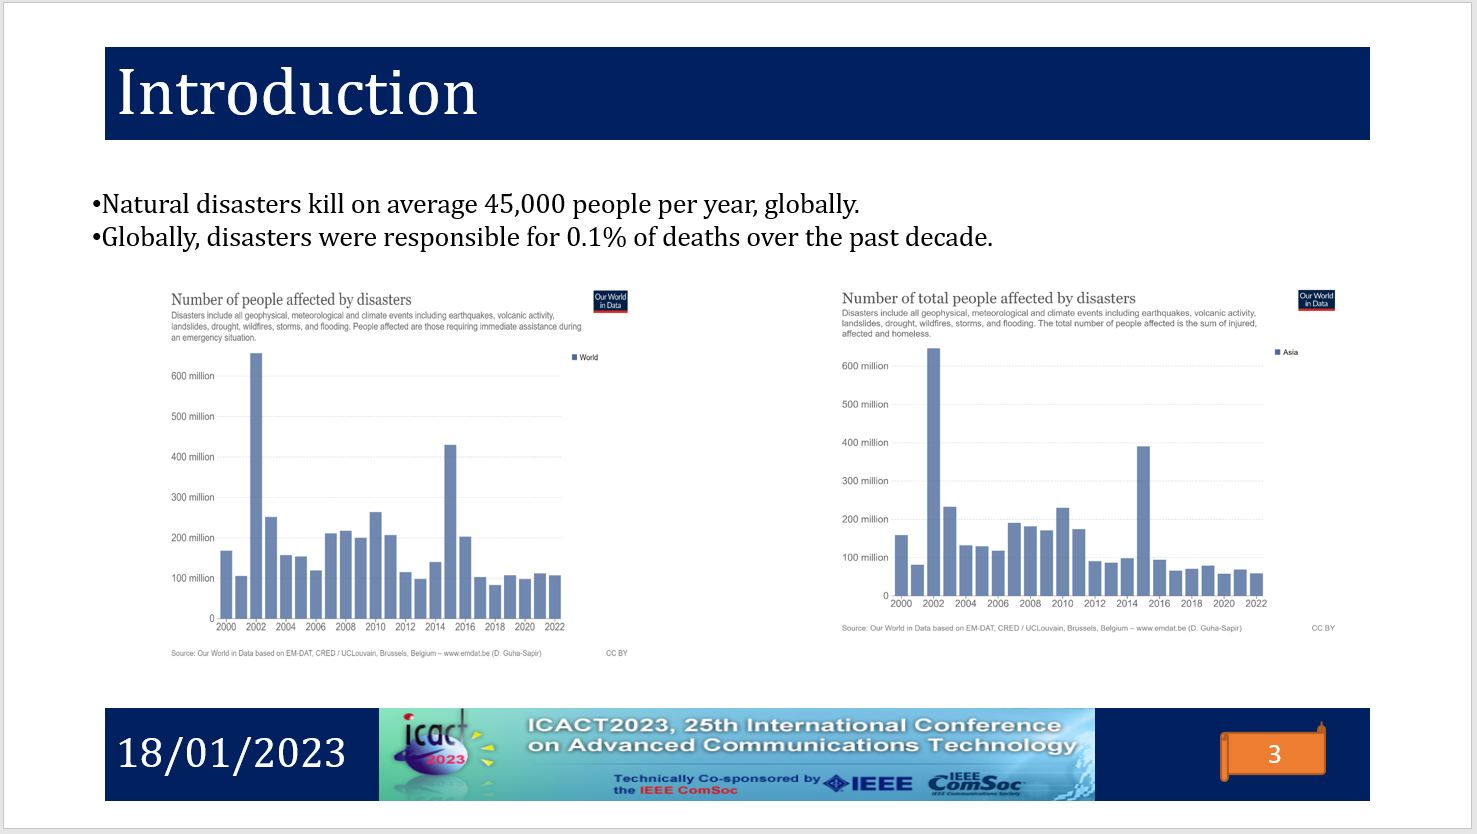 |
Here are the statistics for the number of people who died during the disaster. The left side figure shows the world data and the right side figure shows the Asia region data. Faster response after the disaster impact could save many lives and can significantly reduce the save people's life.
|
|
ICACT20230194 Slide.02
[Big slide for presentation]
|
Chrome Text-to-Speach Click!! |
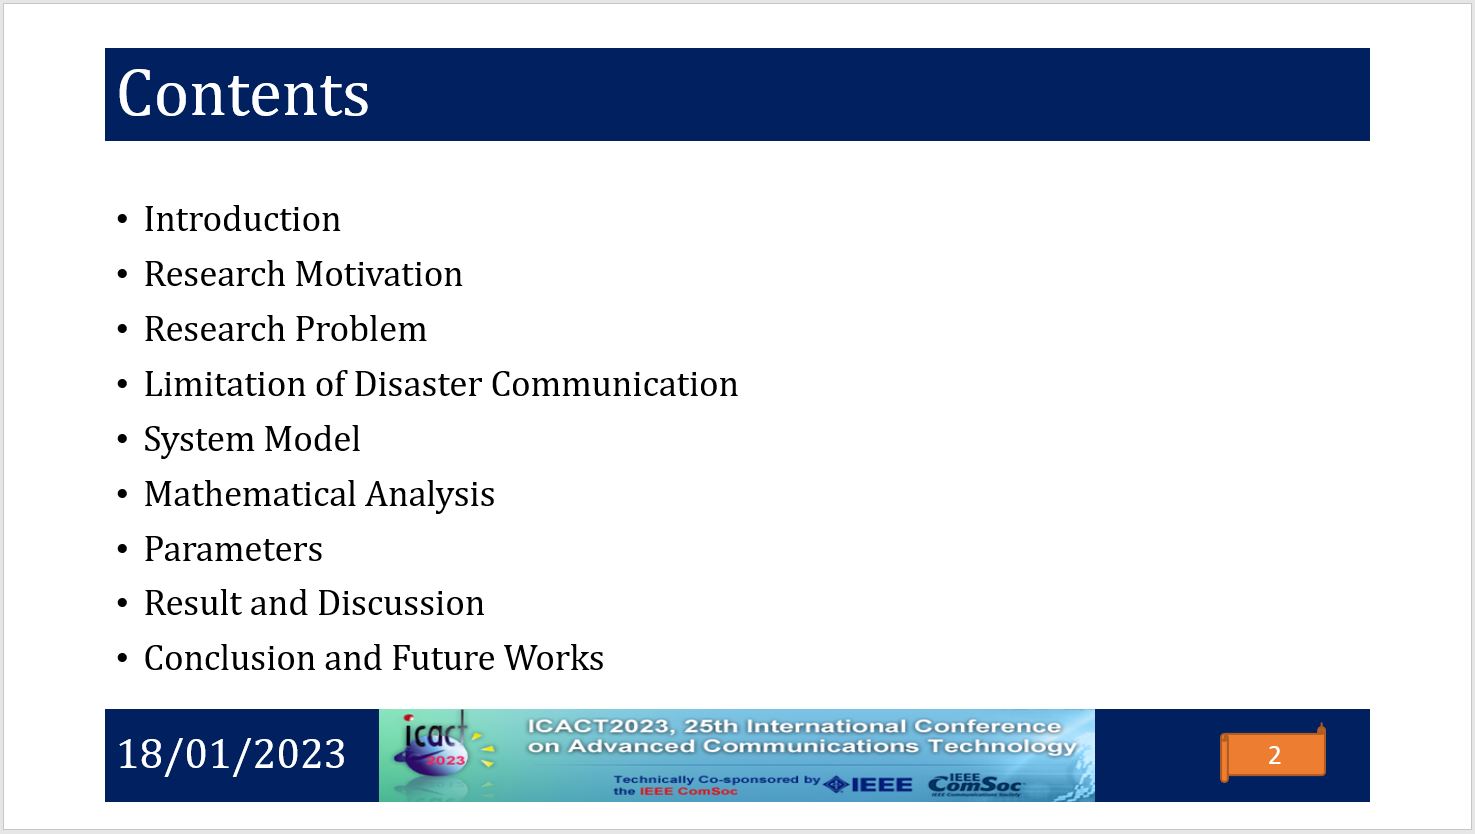 |
This slide shows the contents of the presentation. I am going to discuss the first Introduction, then the motivation of the research by showing some statistics, Research problems followed by the limitation of communication after the disaster impact. After that discuss the system model and mathematical analysis. Simulation results and findings will be discussed. This presentation will be concluded with a summary and QA session.
|
|
ICACT20230194 Slide.01
[Big slide for presentation]
|
Chrome Text-to-Speach Click!! |
 |
Hello Everone, (tena koutou katoa-Māori). My name is Shakil Ahmed. I am pursuing my PhD from Massey University, New Zealand. My presentation today about cluster-based D2D communication for the post-disaster response. The presentation will briefly show the performance to use cluster-based D2D communication during scalable disaster damage.
|
|
ICACT20230194 Slide.00
[Big slide for presentation]
[YouTube] |
Chrome Text-to-Speach Click!! |
 |
|
















