 ICACT20210155 Slide.15
[Big slide for presentation] |
Chrome Text-to-Speach Click!! |
 |
Thanks to my professors who had enough patients to help me to complete the paper. Thanks to all of my partners who gave me specific evidence to support my theory.Thanks to all of your attentions.
|
|
ICACT20210155 Slide.14
[Big slide for presentation]
|
Chrome Text-to-Speach Click!! |
 |
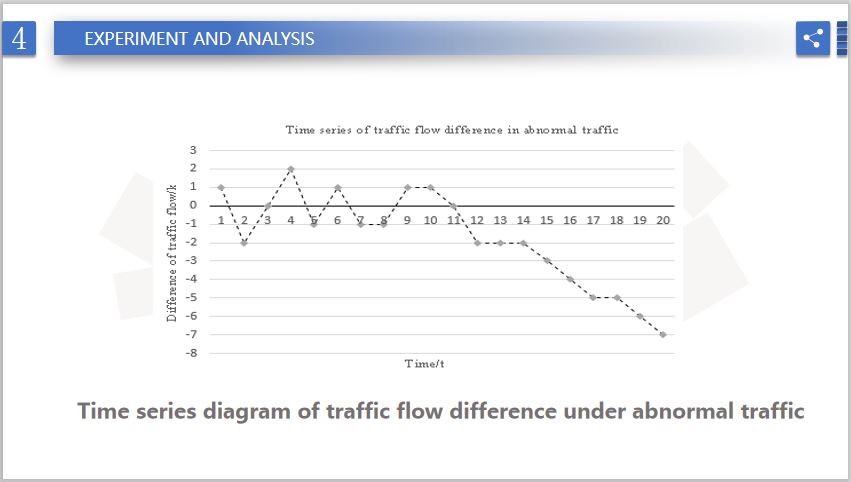
It can be seen from Fig. 6 and Fig. 7 that in the case of traffic anomalies, the data graphic method shows that the time series of traffic flow difference on a section of motorway present a large trend change before and after a certain moment, and the declining trend becomes more and more obvious. The occurrence of traffic anomalies between adjacent nodes results in significant differences in traffic flow passing through adjacent nodes.The stability test of the time series is carried out and the original hypothesis is accepted. According to formula , the probability of traffic anomaly is calculated as 55%, which is greater than 50% of the threshold originally set.
|
|
ICACT20210155 Slide.13
[Big slide for presentation]
|
Chrome Text-to-Speach Click!! |
 |
It can be seen from Fig 5 and Fig 7 that, under normal circumstances, the time series of traffic flow difference between adjacent nodes on the motorway fluctuates around the value of 0, which is relatively stable. Then, ADF test is used to test the stability of time series, the result of which can reject the original hypothesis that the time series is unstable.
|
|
ICACT20210155 Slide.12
[Big slide for presentation]
|
Chrome Text-to-Speach Click!! |
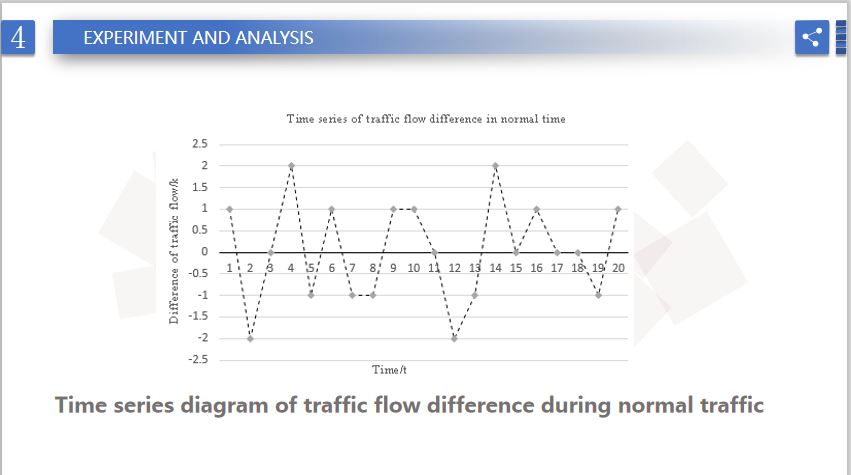 |
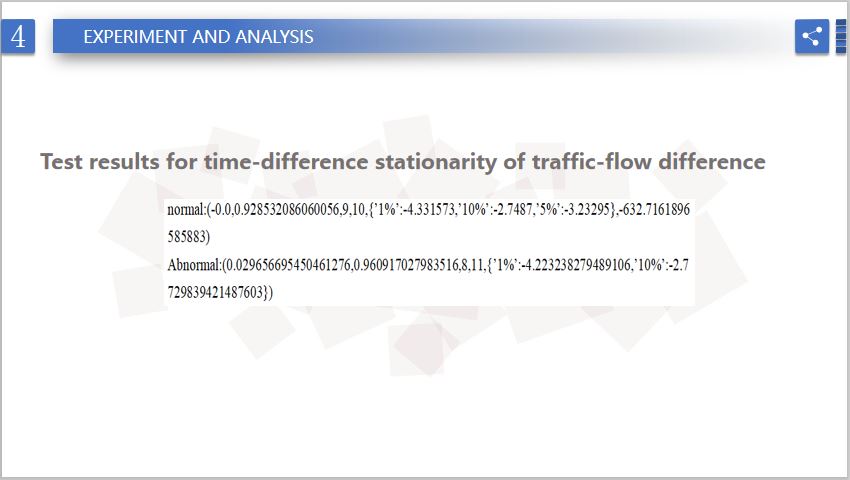
In this paper, the motorway probability of traffic abnormality is judged by the time-series stationarity test of the traffic flow difference between adjacent nodes. The hypothesis of ADF stationarity test is that there is a unit root, namely, the motorway traffic flow time series is unstable. The time series of traffic flow difference between adjacent nodes when traffic is normal is shown in Figure 3, while that of traffic flow difference between adjacent nodes when traffic is abnormal is shown in Figure 4.The time series of traffic flow difference under the two conditions was tested for stationarity, and the results were shown in Fig. 5.
|
|
ICACT20210155 Slide.11
[Big slide for presentation]
|
Chrome Text-to-Speach Click!! |
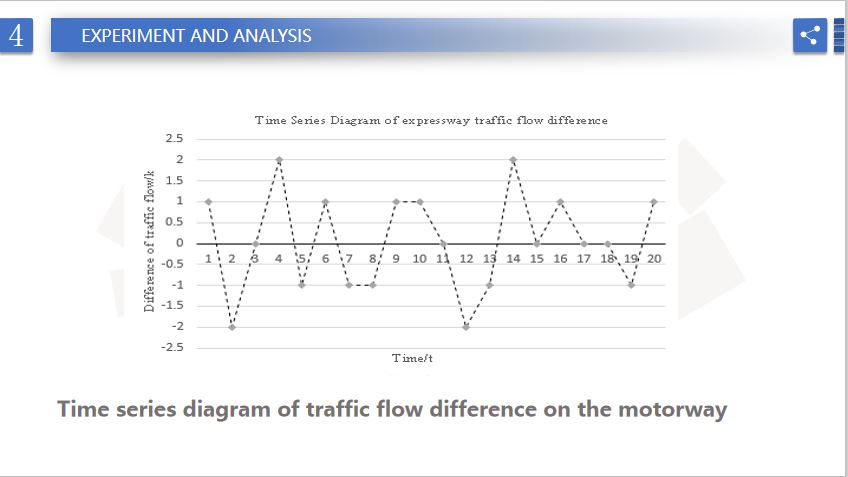 |
It can be seen from Fig. 4 that the value of traffic flow difference in the time series of traffic flow difference between adjacent nodes of the motorway fluctuates around 0 with a small fluctuation range.
|
|
ICACT20210155 Slide.10
[Big slide for presentation]
|
Chrome Text-to-Speach Click!! |
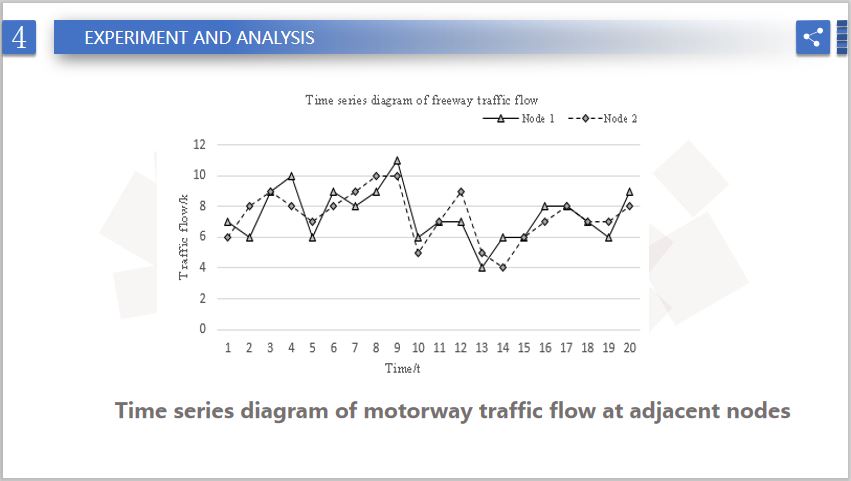 |
It can be concluded from Fig. 3 that the traffic flow time series of adjacent nodes present a similar trend. In the driving process of vehicle , due to different vehicle speeds, the motorway traffic-flow value of node 1 has a slight fluctuation based on the motorway traffic-flow value of node 2.
|
|
ICACT20210155 Slide.09
[Big slide for presentation]
|
Chrome Text-to-Speach Click!! |
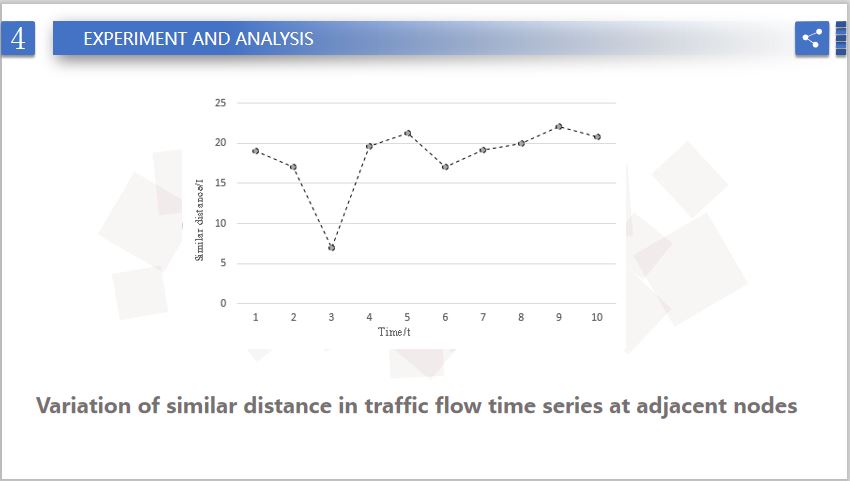 |
For each length moved by the sliding window, the similarity distance of traffic- flow time series at adjacent nodes is calculated, and the average arrival time of traffic flow is found through the minimum similarity distance. The experimental results of sliding window moving for 10 times are shown in Figure 2. It can be seen from Figure 2 that, with the movement of the sliding window, the similar distance of the time series of the motorway traffic flow at the adjacent nodes is changing constantly, but there will be an obvious downward and upward trend within a period of time, and there is a minimum value. When the similarity distance is the minimum, the traffic flow time series of adjacent nodes on the motorway is the most similar, and then the corresponding time is the average arrival time of the motorway traffic flow.
|
|
ICACT20210155 Slide.08
[Big slide for presentation]
|
Chrome Text-to-Speach Click!! |
 |
Experiment and analysis
|
|
ICACT20210155 Slide.07
[Big slide for presentation]
|
Chrome Text-to-Speach Click!! |
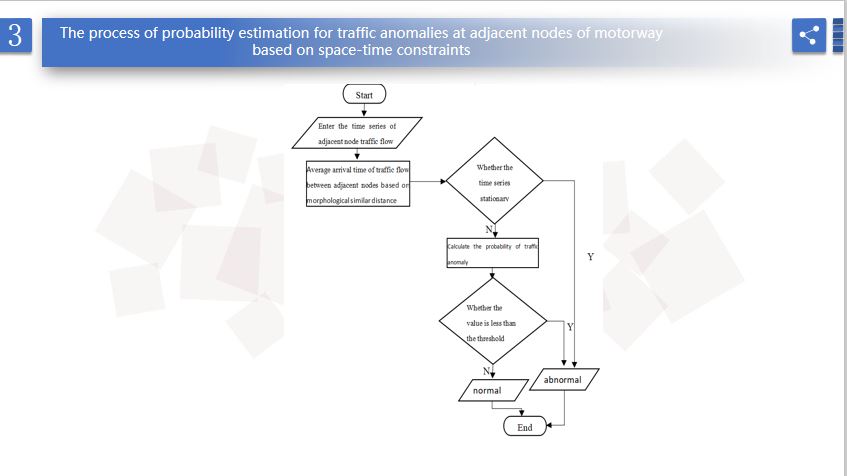 |
The marginal computing devices transmits counting results of motorway traffic flow to the cloud, and store them in the traffic-flow time series in the library, and then calculates average arrival time of traffic flow at adjacent nodes and tests whether the time series of traffic flow between two adjacent nodes apart from average arrival time are stable based on the morphological similarity distance. If the time series of traffic flow difference is not smooth, probability of traffic anomaly at adjacent nodes of motorway should be calculated. If the abnormal traffic probability is greater than the threshold, the abnormal traffic at adjacent nodes shall be considered, otherwise it will be deemed as normal transportation.
|
|
ICACT20210155 Slide.06
[Big slide for presentation]
|
Chrome Text-to-Speach Click!! |
 |
The process of probability estimation for traffic anomalies at adjacent nodes of motorway based on space-time constraints
|
|
ICACT20210155 Slide.05
[Big slide for presentation]
|
Chrome Text-to-Speach Click!! |
 |
The current technology commonly used in the intelligent transportation system for the detection of abnormality on motorway traffic is video monitoring technology, which realizes recognition and tracking of motorway vehicle, analyzes state of traffic flow, whether there is retrogradation or collision through the video camera,so as to determine whether there are traffic anomalies. However, the video-detection method still has the following deficiencies:
|
|
ICACT20210155 Slide.04
[Big slide for presentation]
|
Chrome Text-to-Speach Click!! |
 |
Limitation
|
|
ICACT20210155 Slide.03
[Big slide for presentation]
|
Chrome Text-to-Speach Click!! |
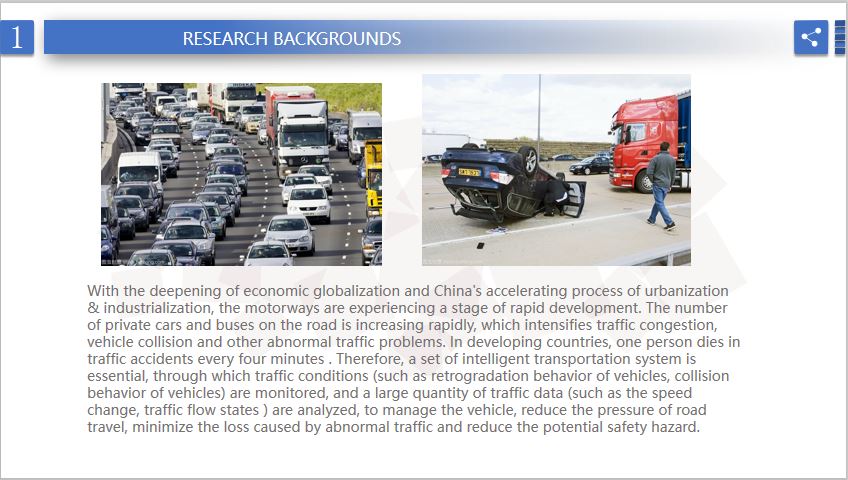 |
With the deepening of economic globalization and China's accelerating process of urbanization & industrialization, the motorways are experiencing a stage of rapid development. The number of private cars and buses on the road is increasing rapidly, which intensifies traffic congestion, vehicle collision and other abnormal traffic problems. In developing countries, one person dies in traffic accidents every four minutes. Therefore, a set of intelligent transportation system is essential, through which traffic conditions (such as retrogradation behavior of vehicles, collision behavior of vehicles) are monitored, and a large quantity of traffic data (such as the speed change, traffic flow states) are analyzed, to manage the vehicle, reduce the pressure of road travel, minimize the loss caused by abnormal traffic and reduce the potential safety hazard.
|
|
ICACT20210155 Slide.02
[Big slide for presentation]
|
Chrome Text-to-Speach Click!! |
 |
Research backgrounds
|
|
ICACT20210155 Slide.01
[Big slide for presentation]
|
Chrome Text-to-Speach Click!! |
 |
Hi everybody, my name is Xinwei Liu. For ICACT 2021, I have cooperated with Jun Guo ,Chen Liu, Zixuan Zhao, Bin Zhang,who are my partners. Our presentation today is about An Evaluation Model of Traffic Abnormal Probability of Adjacent Freeway Nodes Based on Space-time Constraints
|
















