 ICACT20250097 Slide.20
[Big slide for presentation] |
Chrome Text-to-Speach Click!! |
 |
This script provides a professional and structured way to present your research at the conference. Let me know if you need any modifications or additional details.
I sincerely hope that this academic conference concludes successfully. Thank you for your attentive listening
|
|
ICACT20250097 Slide.19
[Big slide for presentation]
|
Chrome Text-to-Speach Click!! |
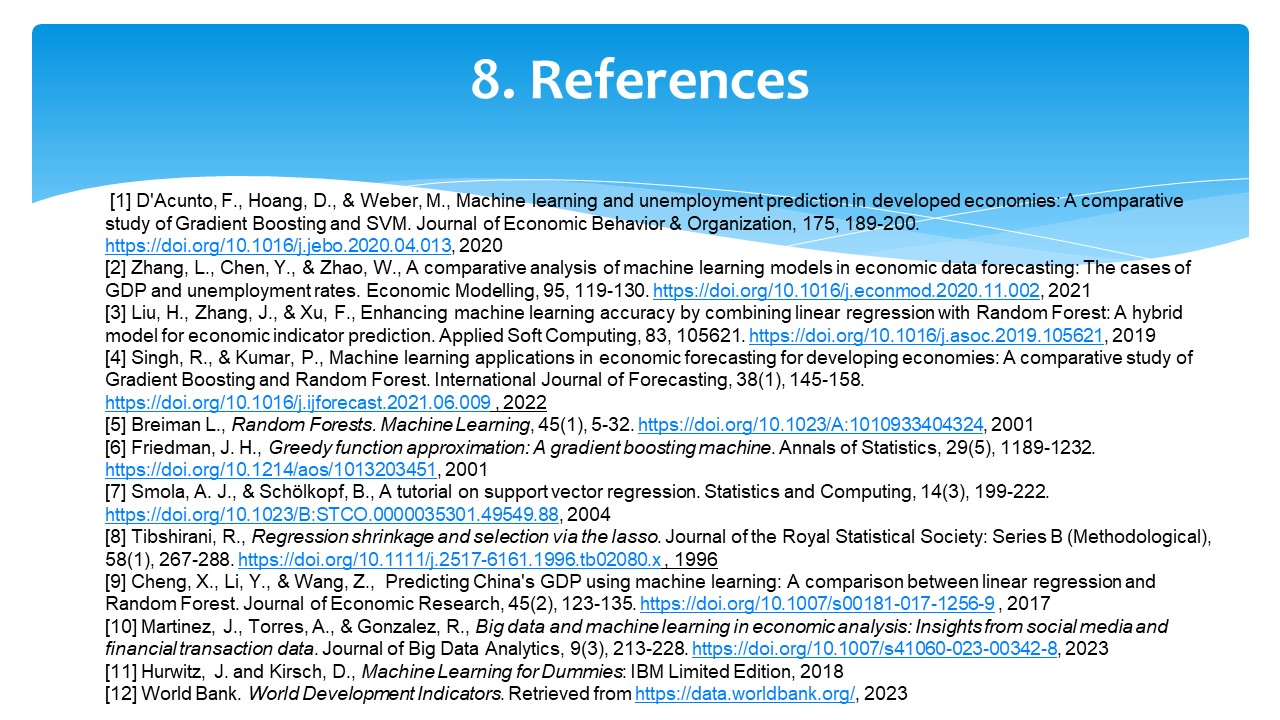 |
Here are some key references that supported our research.
We appreciate your attention, and I am happy to answer any questions you may have.
|
|
ICACT20250097 Slide.18
[Big slide for presentation]
|
Chrome Text-to-Speach Click!! |
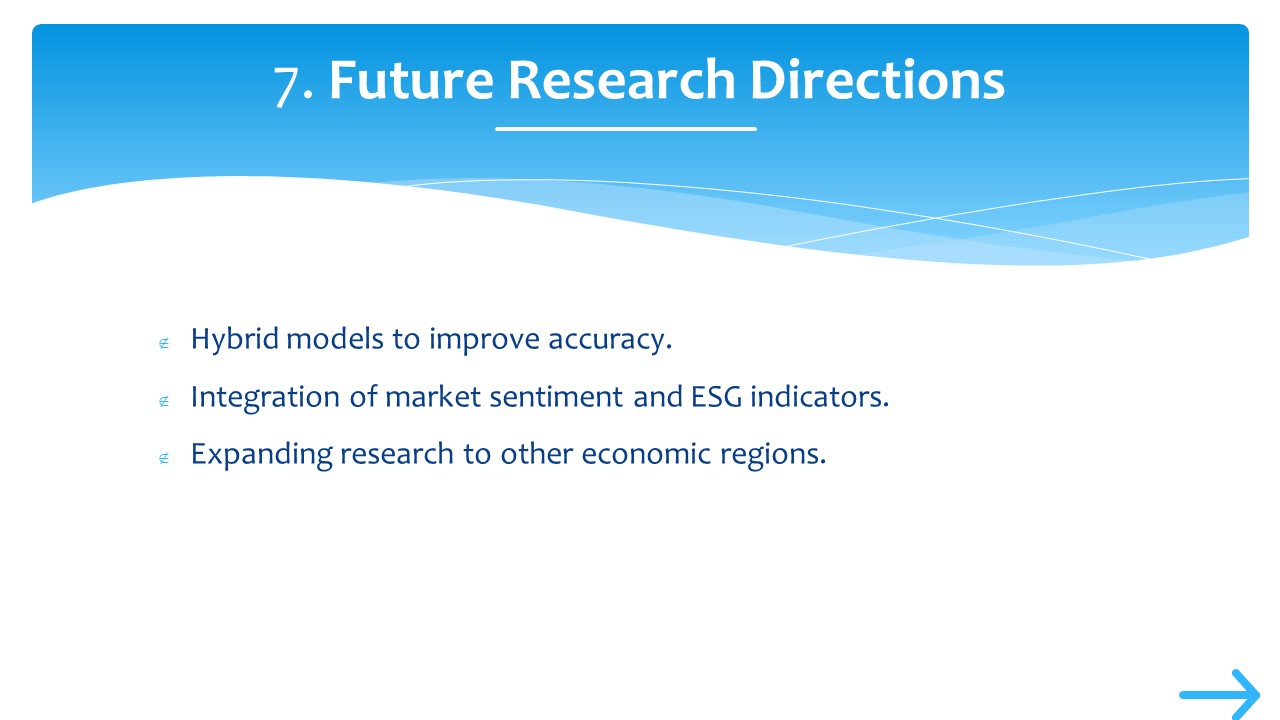 |
Moving forward, we suggest:
Developing hybrid models to enhance forecasting accuracy.
Incorporating market sentiment and ESG (Environmental, Social, and Governance) indicators.
Expanding research to other economic regions to validate model performance.
These advancements will further improve macroeconomic forecasting using machine learning.
|
|
ICACT20250097 Slide.17
[Big slide for presentation]
|
Chrome Text-to-Speach Click!! |
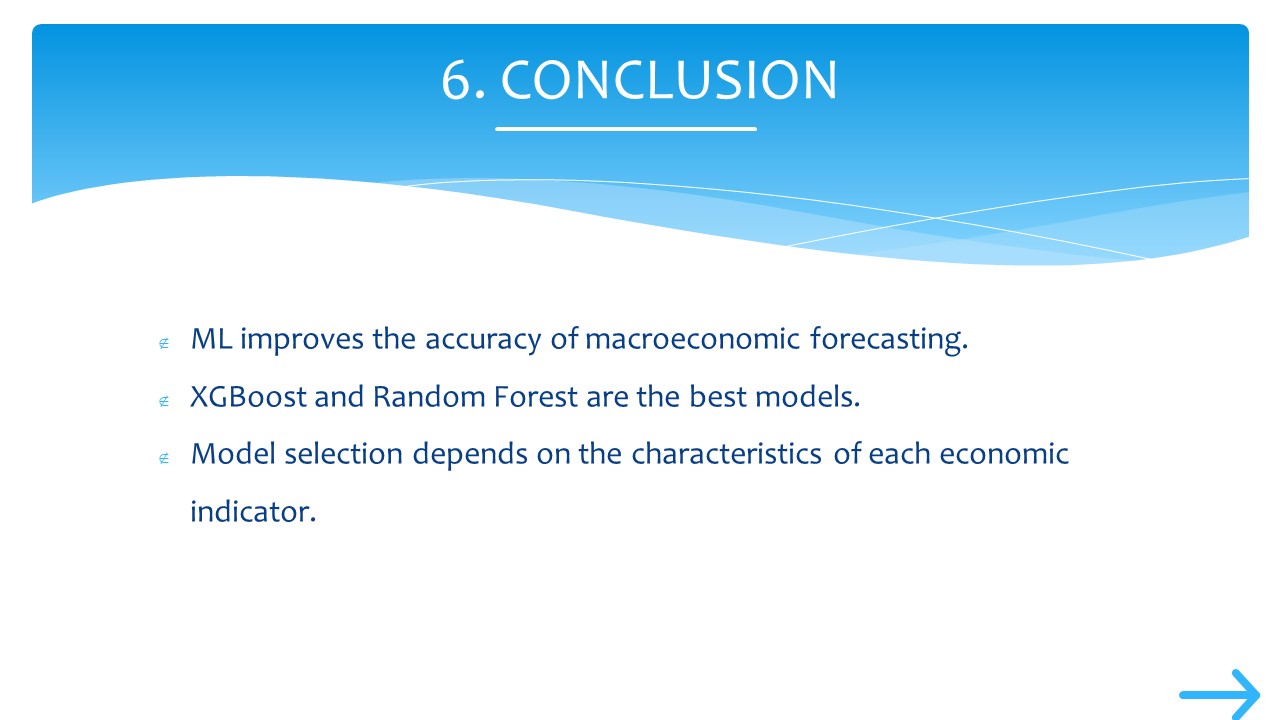 |
In conclusion:
Machine learning significantly improves macroeconomic forecasting.
Among the models tested, XGBoost and Random Forest delivered the best performance.
The choice of model depends on the specific economic indicator and data characteristics.
Our findings highlight the advantages of ML over traditional models in capturing complex economic patterns.
|
|
ICACT20250097 Slide.16
[Big slide for presentation]
|
Chrome Text-to-Speach Click!! |
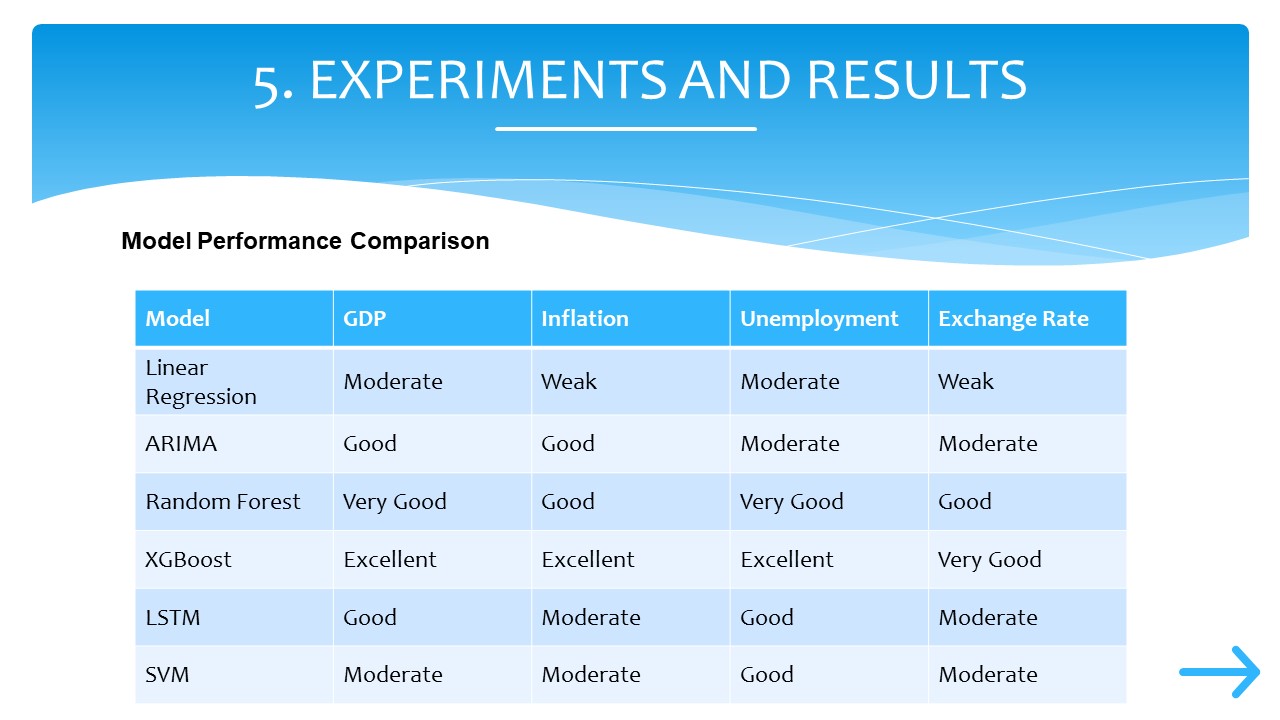 |
The characteristics of each result based on the experiment are as follows.
|
|
ICACT20250097 Slide.15
[Big slide for presentation]
|
Chrome Text-to-Speach Click!! |
 |
In conclusion:
Machine learning significantly improves macroeconomic forecasting.
Among the models tested, XGBoost and Random Forest delivered the best performance.
The choice of model depends on the specific economic indicator and data characteristics.
Our findings highlight the advantages of ML over traditional models in capturing complex economic patterns.
|
|
ICACT20250097 Slide.14
[Big slide for presentation]
|
Chrome Text-to-Speach Click!! |
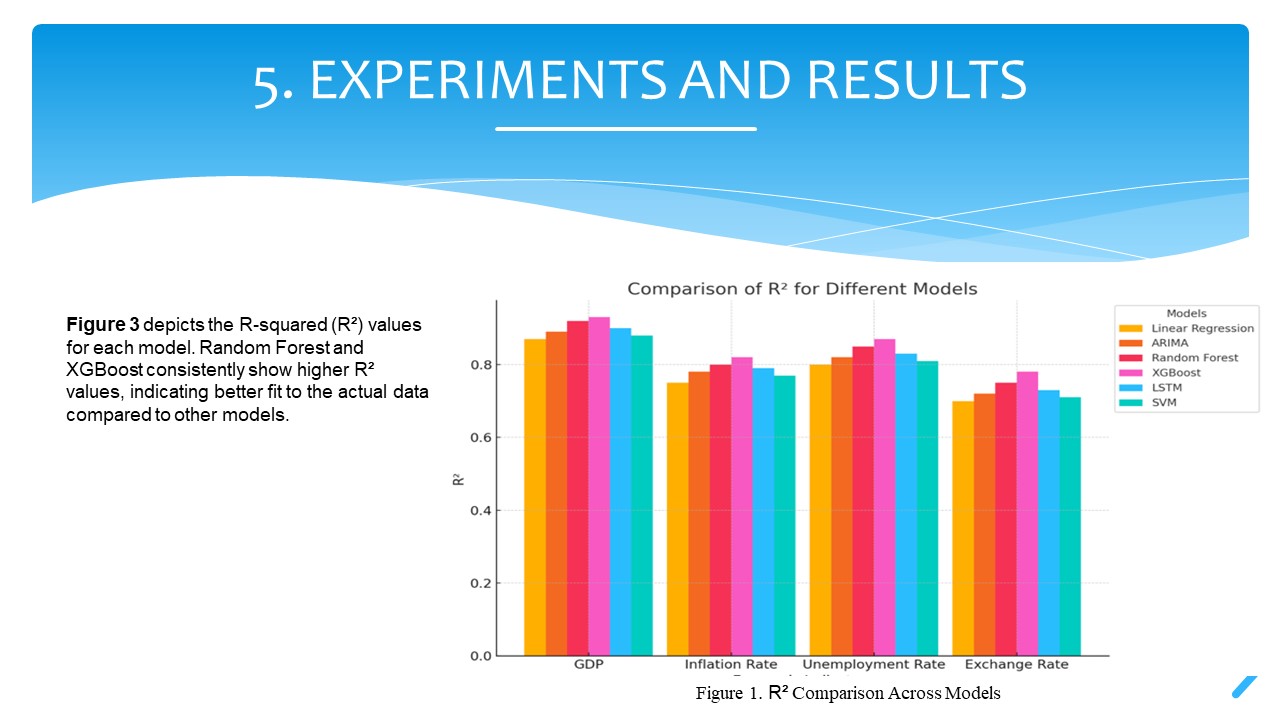 |
Figure 3. presents a graph illustrating the previously discussed figures.
|
|
ICACT20250097 Slide.13
[Big slide for presentation]
|
Chrome Text-to-Speach Click!! |
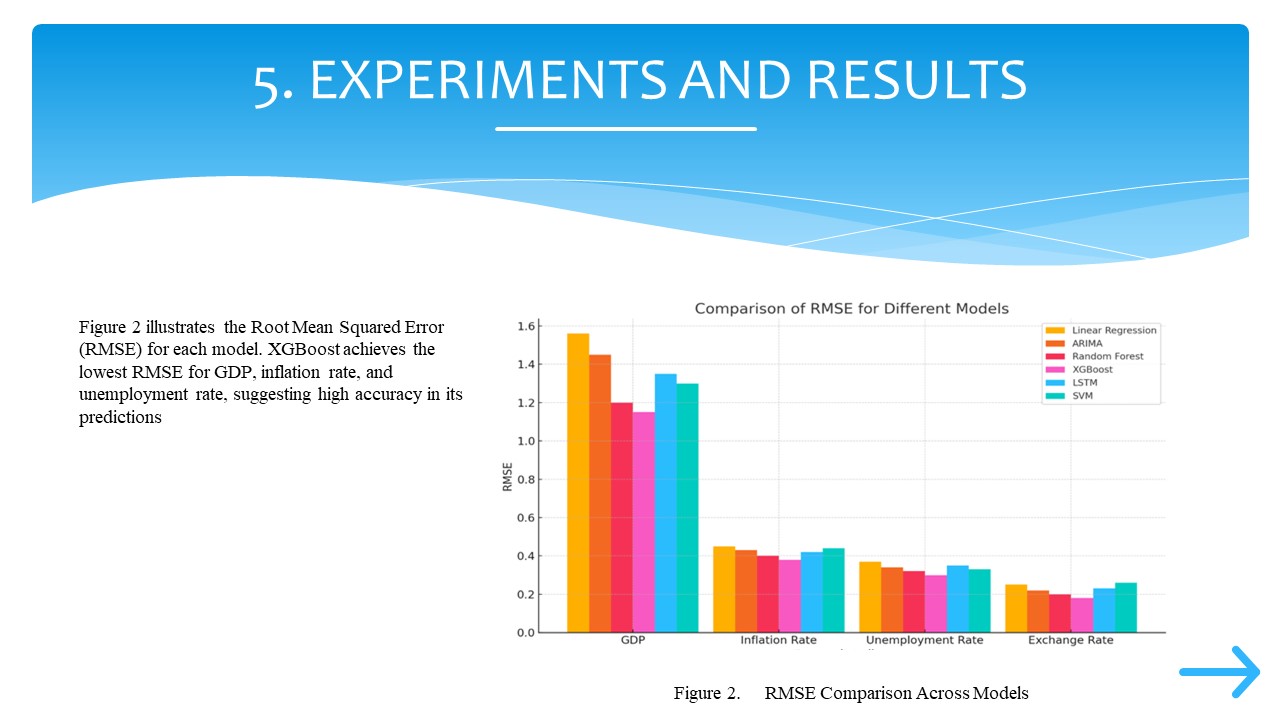 |
Figure 2. presents a graph illustrating the previously discussed figures.
|
|
ICACT20250097 Slide.12
[Big slide for presentation]
|
Chrome Text-to-Speach Click!! |
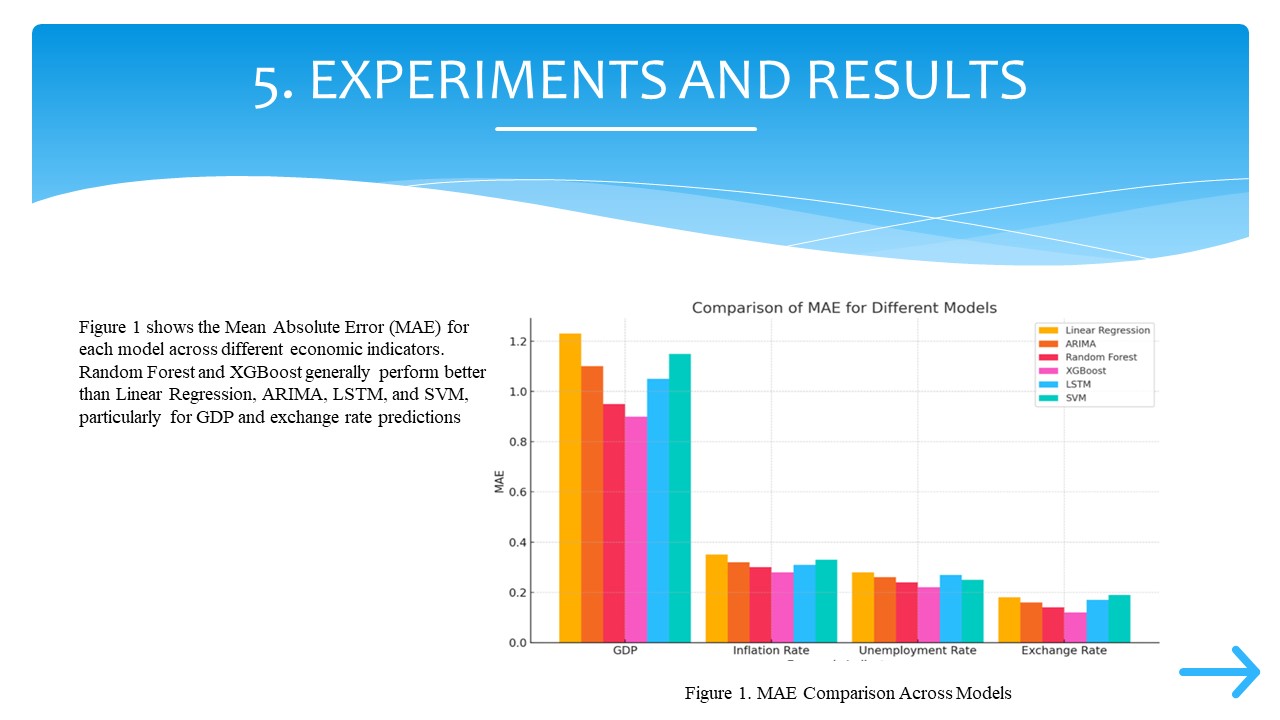 |
Figure 1 presents a graph illustrating the previously discussed figures.
|
|
ICACT20250097 Slide.11
[Big slide for presentation]
|
Chrome Text-to-Speach Click!! |
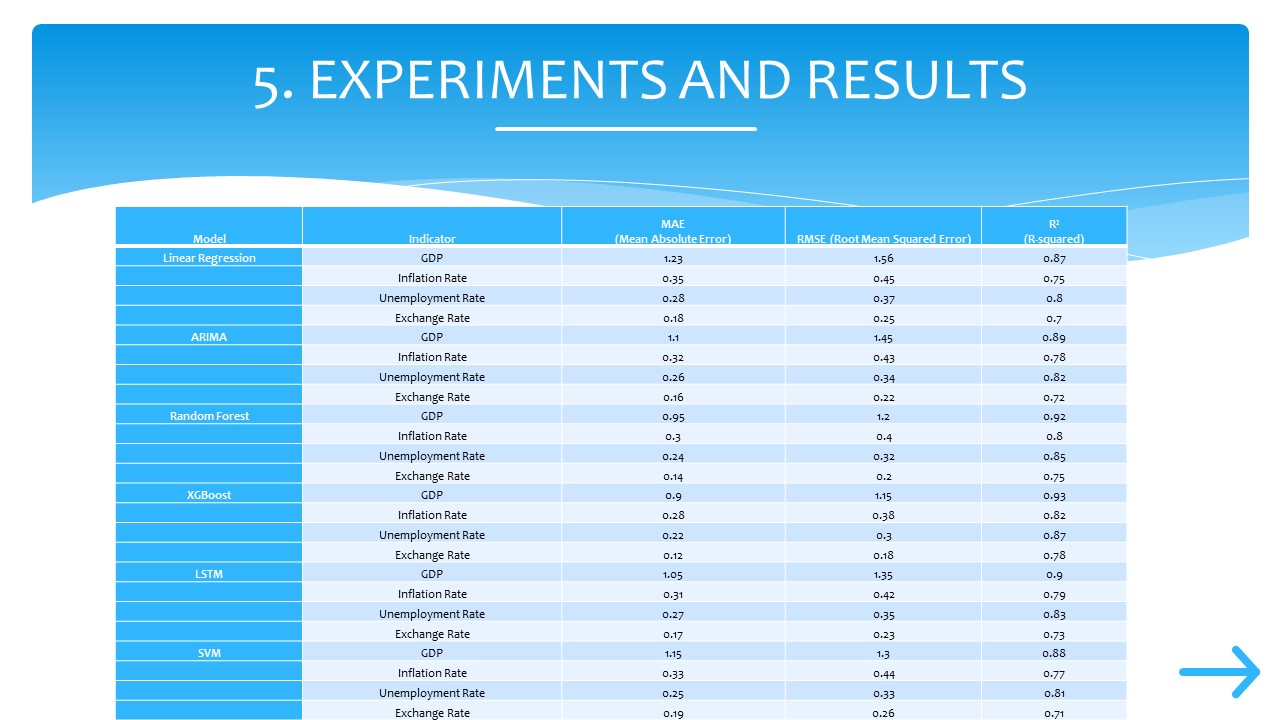 |
table shows the Mean Absolute Error (MAE) for each model across different economic indicators.
Random Forest and XGBoost outperform Linear Regression, ARIMA, LSTM, and SVM.
XGBoost, in particular, has the lowest error rates, making it the most reliable model for forecasting economic indicators.
the Root Mean Squared Error (RMSE) across different models.
XGBoost achieves the lowest RMSE for GDP, inflation, and unemployment rate predictions.
This suggests that XGBoost provides highly accurate forecasts for macroeconomic indicators.
Table presents the R-squared (R²) values for each model.
Higher R² values indicate better model fit to the actual data.
Random Forest and XGBoost consistently show the highest R² values, further confirming their effectiveness in economic forecasting.
|
|
ICACT20250097 Slide.10
[Big slide for presentation]
|
Chrome Text-to-Speach Click!! |
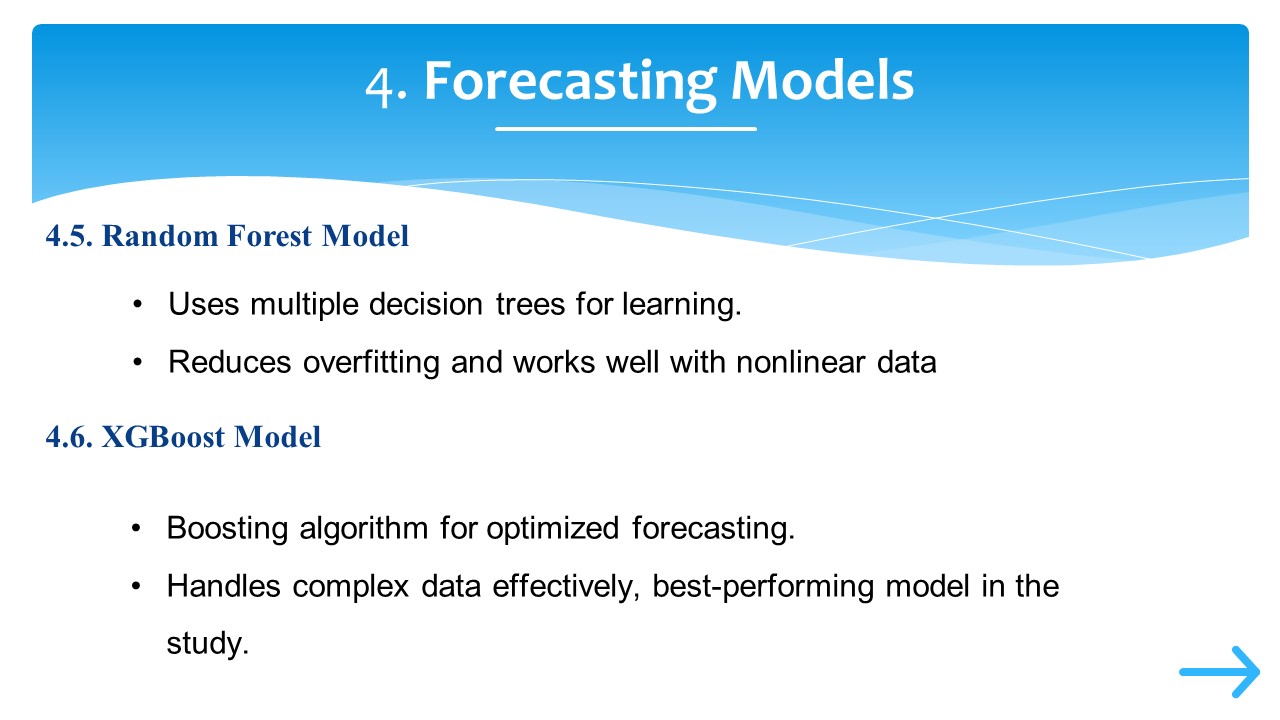 |
Random Forest is an ensemble learning technique that combines multiple decision trees to improve accuracy and reduce overfitting.
It performs well with nonlinear data.
It is more robust than linear models but can still struggle with highly volatile economic variables.
XGBoost is a boosting algorithm known for its efficiency and high performance in predictive modeling.
It optimizes forecasting by sequentially improving weak models.
Our study found that XGBoost outperforms other models in predicting GDP, inflation, unemployment, and exchange rates.
|
|
ICACT20250097 Slide.09
[Big slide for presentation]
|
Chrome Text-to-Speach Click!! |
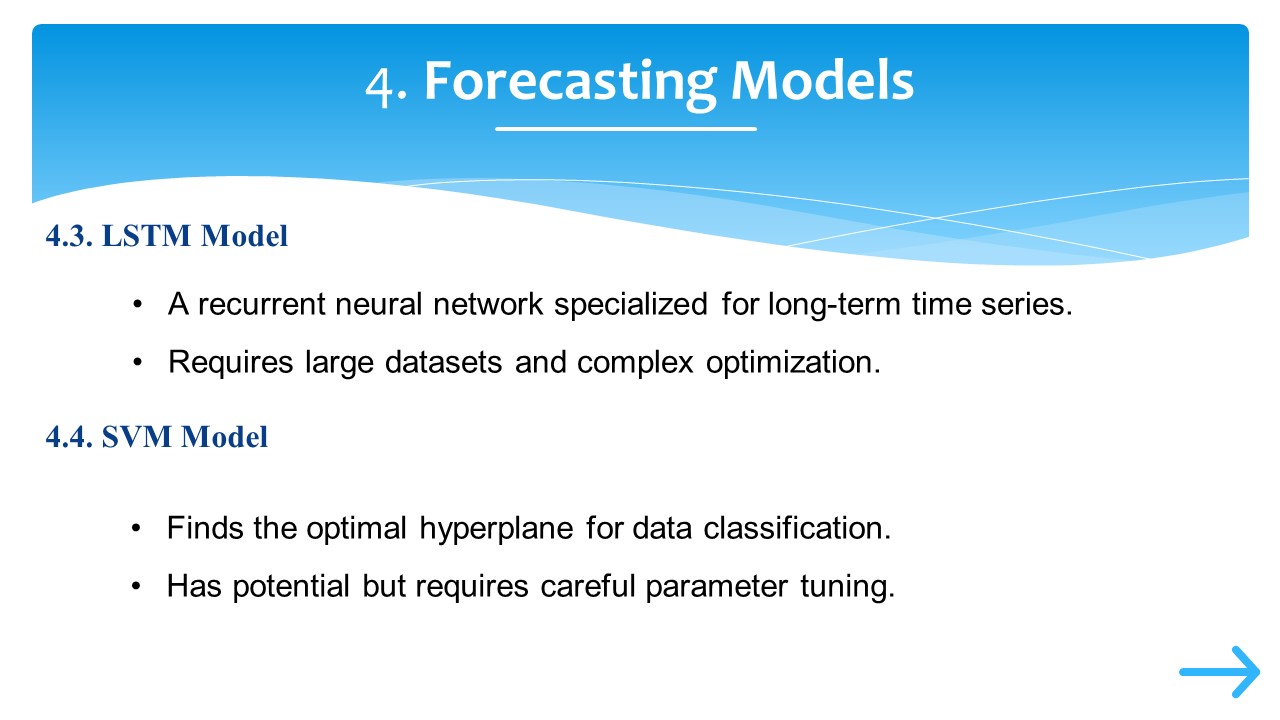 |
Long Short-Term Memory (LSTM) is a deep learning-based recurrent neural network designed for sequential data.
It is well-suited for long-term economic forecasting.
However, LSTM requires large datasets and extensive computational power for optimization.
Despite its potential, LSTM's complexity makes it challenging to implement compared to other models.
SVM is a powerful classification and regression model that finds the optimal hyperplane to separate data points.
It has potential in economic forecasting but requires careful parameter tuning.
While SVM can handle complex data patterns, its performance varies depending on the dataset characteristics.
|
|
ICACT20250097 Slide.08
[Big slide for presentation]
|
Chrome Text-to-Speach Click!! |
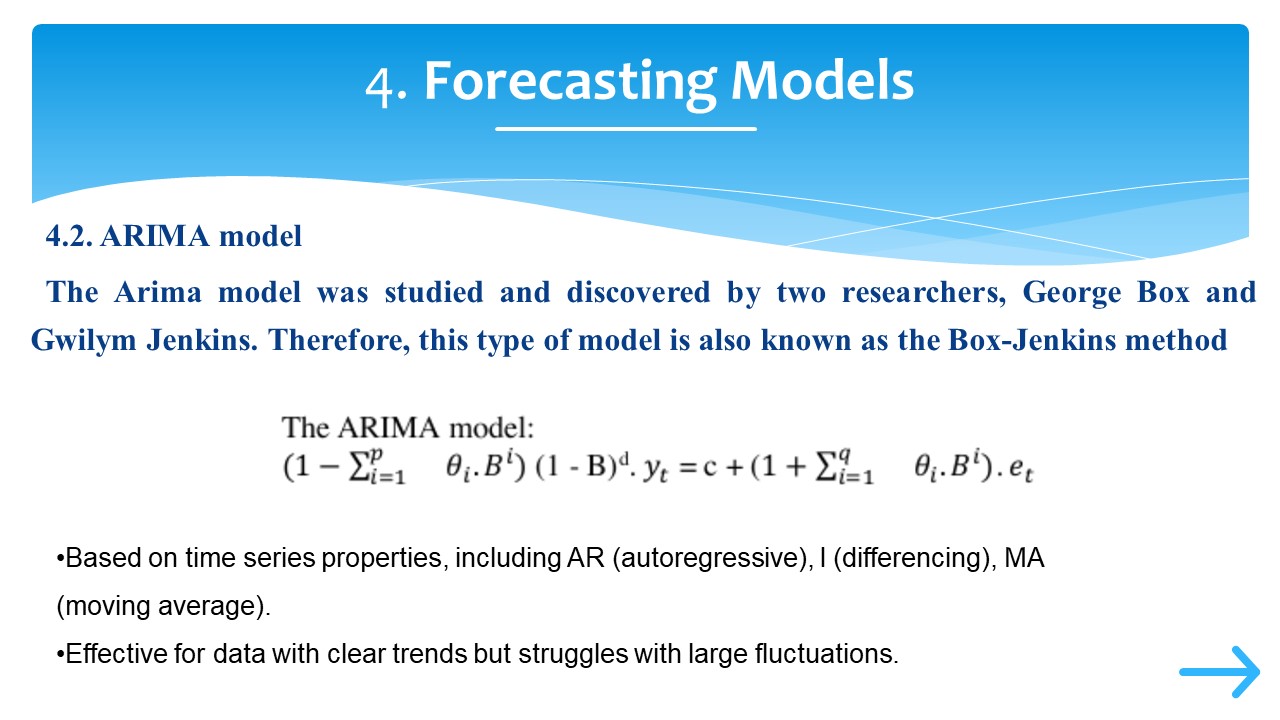 |
ARIMA, or the Box-Jenkins method, is a traditional time series forecasting approach that includes:
AR (Autoregressive) using past values,
I (Differencing) removing trends, and
MA (Moving Average) smoothing out fluctuations.
While effective for structured time series data, ARIMA struggles with large fluctuations and nonlinear economic trends.
|
|
ICACT20250097 Slide.07
[Big slide for presentation]
|
Chrome Text-to-Speach Click!! |
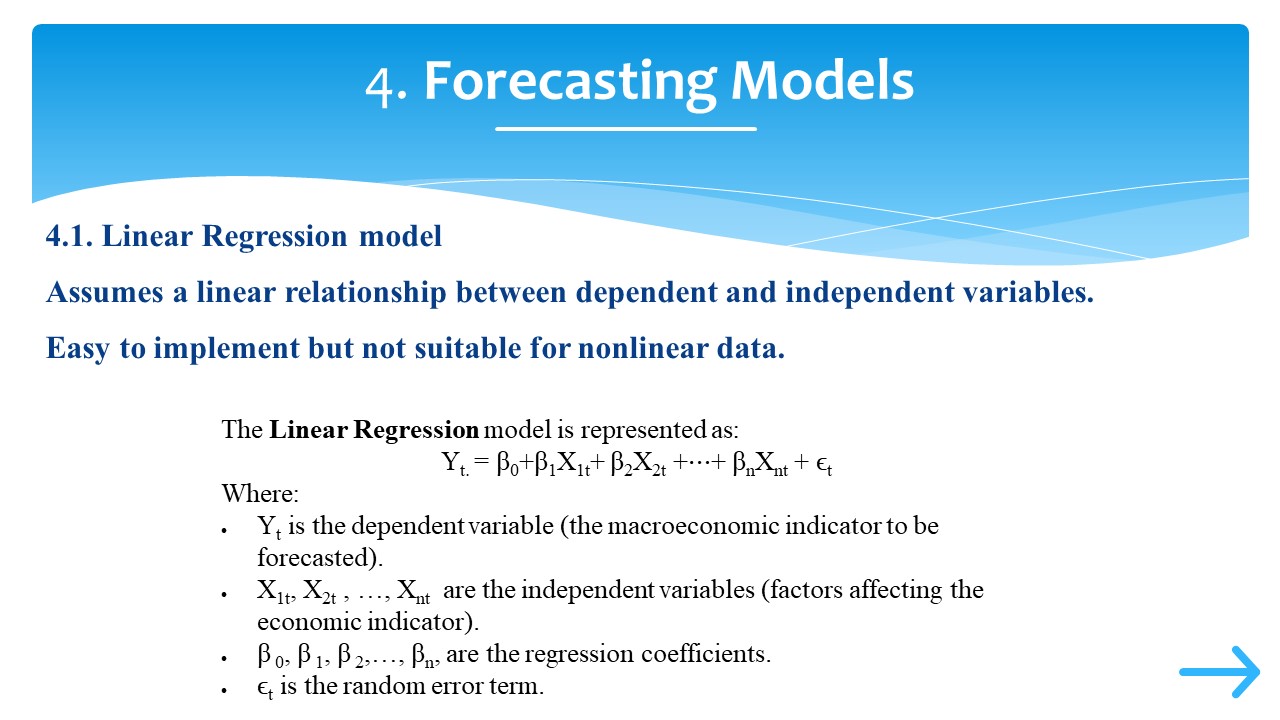 |
Linear Regression assumes a linear relationship between economic indicators and their influencing factors.
It is simple and easy to implement, but it lacks the ability to capture complex and nonlinear patterns in economic data.
The general formula of the Linear Regression model is on this slide.
where Y is the macroeconomic indicator, X represents independent variables, and β are the regression coefficients.
|
|
ICACT20250097 Slide.06
[Big slide for presentation]
|
Chrome Text-to-Speach Click!! |
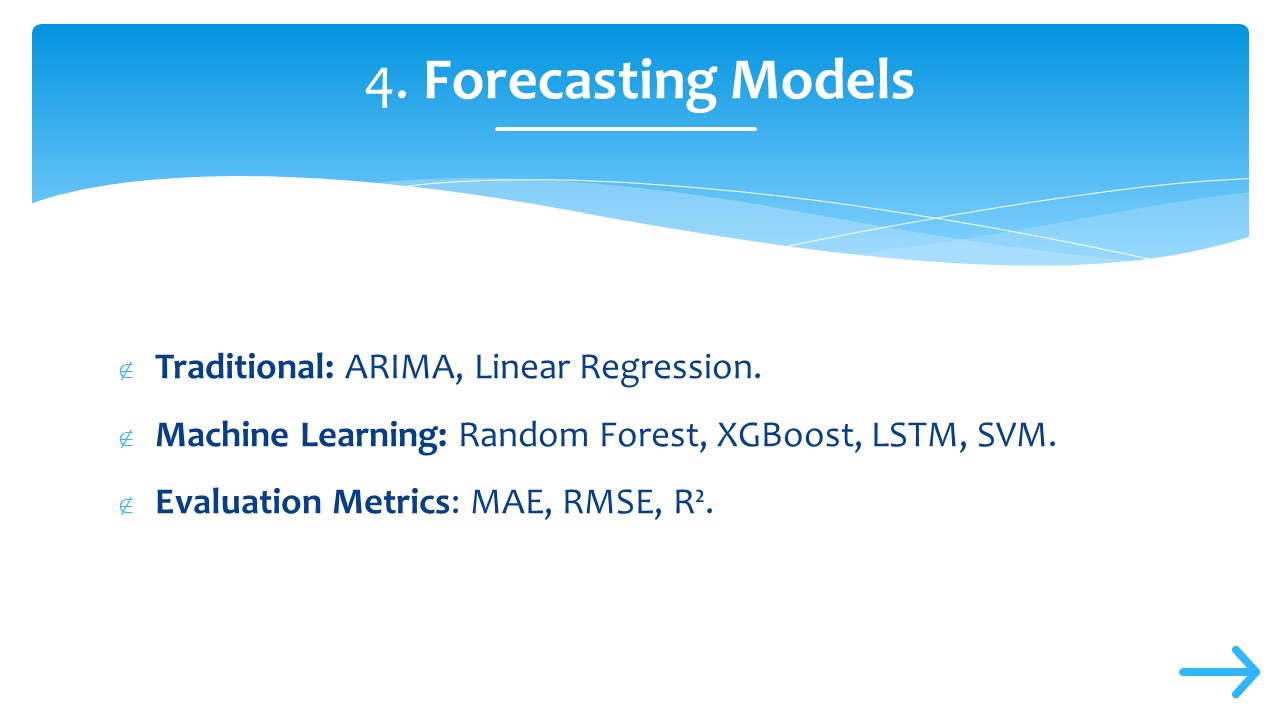 |
We analyzed both traditional and machine learning models for economic forecasting:
Traditional Models such as ARIMA and Linear Regression.
Machine Learning Models such as Random Forest, XGBoost, LSTM, and SVM.
To evaluate model performance, we used the following metrics:
Mean Absolute Error (MAE),
Root Mean Squared Error (RMSE), and
R-squared (R²).
Now, let’s briefly discuss each model.
|
|
ICACT20250097 Slide.05
[Big slide for presentation]
|
Chrome Text-to-Speach Click!! |
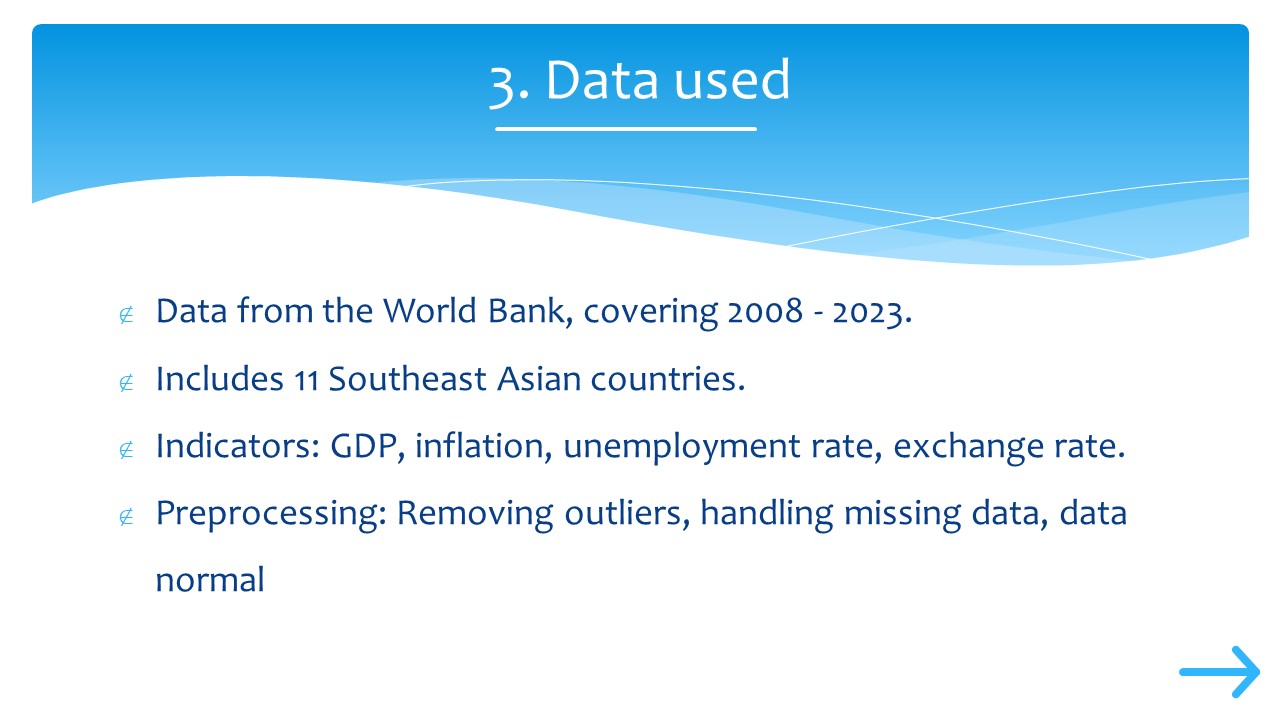 |
In this study, we used data from the World Bank covering the period from 2008 to 2023.
The dataset includes 11 Southeast Asian countries.
We considered key macroeconomic indicators such as GDP, inflation, unemployment rate, and exchange rate.
Data preprocessing steps involved handling missing values, removing outliers, and normalizing the data to ensure accuracy and consistency.
|
|
ICACT20250097 Slide.04
[Big slide for presentation]
|
Chrome Text-to-Speach Click!! |
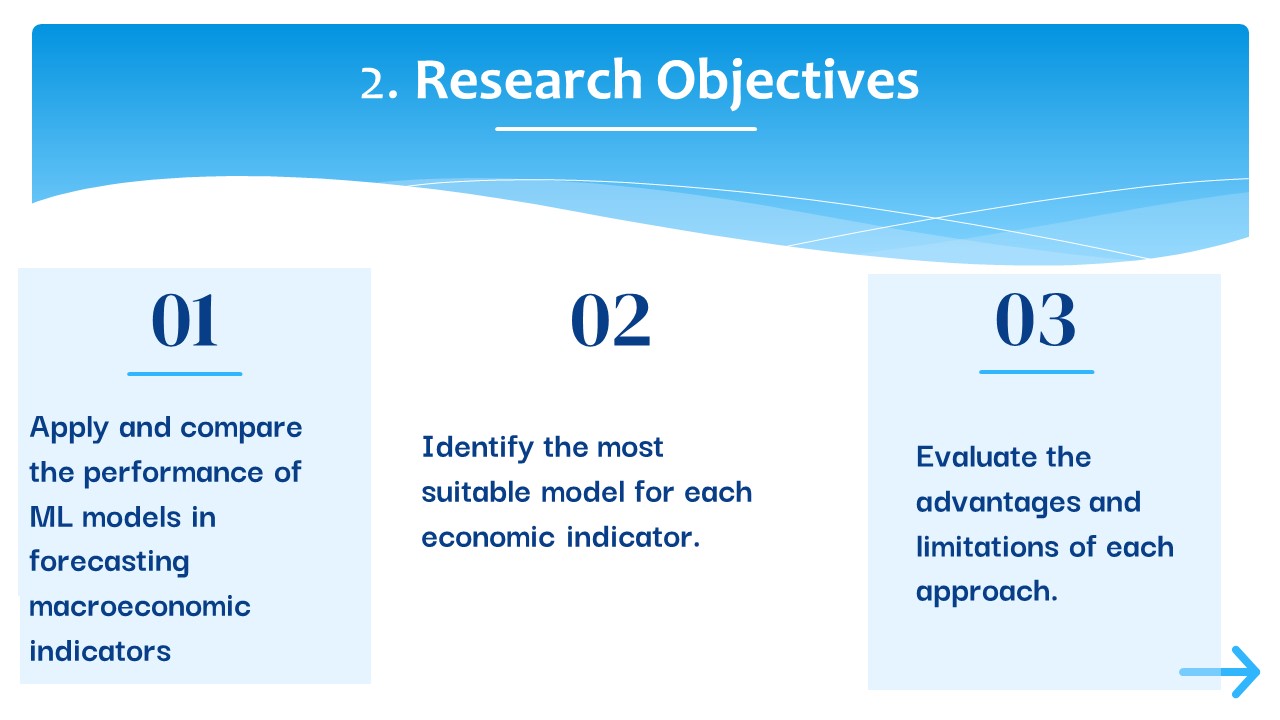 |
Our research has three main objectives.
The first is to apply and compare the performance of machine learning models in forecasting macroeconomic indicators.
The second is to identify the most suitable model for each economic indicator.
The third is to evaluate the advantages and limitations of each forecasting approach.
By achieving these objectives, we aim to contribute to the improvement of economic forecasting techniques.
|
|
ICACT20250097 Slide.03
[Big slide for presentation]
|
Chrome Text-to-Speach Click!! |
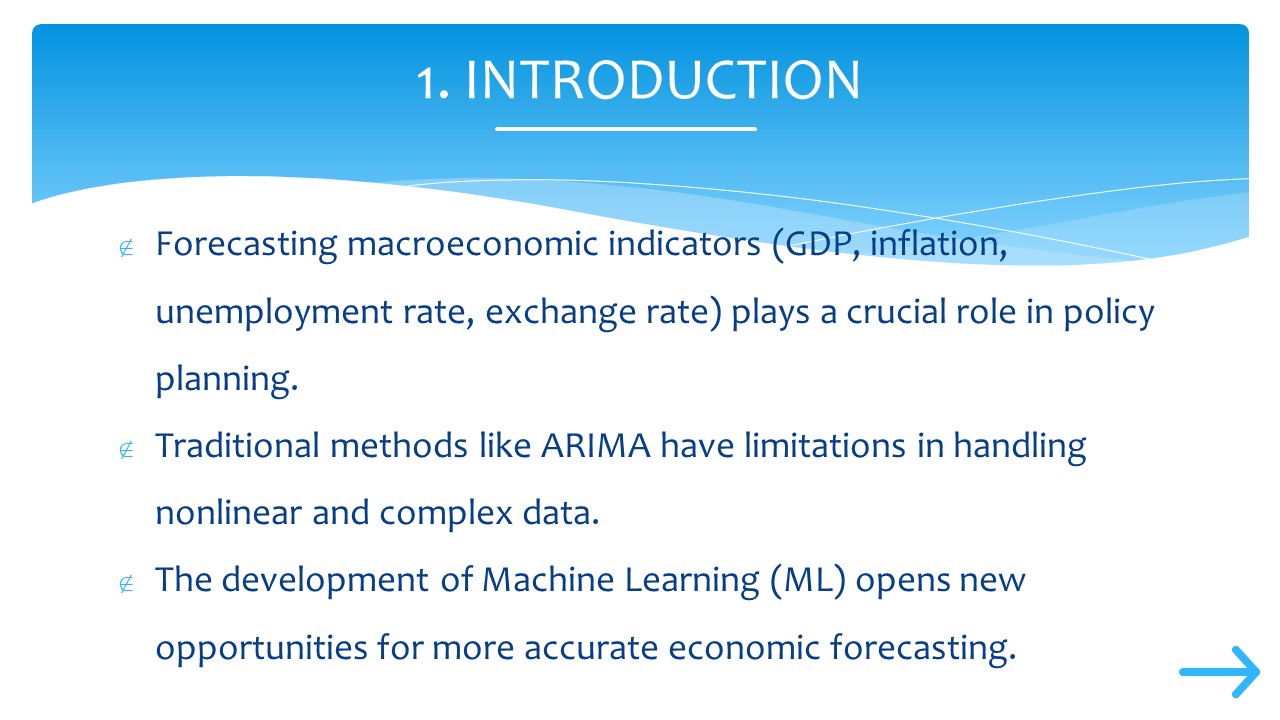 |
Accurate forecasting of macroeconomic indicators, such as GDP, inflation, unemployment rate, and exchange rate, is crucial for policy planning and economic decision-making.
Traditional models like ARIMA have been widely used, but they struggle to handle nonlinear and complex economic data. With the rise of machine learning, new opportunities have emerged to improve forecasting accuracy.
Our study investigates the effectiveness of machine learning models in predicting macroeconomic indicators and compares them with traditional approaches.
|
|
ICACT20250097 Slide.02
[Big slide for presentation]
|
Chrome Text-to-Speach Click!! |
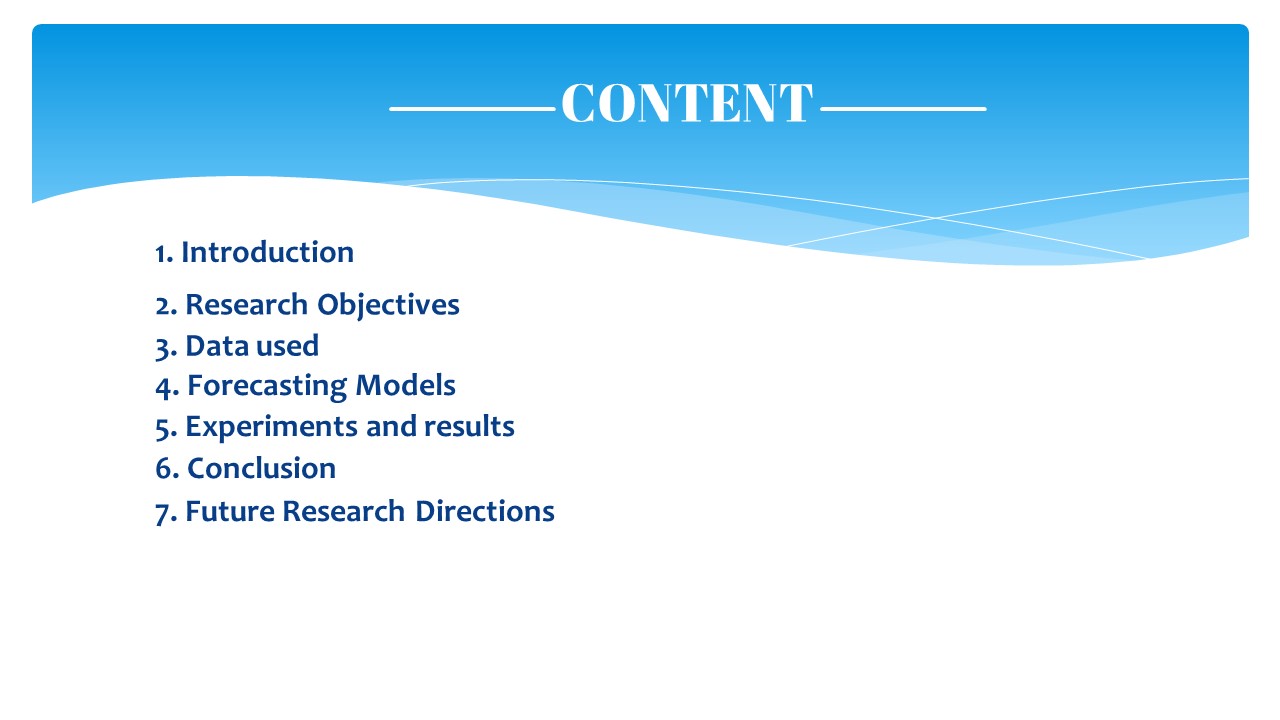 |
Today's presentation outline is as follows.
|
|
ICACT20250097 Slide.01
[Big slide for presentation]
[YouTube] |
Chrome Text-to-Speach Click!! |
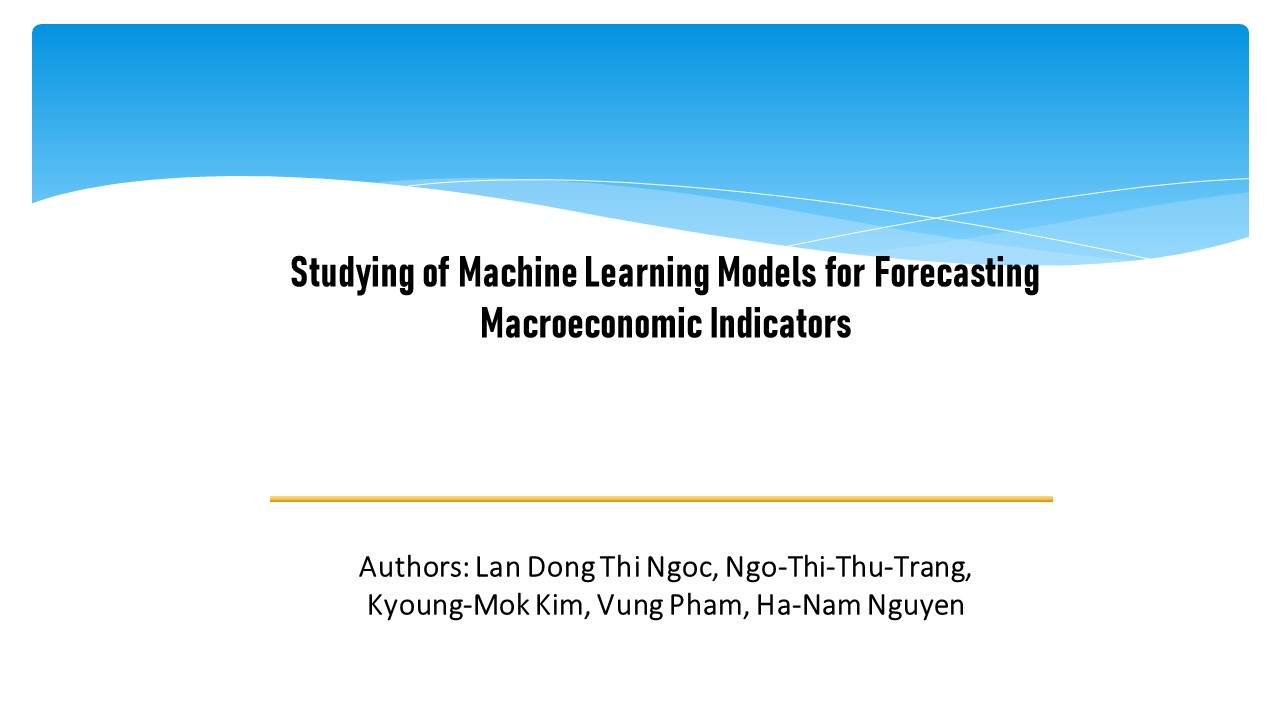 |
Good morning everyone. My name is Kyoung Mok Kim, and today, I am pleased to present our study titled Studying Machine Learning Models for Forecasting Macroeconomic Indicators. This research was conducted in collaboration with my co-authors: Lan Dong Thi Ngoc, Ngo-Thi-Thu-Trang, Vung Pham, and Ha-Nam Nguyen. In this presentation, I will walk you through our objectives, methodology, findings, and potential future research directions.
|
















