 ICACT20210130 Slide.15
[Big slide for presentation] |
Chrome Text-to-Speach Click!! |
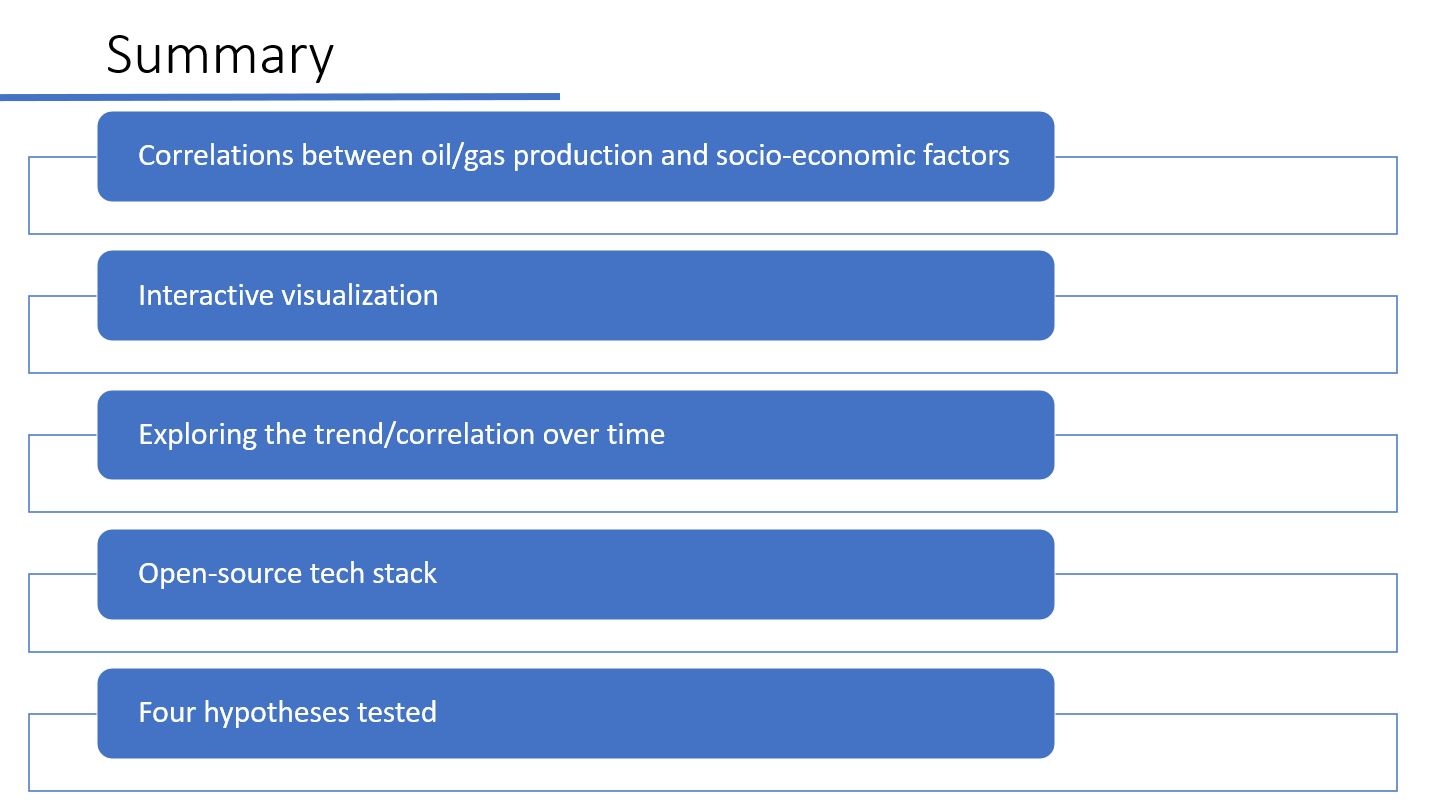 |
This study examined the correlations between oil/gas production information (production, location, and so on) and socio-economic factors with multiple datasets.
We set up an interactive visualization of oil/gas and all possible socio-economic factors in the same visualization interface.
We explored the trend and correlation over time (that is, performed time-series analysis) based on the oil/gas industry's historical data.
We generally utilized an open source tech stack for storage and visualization of oil/gas and socio-economics.
We adopted the methods of principal component analysis (PCA), linear regression, and random forest to examine the associations for the four hypotheses.
|
|
ICACT20210130 Slide.14
[Big slide for presentation]
|
Chrome Text-to-Speach Click!! |
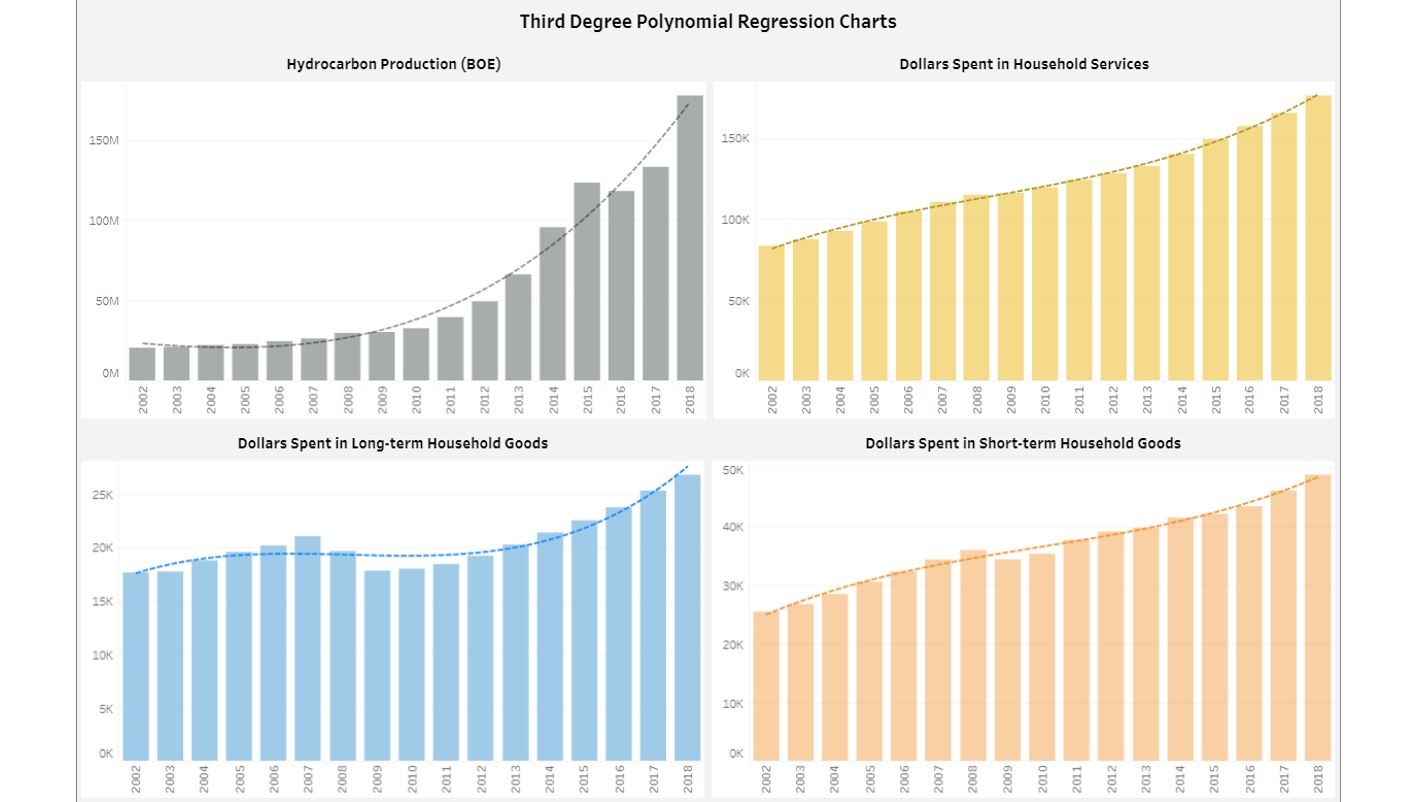 |
Four visualizations are shown for HC production, household services expenditures, and household long and short term goods. A third-degree polynomial regression model was fit for each dataset, versus time, using Tableau’s built-in features.
|
|
ICACT20210130 Slide.13
[Big slide for presentation]
|
Chrome Text-to-Speach Click!! |
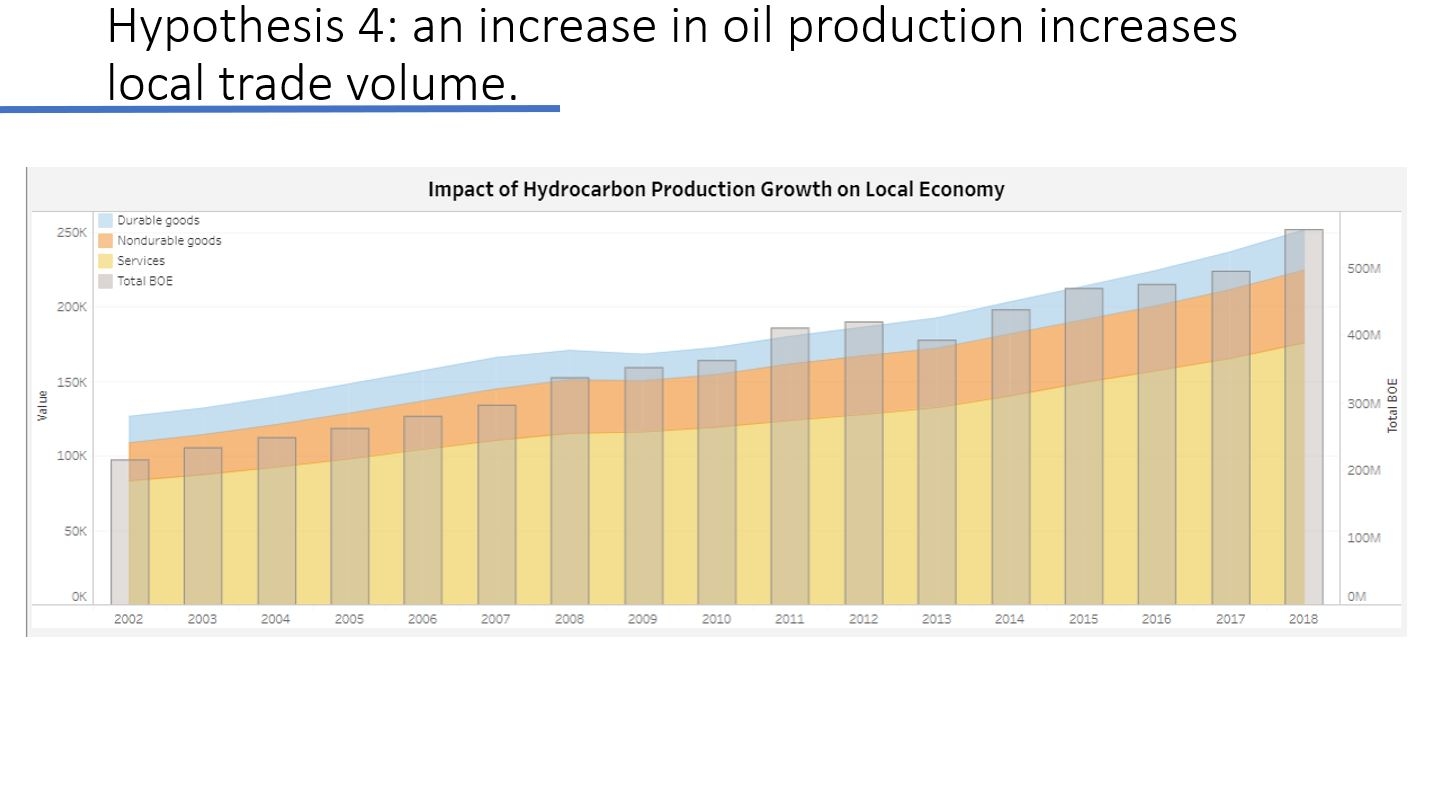 |
Our fourth hypothesis examined the statement that an increase in oil production increases local trade volume.
The figure shown here shows hydrocarbon production over time and services, non-durable goods, and durable goods plotted in the same visualization. We see a clear positive correlation b/w hydrocarbon production and services and goods.
|
|
ICACT20210130 Slide.12
[Big slide for presentation]
|
Chrome Text-to-Speach Click!! |
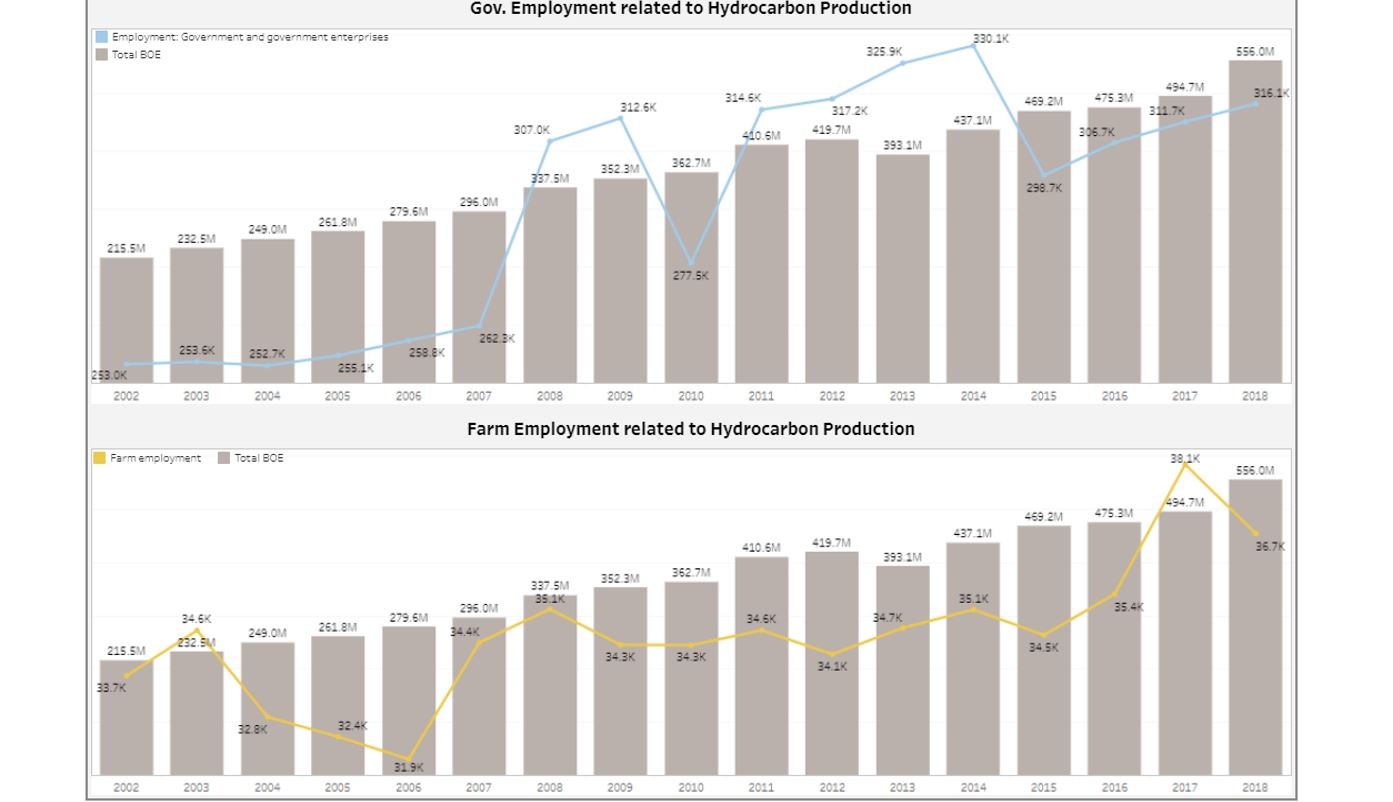 |
These visualizations show the hydrocarbon production’s correlation with govt employment and farm employment.
We did not investigate the details of why these sudden drops or spikes in govt employment and farm employment happened in certain years.
In general, both show increasing trends with hydrocarbon production, with occasional spikes and drops.
|
|
ICACT20210130 Slide.11
[Big slide for presentation]
|
Chrome Text-to-Speach Click!! |
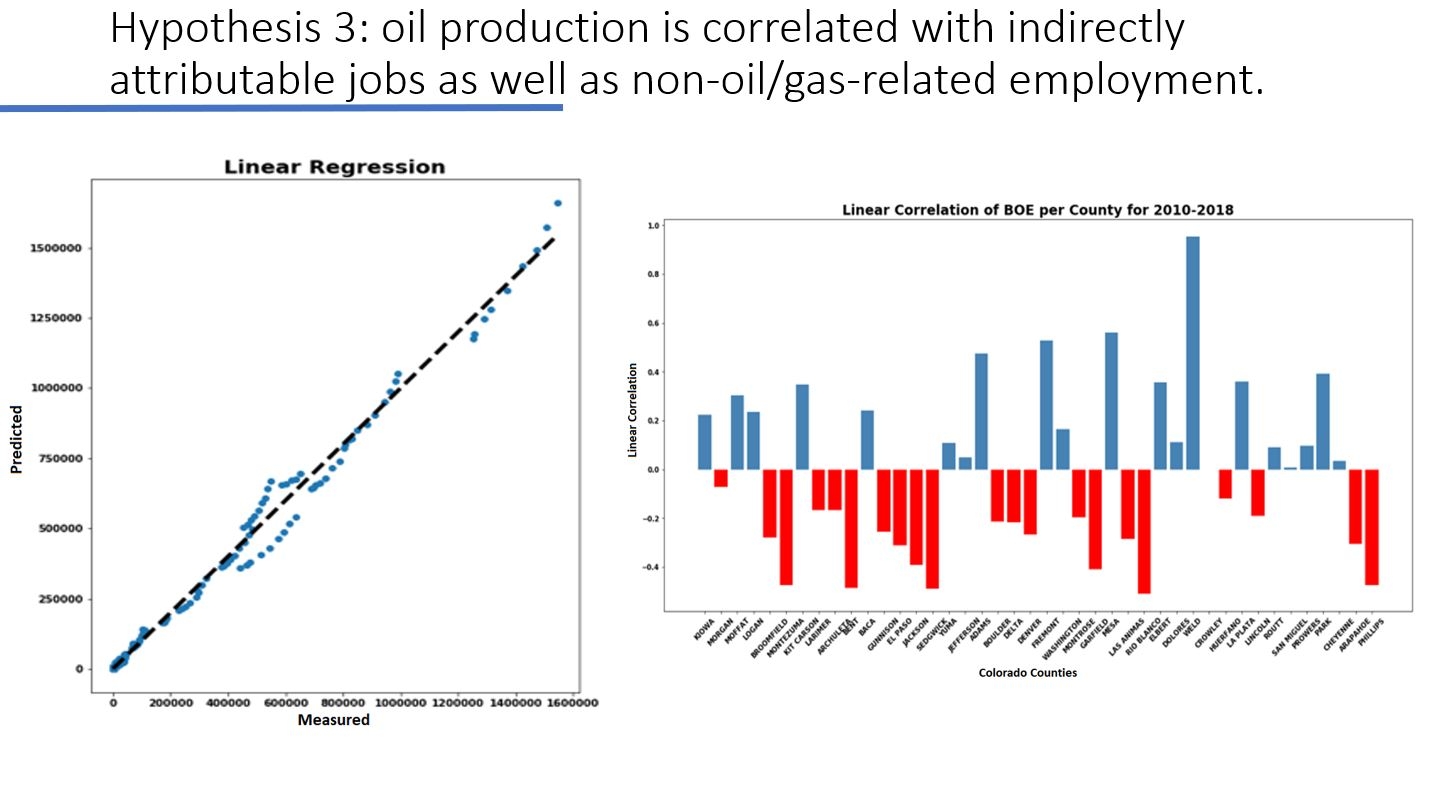 |
The third Hypothesis we tested was: oil production is correlated with indirectly attributable jobs and non-oil/gas-related employment.
Shown on the left is the Linear Regression result with indirect employment as the response variable.
Shown on the right is Pearson’s’ Linear Correlation of BOE with indirect employment for all Counties throughout 2010-2018. The x-axis labels are Colorado county names, while the y-axis label is “Linear Correlation.”
|
|
ICACT20210130 Slide.10
[Big slide for presentation]
|
Chrome Text-to-Speach Click!! |
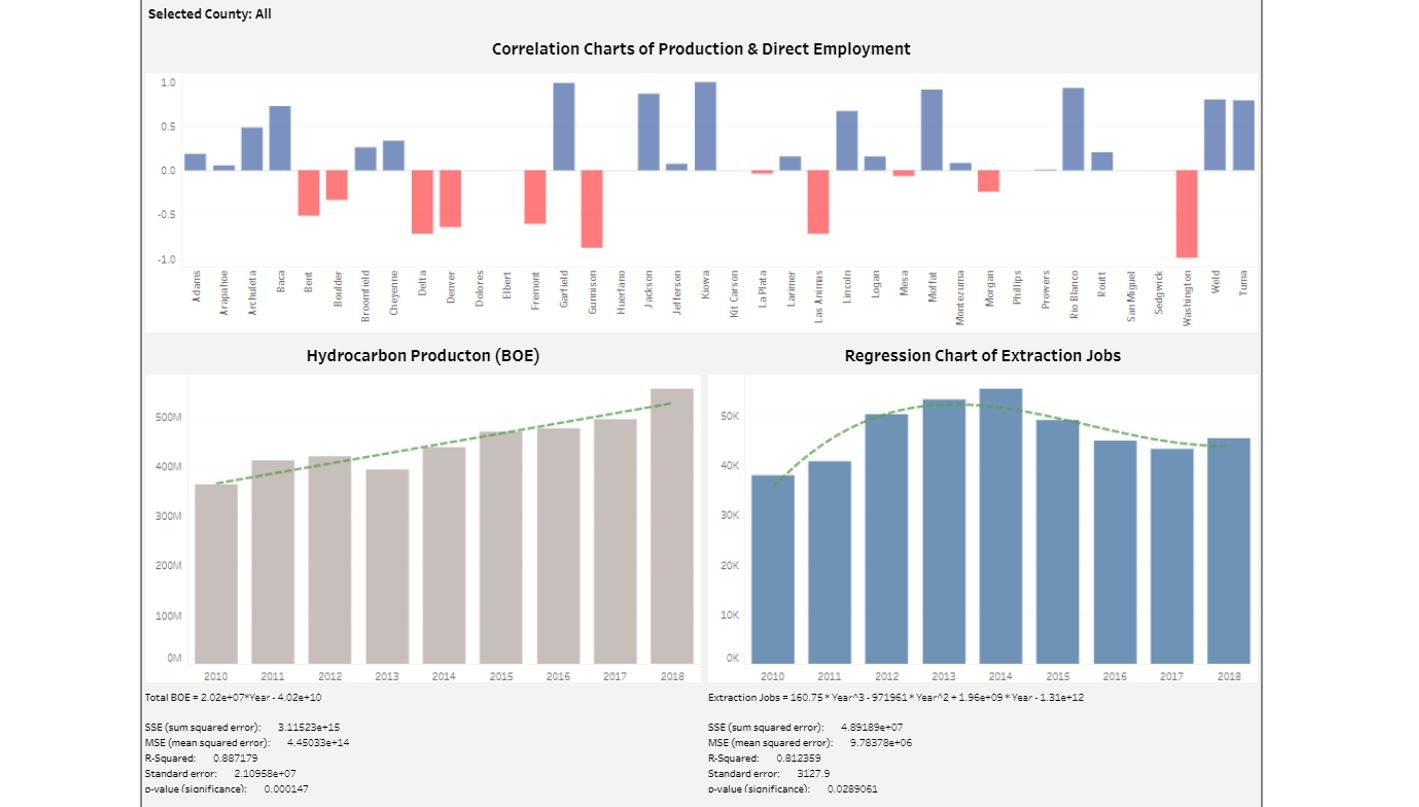 |
The top figure shows that the correlation b/w hydrocarbon production and direct employment is strong and positive for most counties.
The bottom two figures show the HC production and extraction industry jobs, along with regression models.
|
|
ICACT20210130 Slide.09
[Big slide for presentation]
|
Chrome Text-to-Speach Click!! |
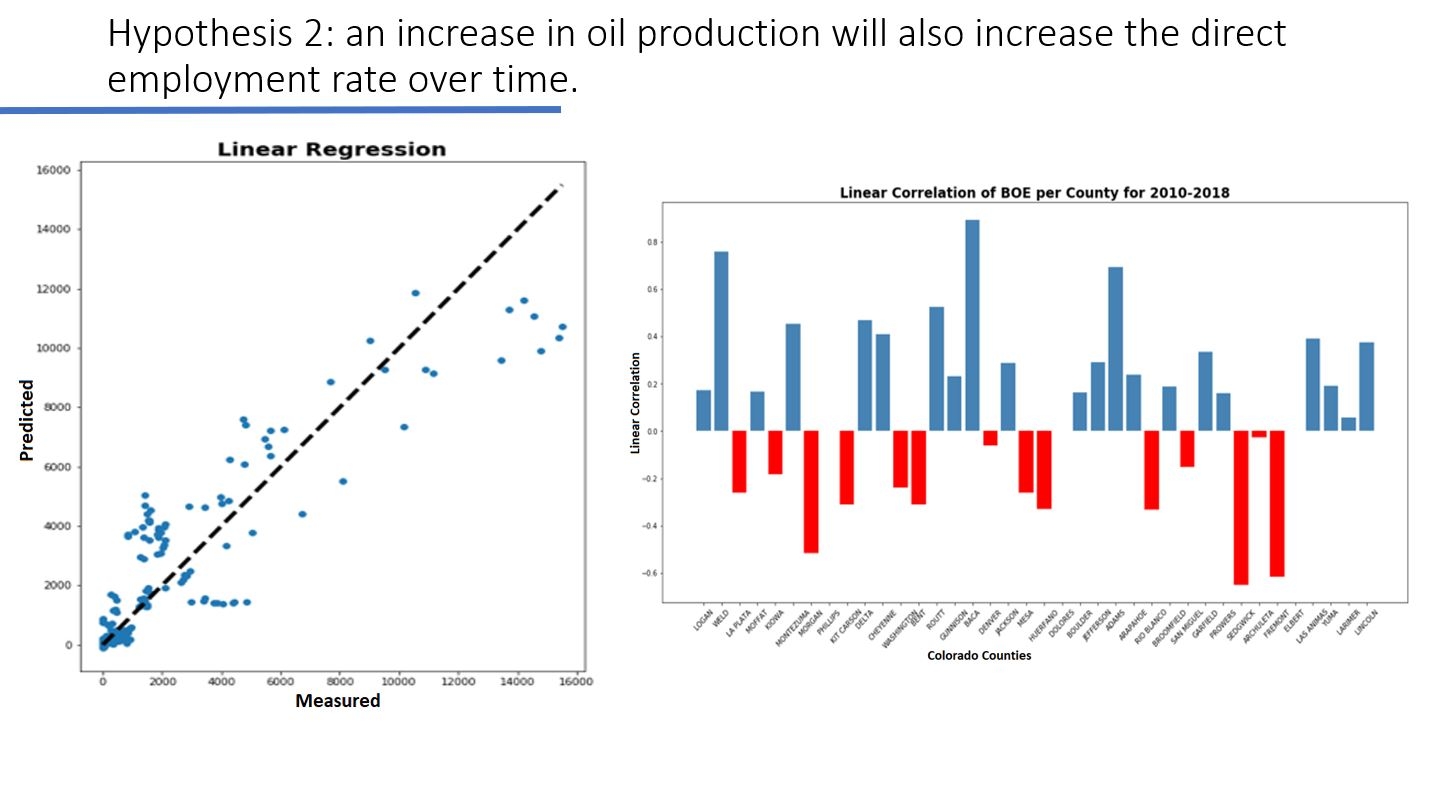 |
The figure on the left shows Linear Regression Result with direct employment as the response variable.
The figure on the right shows Pearson’s’ Linear Correlation of BOE with direct employment for all Counties throughout 2010-2018. The x-axis labels are Colorado county names, while the y-axis label is “Linear Correlation.”
Through various analyses, we conclude that direct employment is correlated with hydrocarbon production, and the strength of the correlation is related to the production volume for the oil producing counties.
|
|
ICACT20210130 Slide.08
[Big slide for presentation]
|
Chrome Text-to-Speach Click!! |
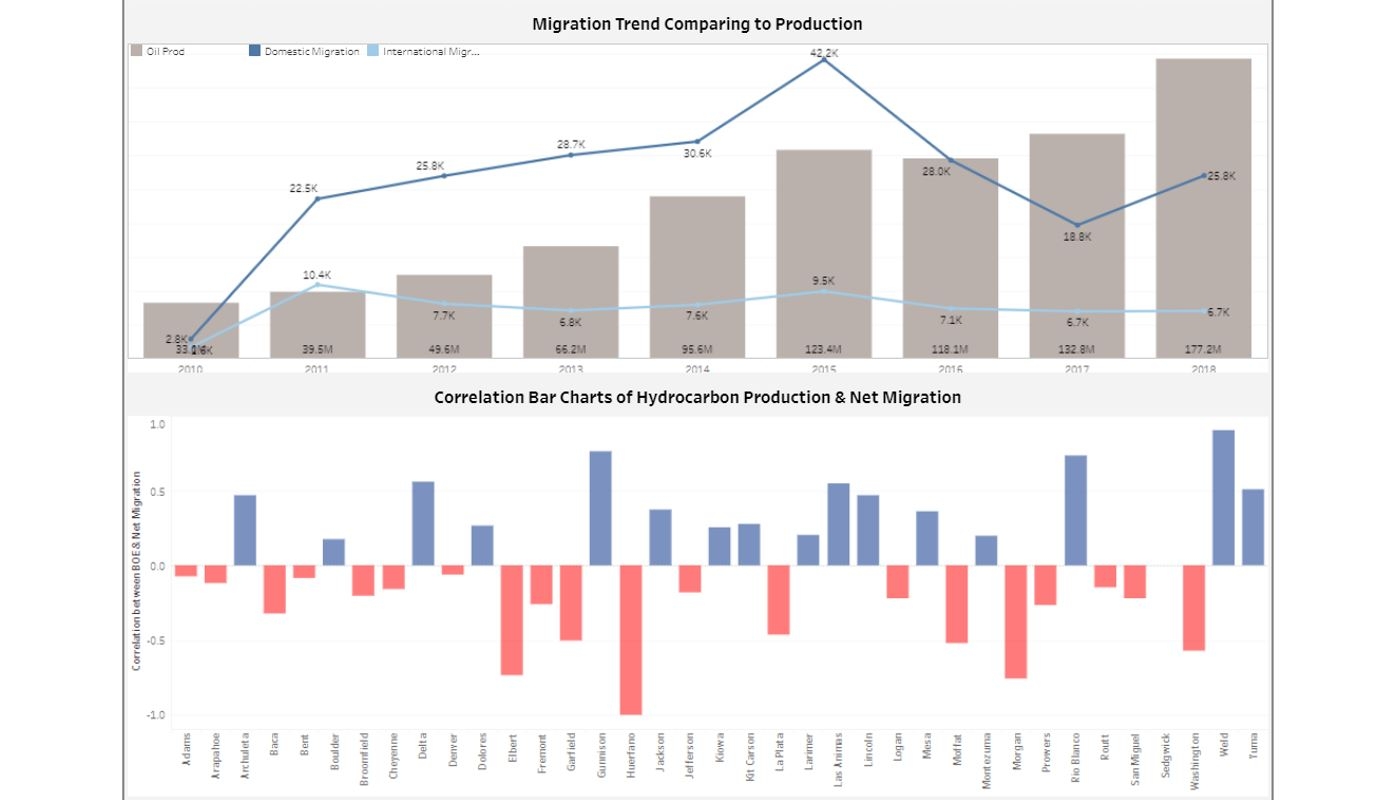 |
Two visualization analyses are shown here. The top figure compares domestic migration (deep blue) and international migration (light blue) with the oil production revenue. In general, it demonstrates a positive correlation.
The bottom figure shows Pearson correlations of hydrocarbon production and net migration, but the association's direction varied across different counties.
|
|
ICACT20210130 Slide.07
[Big slide for presentation]
|
Chrome Text-to-Speach Click!! |
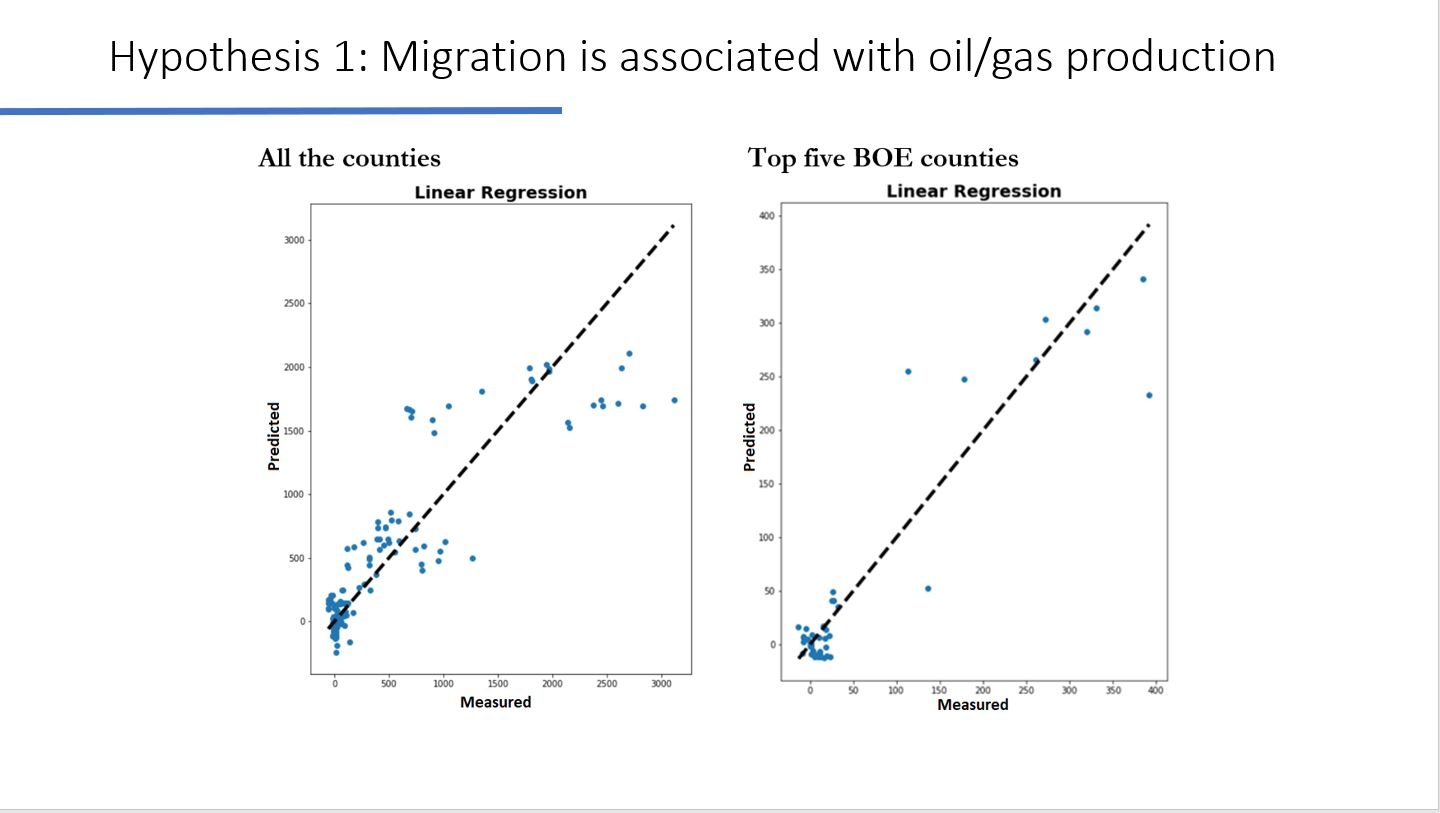 |
Shown here is the linear Regression result using all the counties (left image) versus only the top 5 producing counties shows that our hypothesis of migration and oil/gas production is associated. The model has an adjusted R-square of 0.845.
|
|
ICACT20210130 Slide.06
[Big slide for presentation]
|
Chrome Text-to-Speach Click!! |
 |
Next, let's move on to the hypotheses analyses. Overall, we established four hypotheses based on the data and previous research. They are: 1) migration is associated with oil/gas productions.
2) An increase in oil production will also increase the employment rate over time.
3) Oil production is correlated with indirectly attributable jobs as well as non-oil/gas-related employment.
4) Increase in oil production increases local trade volume.
|
|
ICACT20210130 Slide.05
[Big slide for presentation]
|
Chrome Text-to-Speach Click!! |
 |
Now, let’s go to the website to see a quick demo of the website features and the available visualizations.
On this home page, four analysis buttons link to additional pages of visualization.
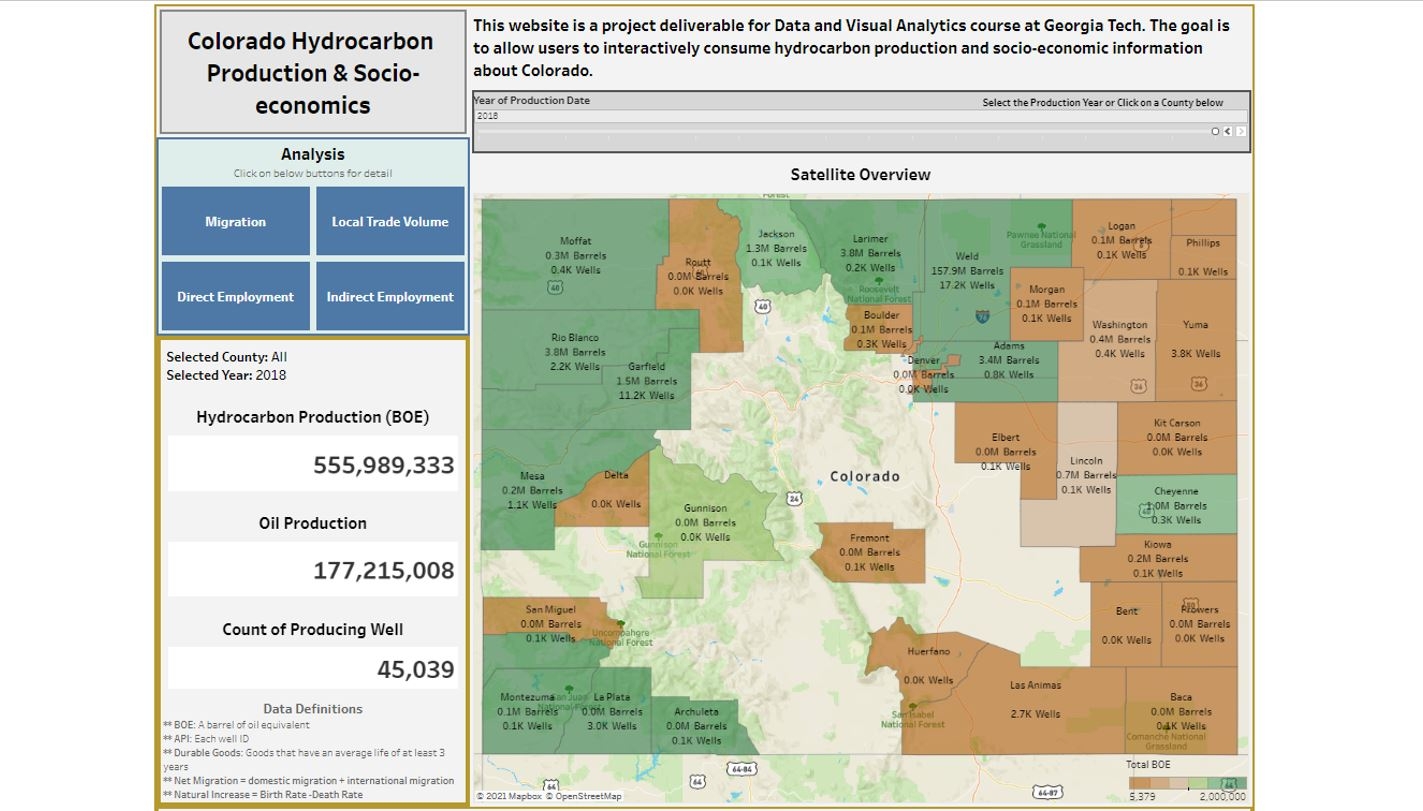
We see a satellite overview of Colorado state, with oil and gas production information and the number of hydrocarbon wells.
If we select one of the counties, the rest of the visualizations update to just that county.
On the migration page, the user can select the number of counties for which the visualization is shown. The default is the top 10 counties.
On the rest of the pages, similar interactive features are available to help the user navigate the data.
|
|
ICACT20210130 Slide.04
[Big slide for presentation]
|
Chrome Text-to-Speach Click!! |
 |
The O&G industry boom has stimulated local economic growth by creating employment opportunities, attracting migrants, and increasing local business investments.
Our initial attempt is to visualize correlations and trends in Colorado while possibly generalize it to the national and even international levels for further study.
No researcher has created any interactive visualizations to observe this concept using a combination of oil production data, census data, and employment data.
|
|
ICACT20210130 Slide.03
[Big slide for presentation]
|
Chrome Text-to-Speach Click!! |
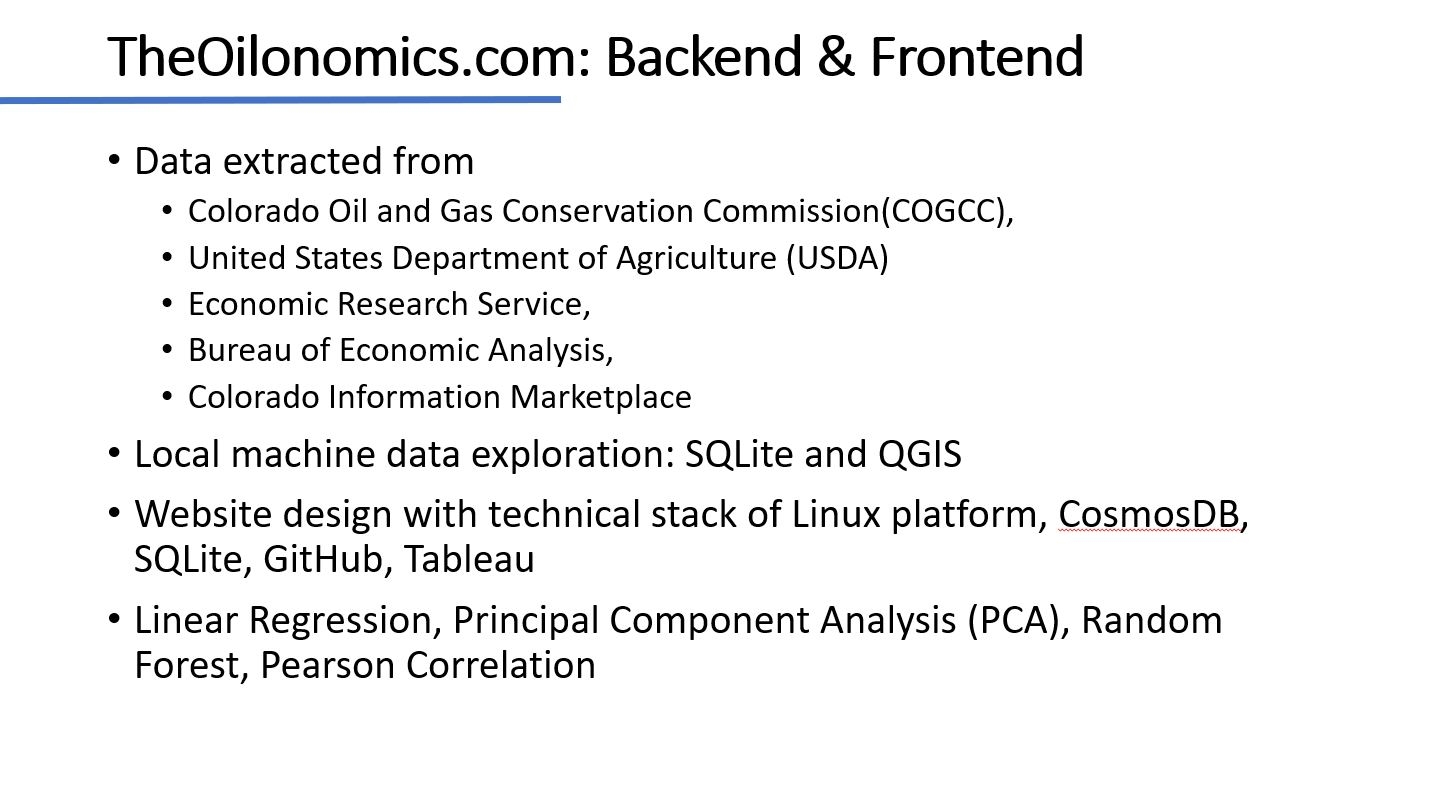 |
The team registered a domain to serve the visualizations (http://www.theoilonomics.com). The technology stack we have employed includes Azure offerings. The significant components are virtual machine instances (on Linux platform) and CosmosDB, an emulation of MongoDB for Azure, stored on a distributed cluster.
We extracted the county-level O&G production data from the Colorado Oil and Gas Conservation Commission (COGCC). Our approach is to merge this dataset with socio-economic data such as poverty, population, and employment record.
|
|
ICACT20210130 Slide.02
[Big slide for presentation]
|
Chrome Text-to-Speach Click!! |
 |
The development of the oil and gas industry has stimulated local economic growth by creating employment opportunities, attracting migrants, and increasing local business investments. While previous research shows controversial results of the oil and gas industry’s influence on the local society, very few studies concentrated on visualizing the effect of such influences and predicting the trends to serve business, local government, job seekers, and the public. This study, presented in this paper and shown at theoilonomics.com, demonstrates correlations between oil/gas production and the socio-economic variables over time with multiple massive data sets extracted from official websites.
|
|
ICACT20210130 Slide.01
[Big slide for presentation]
|
Chrome Text-to-Speach Click!! |
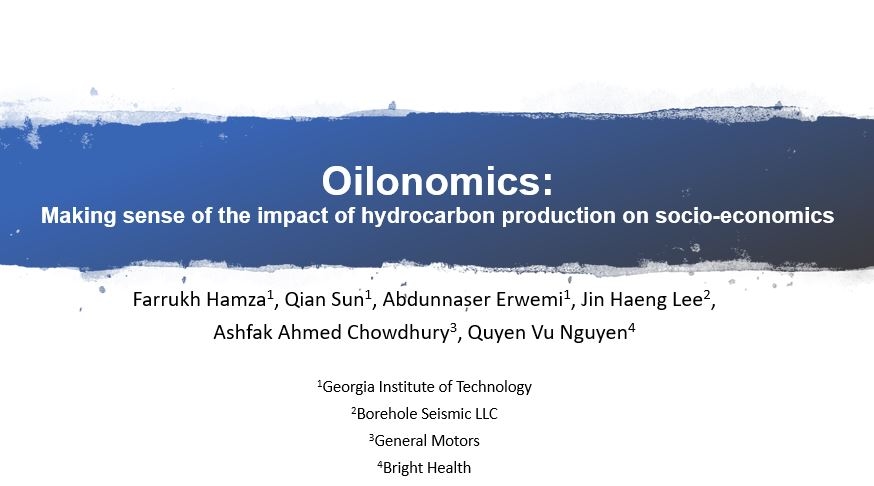 |
I am here to present to you, our project study, Oilonomics: Making sense of the impact of hydrocarbon production on socio-economics. My name is Farrukh Hamza, I am one of the co-authors of this study. My co-authors are Qian Sun, Abdunnaser Erwemi, Jin Haeng Lee, Ashfak Ahmed Chowdhury, and Quyen Vu Nguyen.
|
















