 ICACT20250232 Slide.17
[Big slide for presentation] |
Chrome Text-to-Speach Click!! |
 |
Thank You
|
|
ICACT20250232 Slide.16
[Big slide for presentation]
|
Chrome Text-to-Speach Click!! |
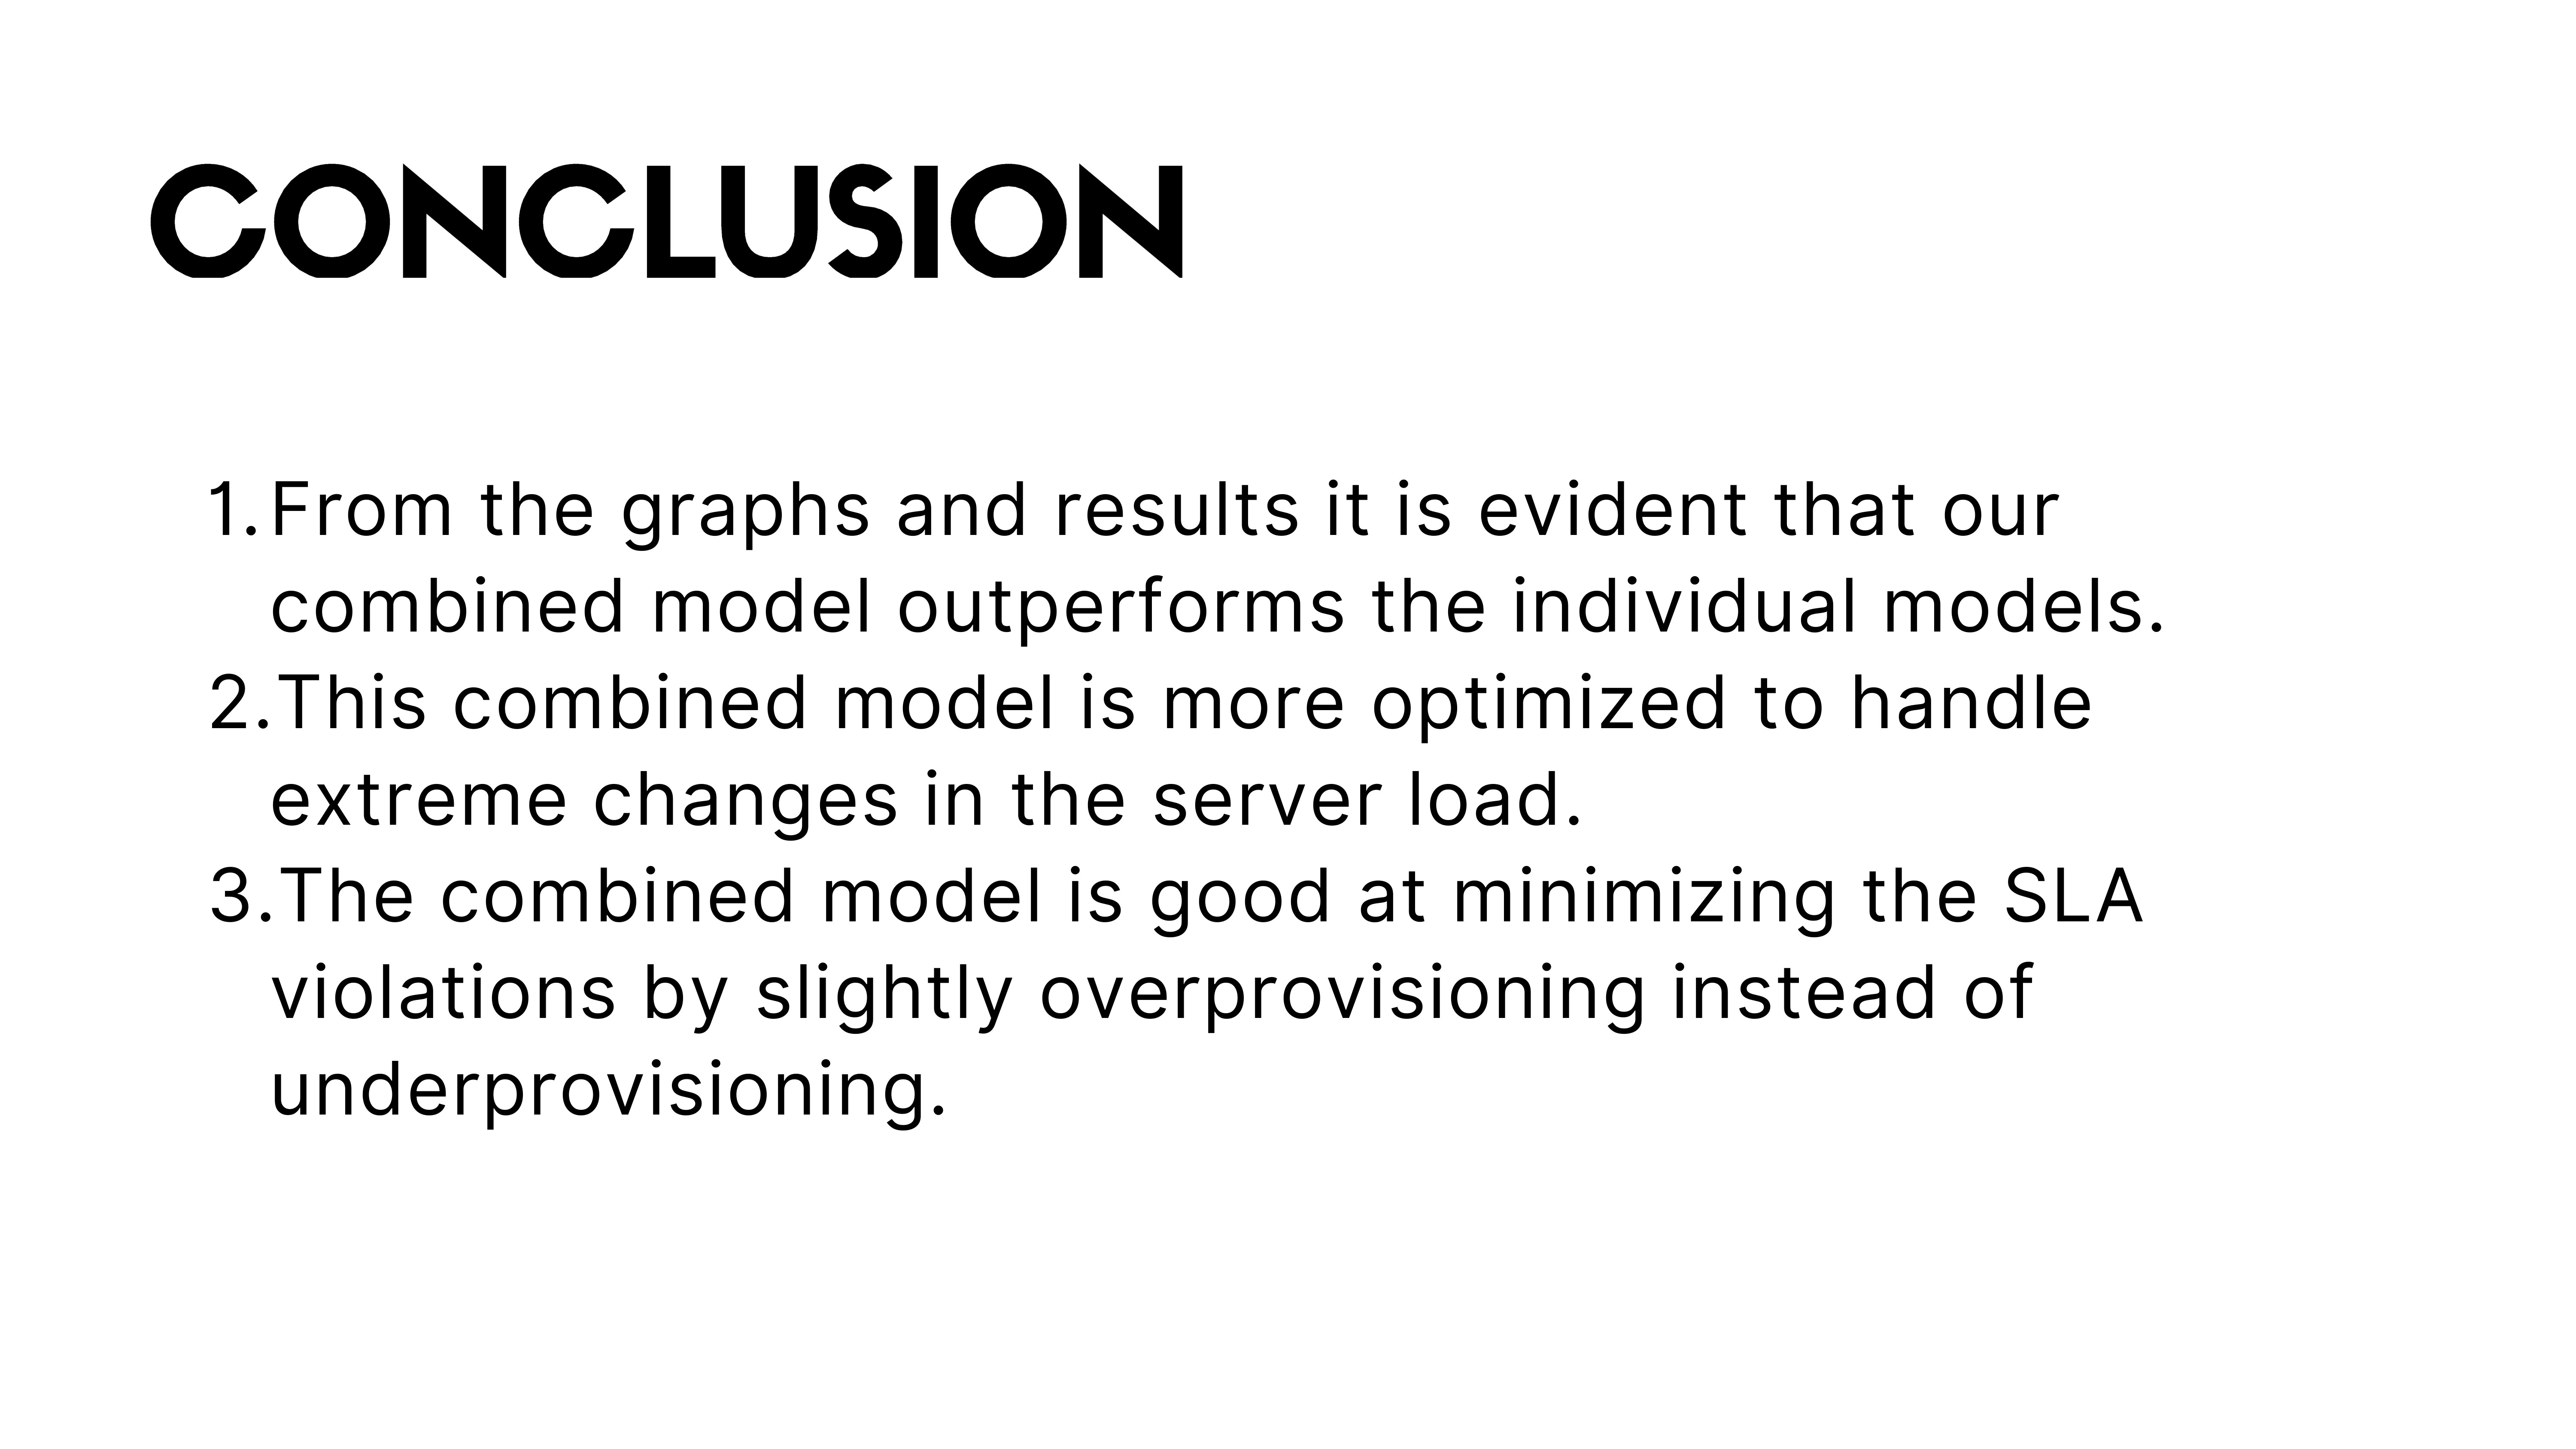 |
CONCLUSION
1. From the graphs and results it is evident that our combined model outperforms the individual models.
2. This combined model is more optimized to handle extreme changes in the server load.
3. The combined model is good at minimizing the SLA violations by slightly overprovisioning instead of underprovisioning.
|
|
ICACT20250232 Slide.15
[Big slide for presentation]
|
Chrome Text-to-Speach Click!! |
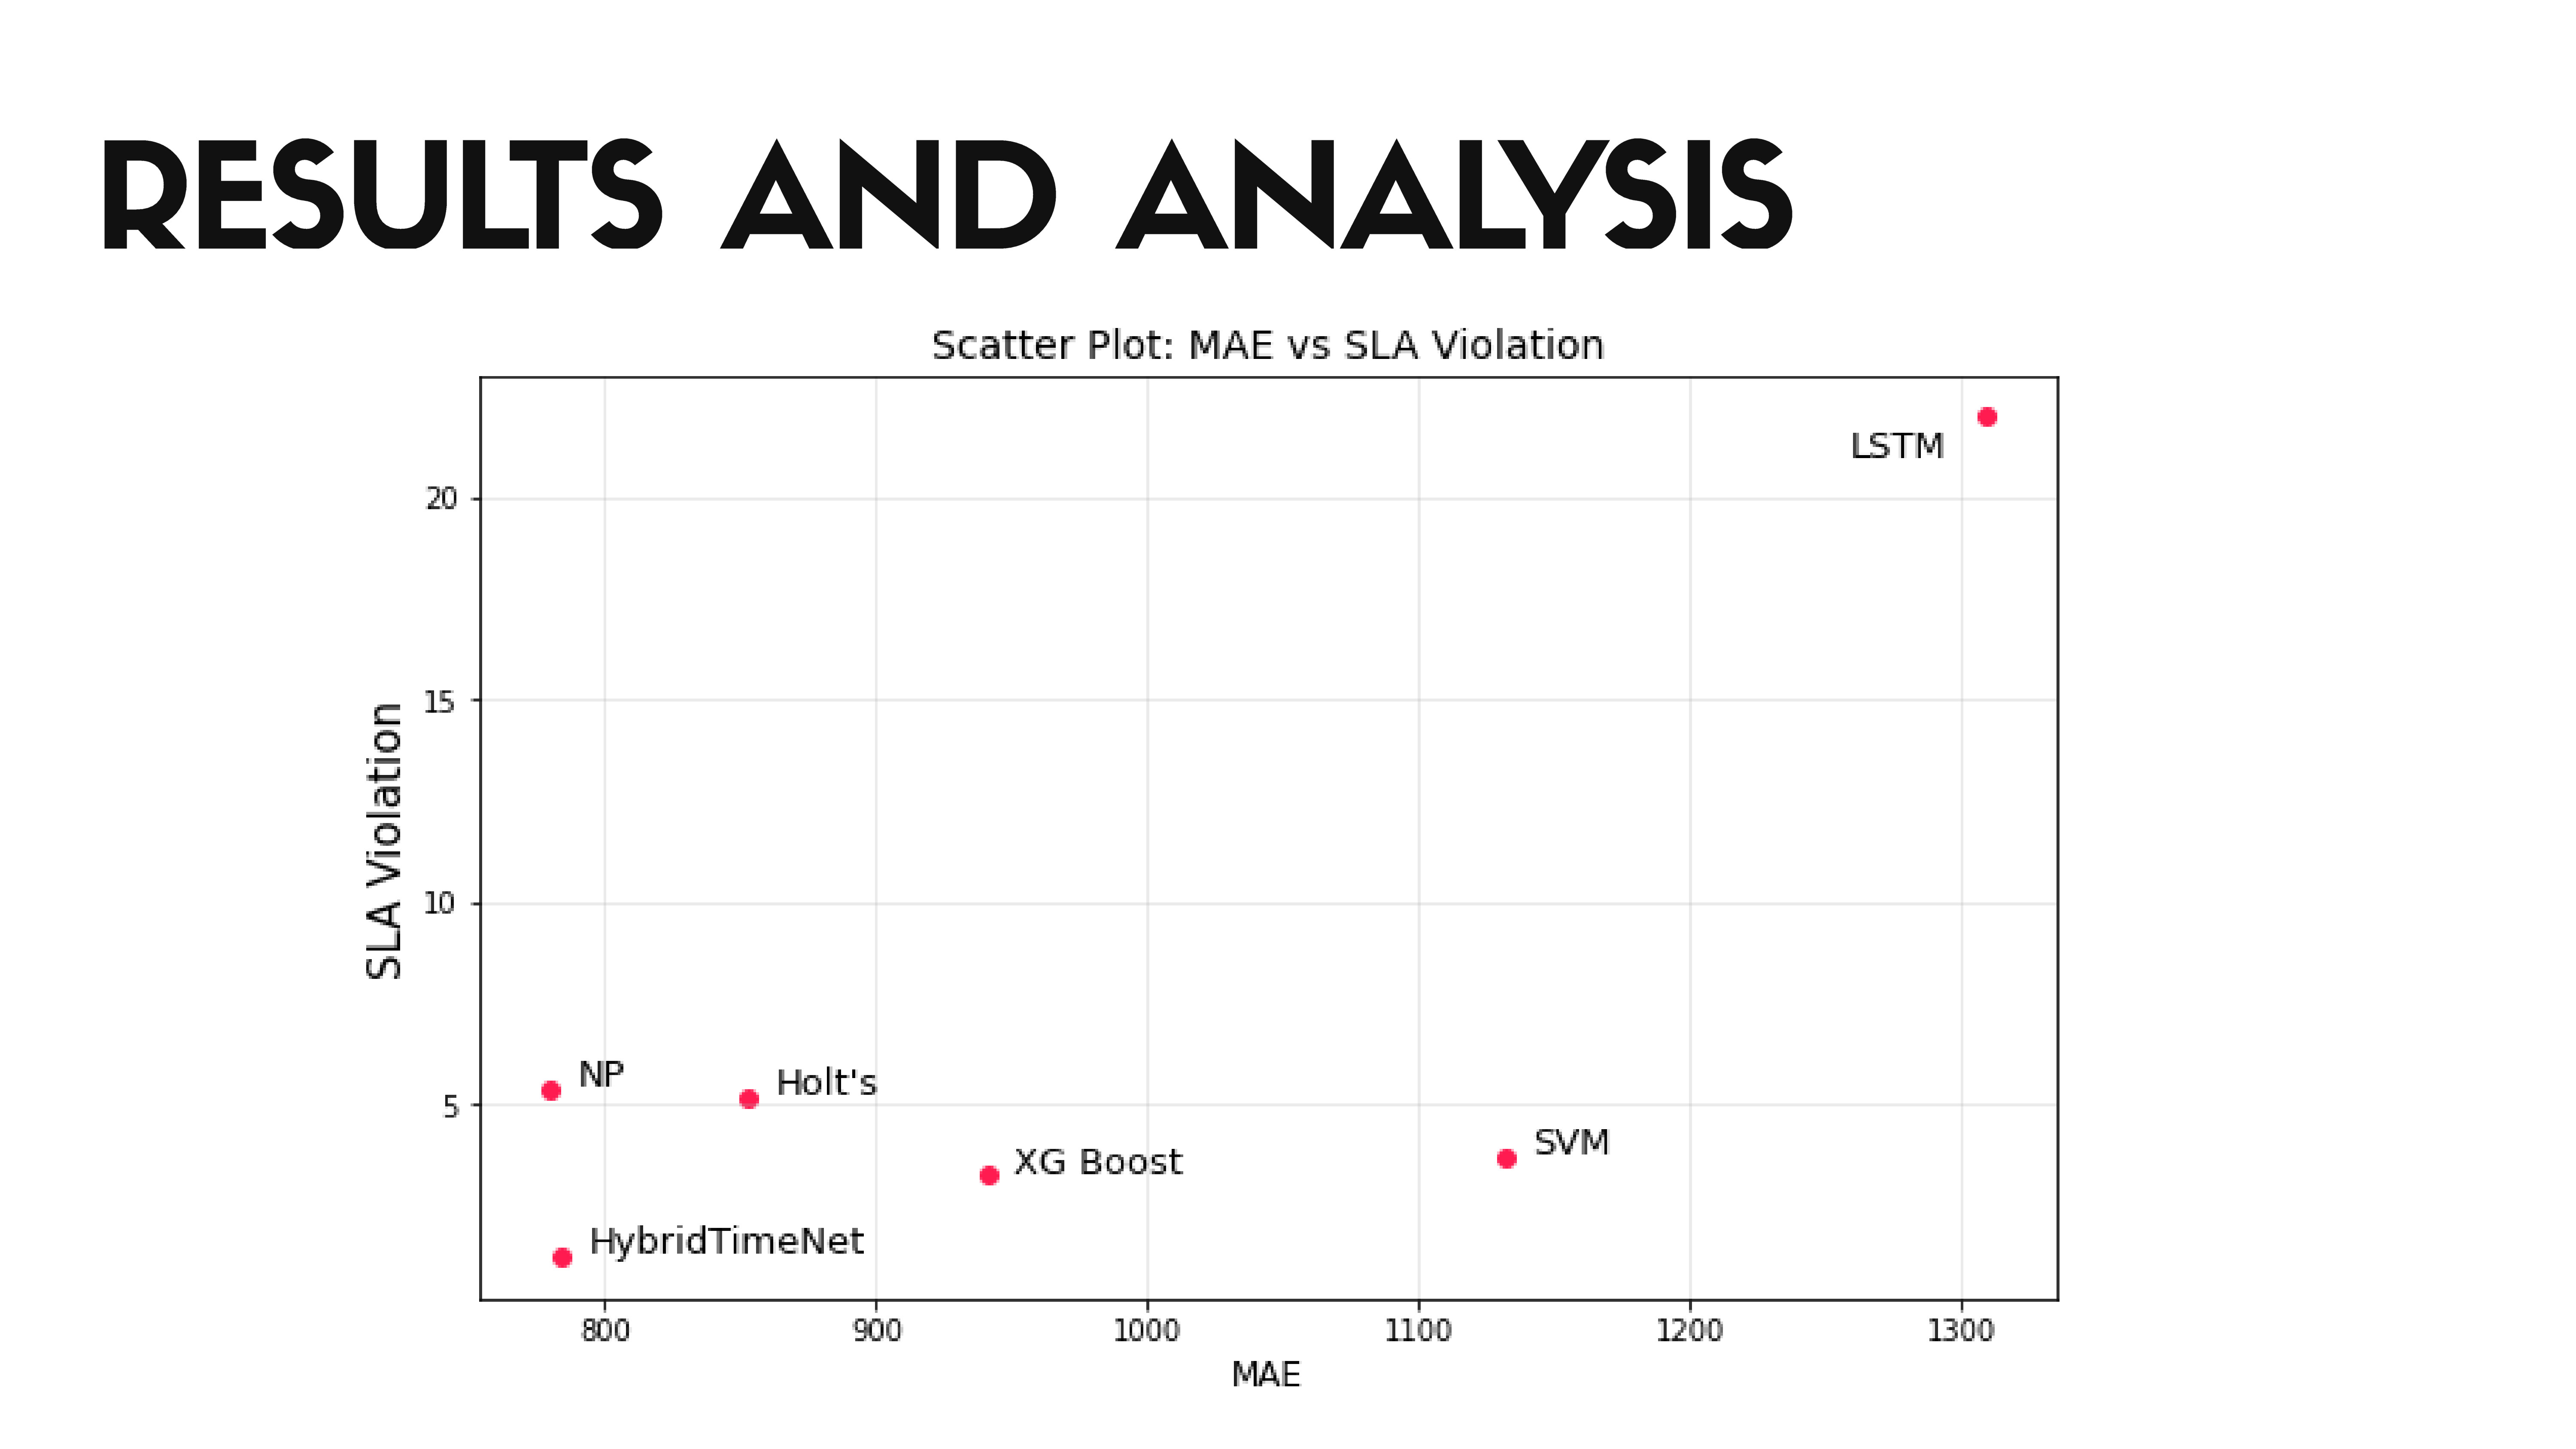 |
The scatter plot visualizes the relationship between Mean Absolute Error (MAE) and Service Level Agreement (SLA) violations for different models. Each point on the plot represents a model, with its position determined by its MAE value on the x-axis and its SLA violation rate on the y-axis.
The plot helps to understand the trade-off between prediction accuracy (lower MAE) and service quality (lower SLA violations)
|
|
ICACT20250232 Slide.14
[Big slide for presentation]
|
Chrome Text-to-Speach Click!! |
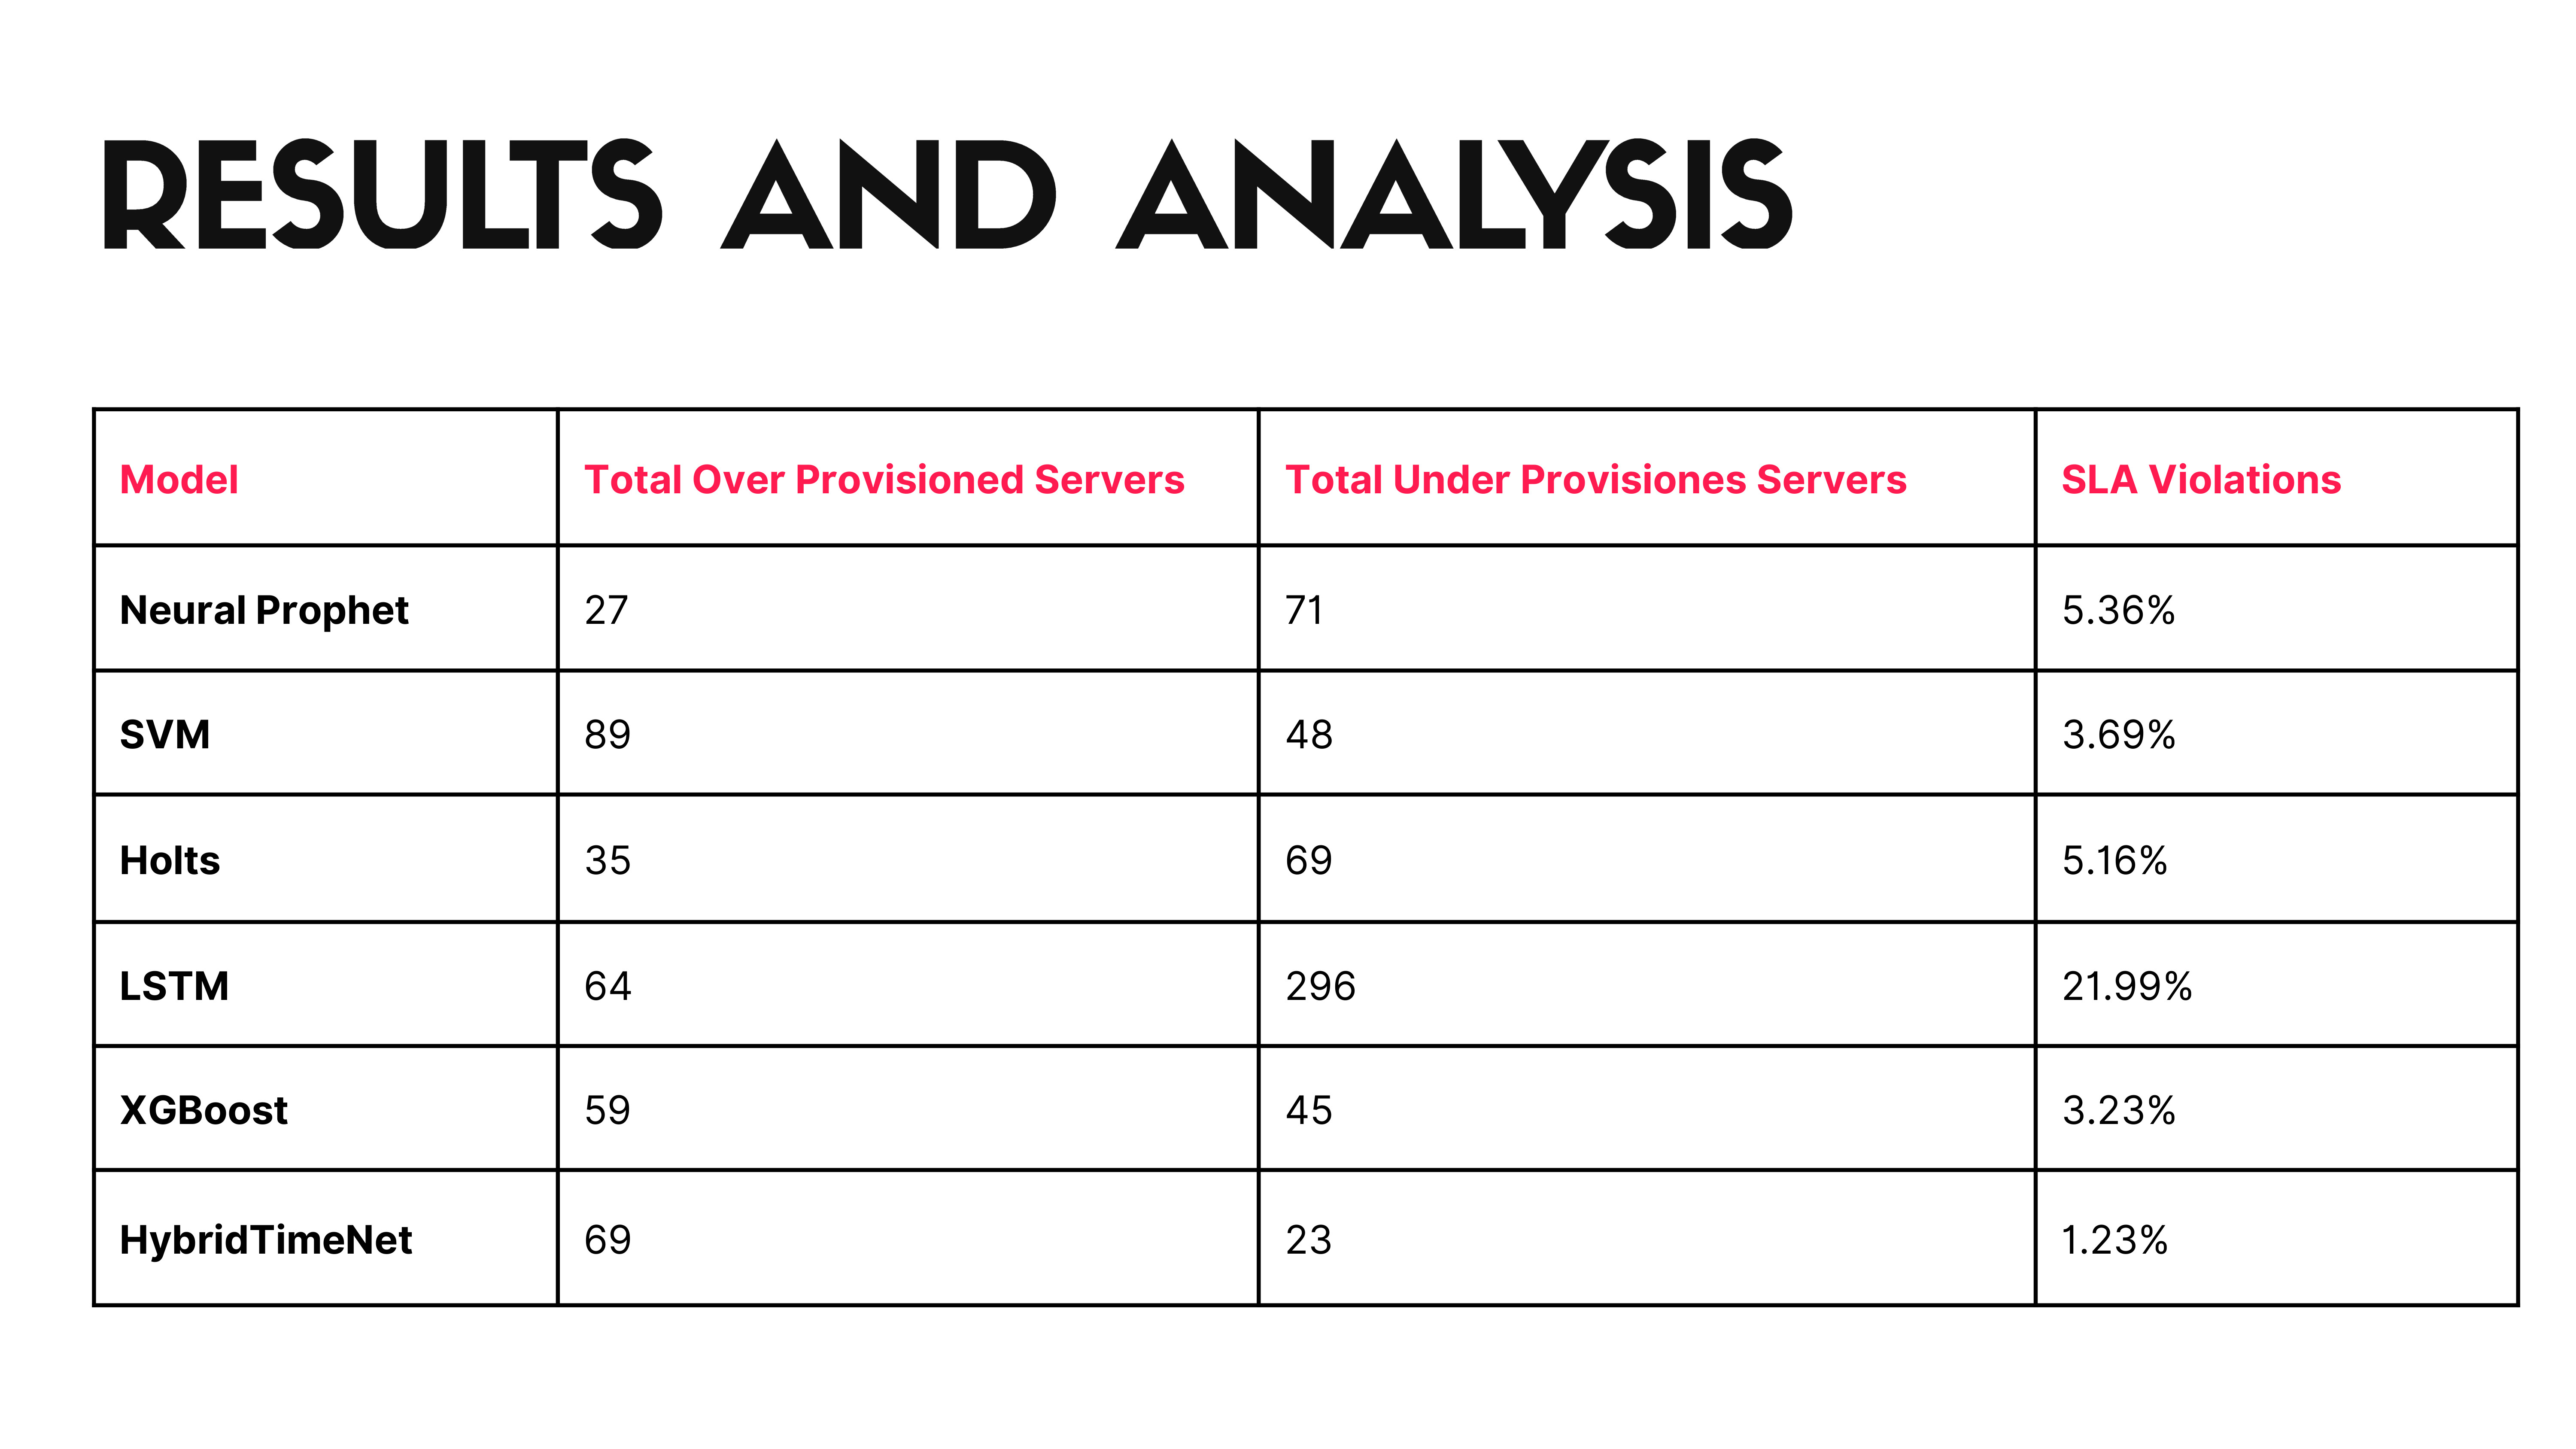 |
The table presents the results of the different models, showing the total number of servers over-provisioned and under-provisioned, as well as the percentage of SLA violations calculated based on a 7.5ms per request threshold. The HybridTimeNet model demonstrates the best performance with the lowest percentage of requests violating the SLA
|
|
ICACT20250232 Slide.13
[Big slide for presentation]
|
Chrome Text-to-Speach Click!! |
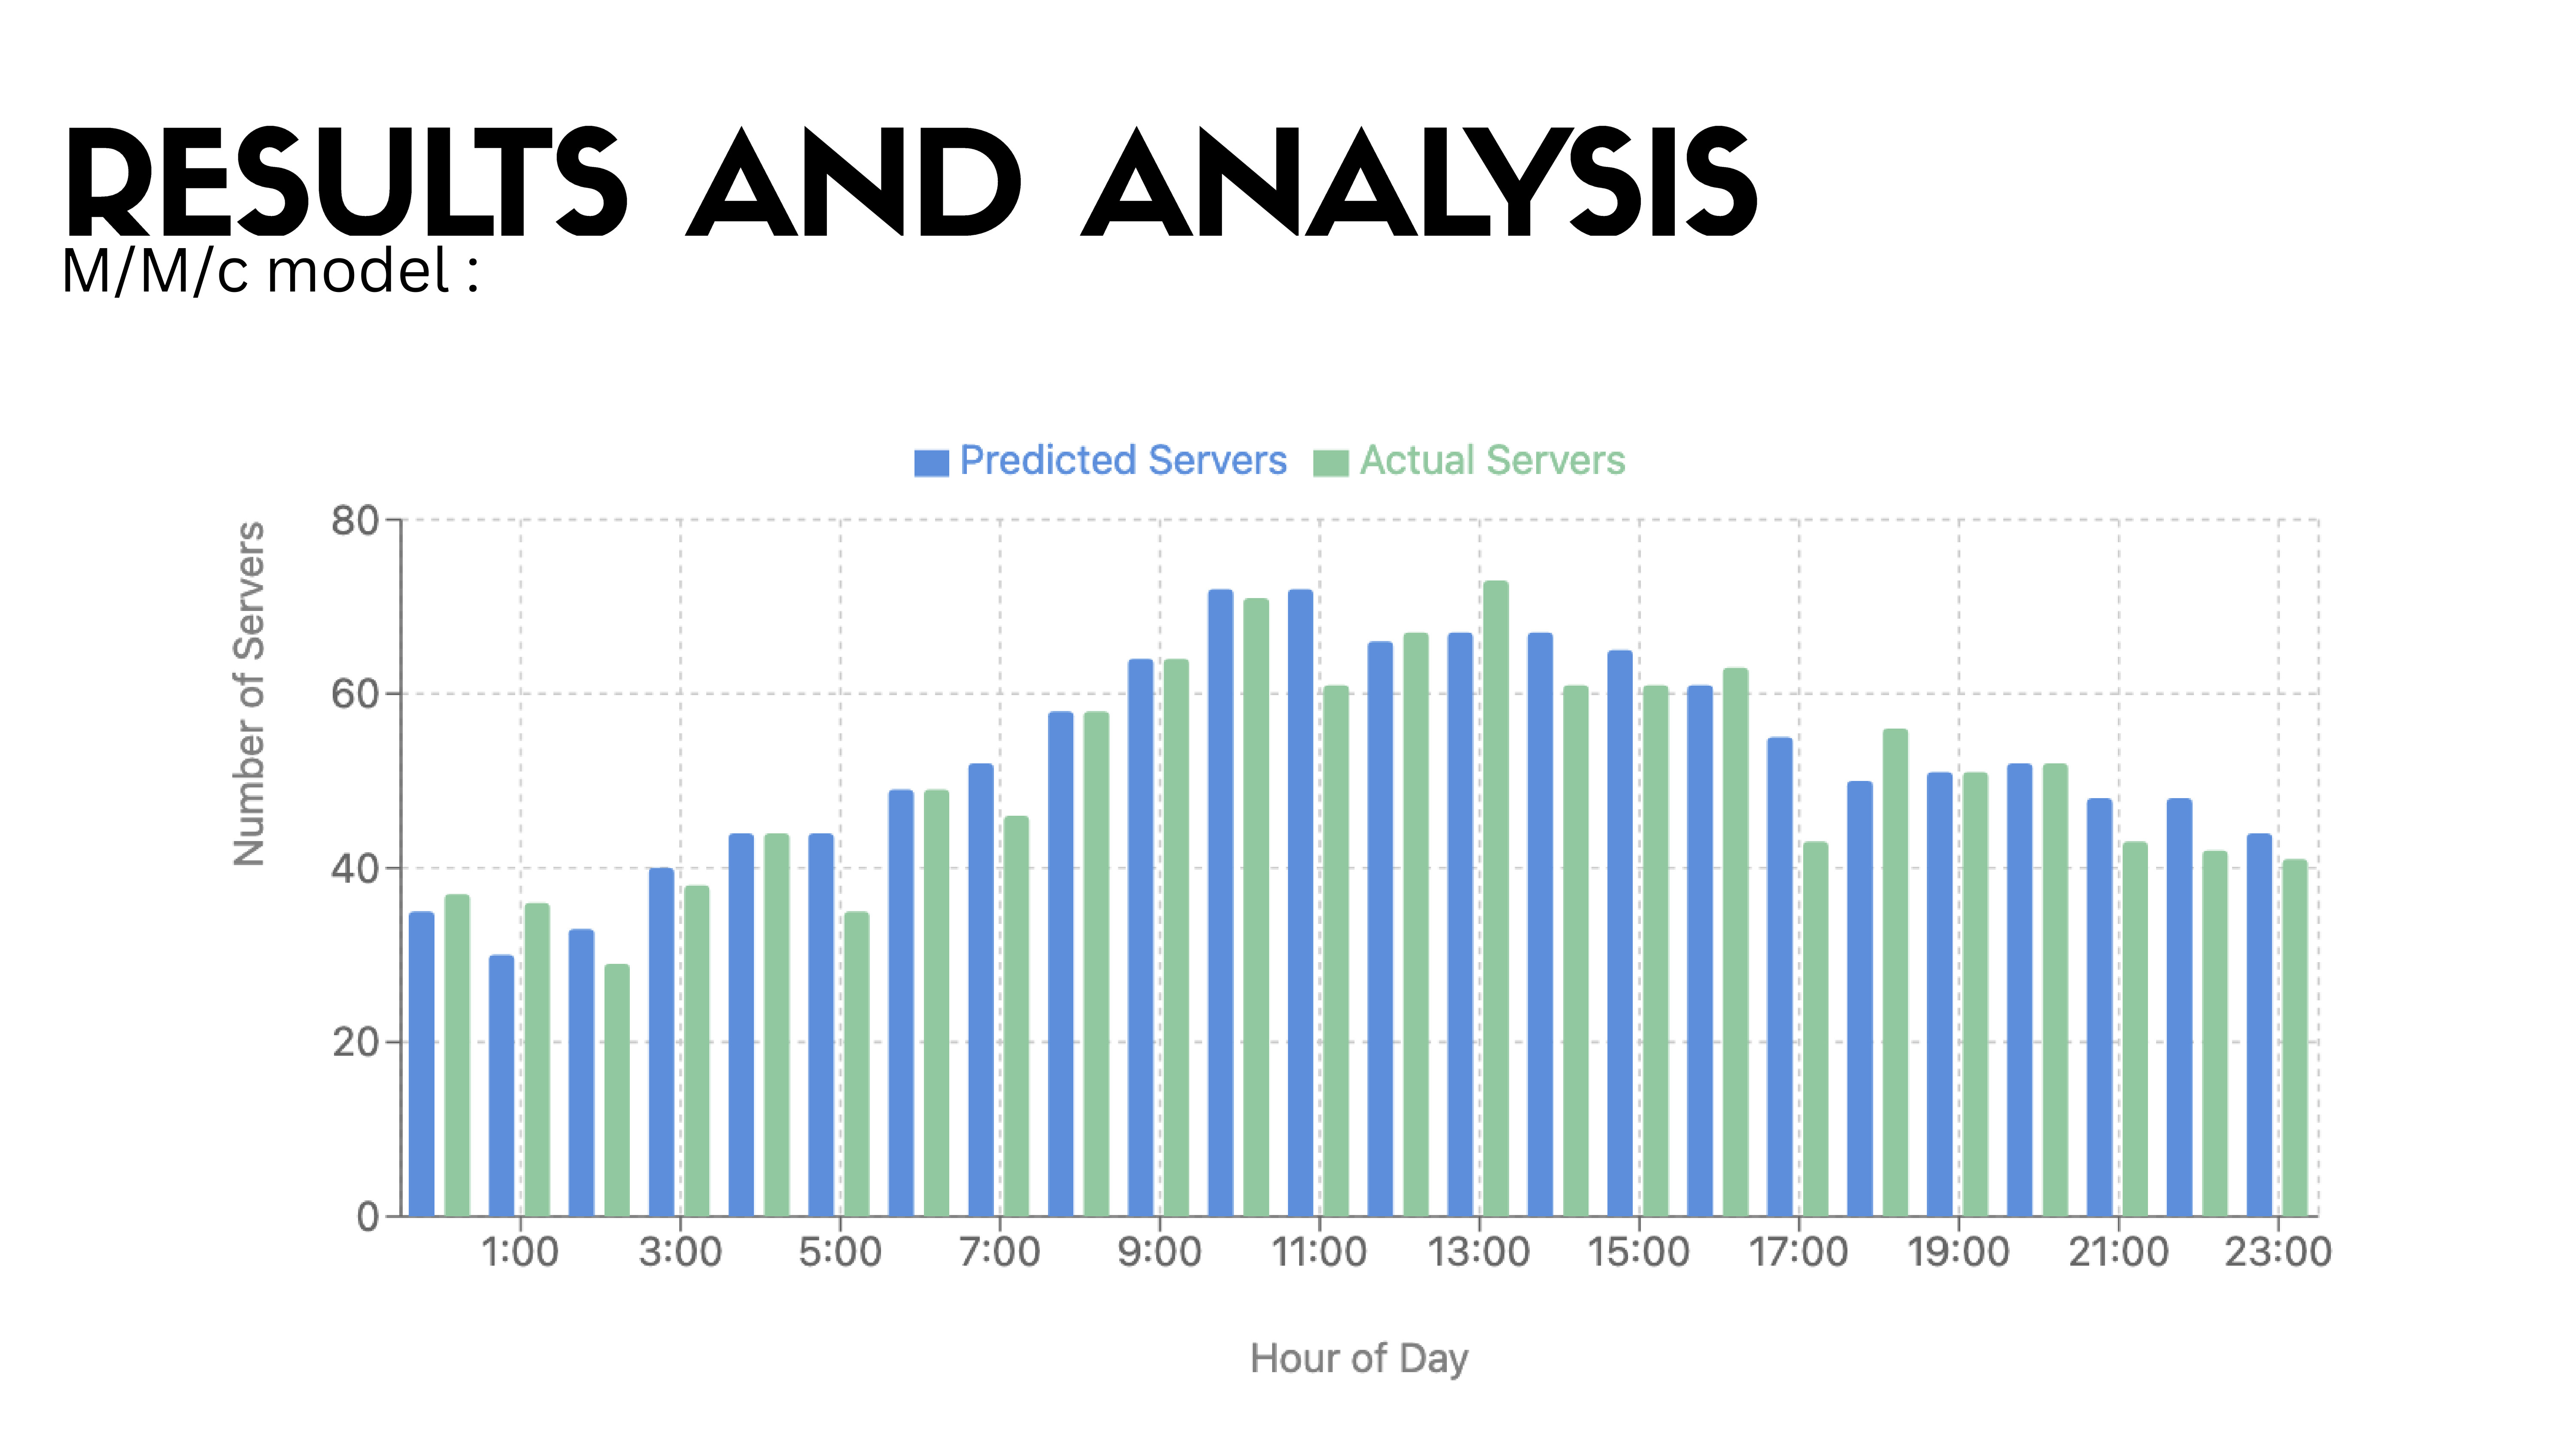 |
The M/M/c model was used to determine the number of servers required for each hour based on the time series predictions. The graph compares the predicted number of servers calculated based on the model predictions with the actual number of servers required at each hour based on test data.
|
|
ICACT20250232 Slide.12
[Big slide for presentation]
|
Chrome Text-to-Speach Click!! |
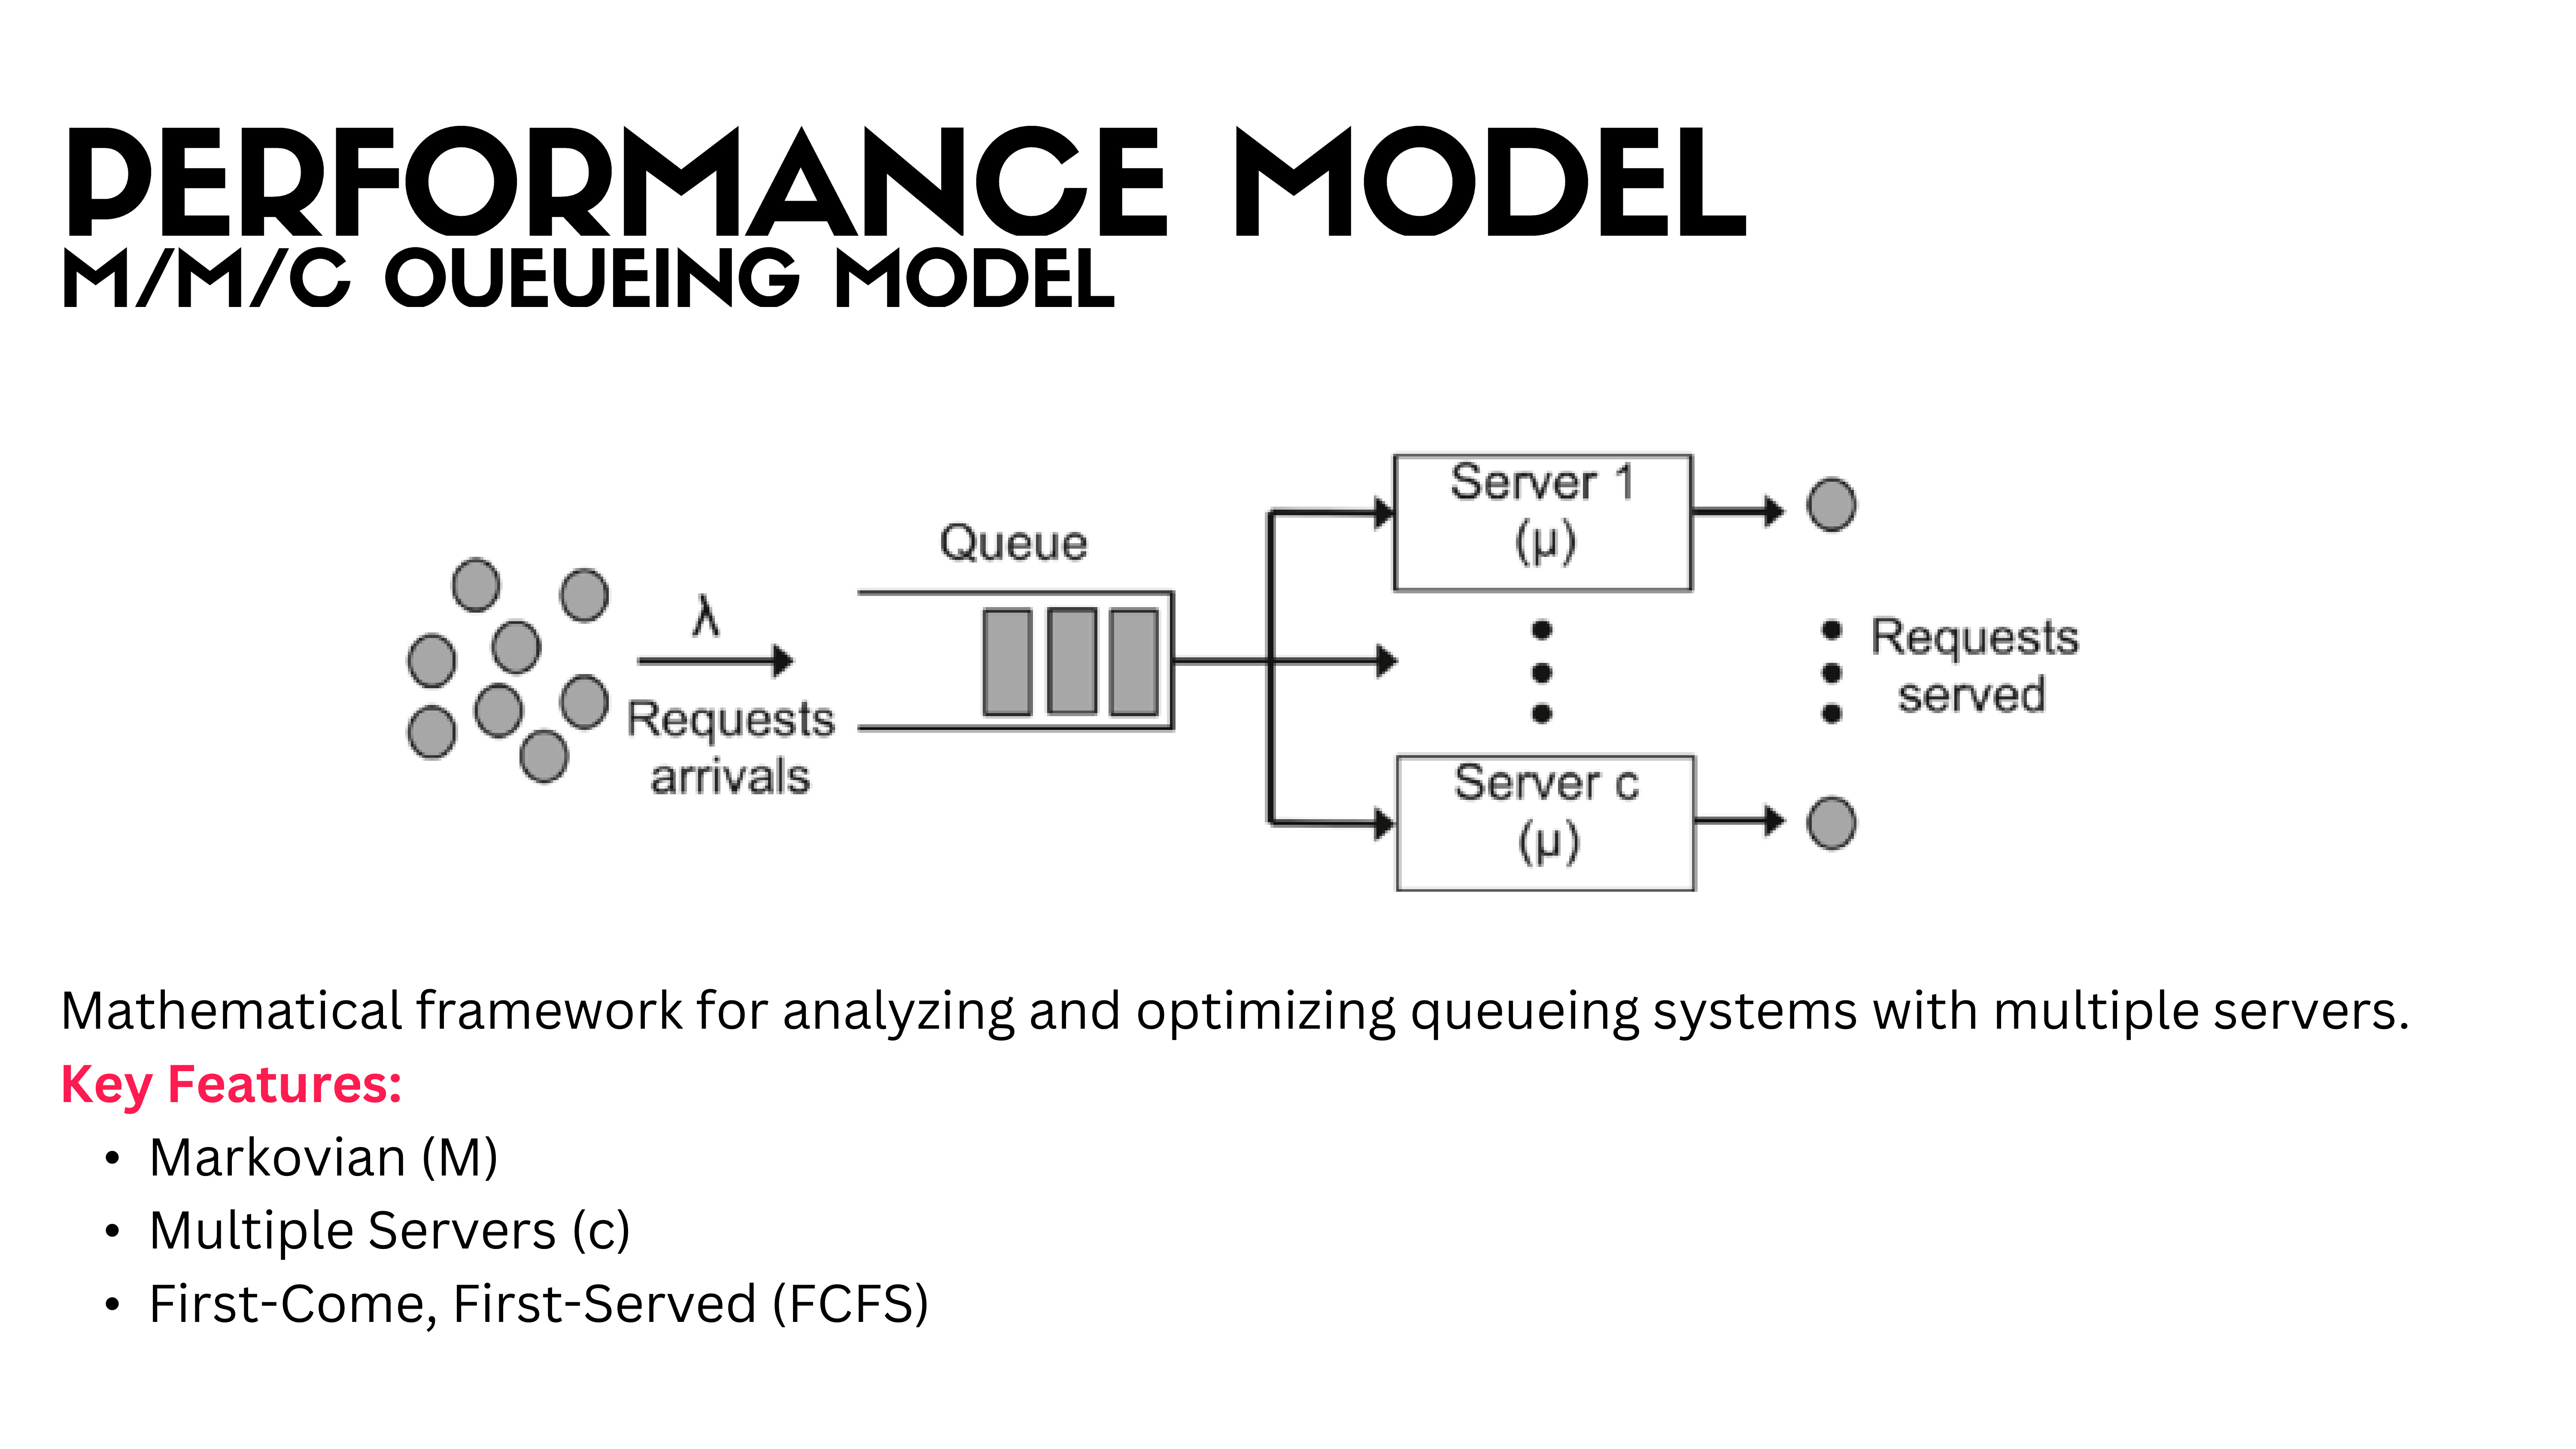 |
The M/M/c queuing model is a mathematical framework used to analyze and optimize queueing systems with multiple servers. This model was used to evaluate the resource requirements based on the time series predictions generated by the different models. The key features of this model are Markovian (M), Multiple Servers (c), and First-Come, First-Served (FCFS).
|
|
ICACT20250232 Slide.11
[Big slide for presentation]
|
Chrome Text-to-Speach Click!! |
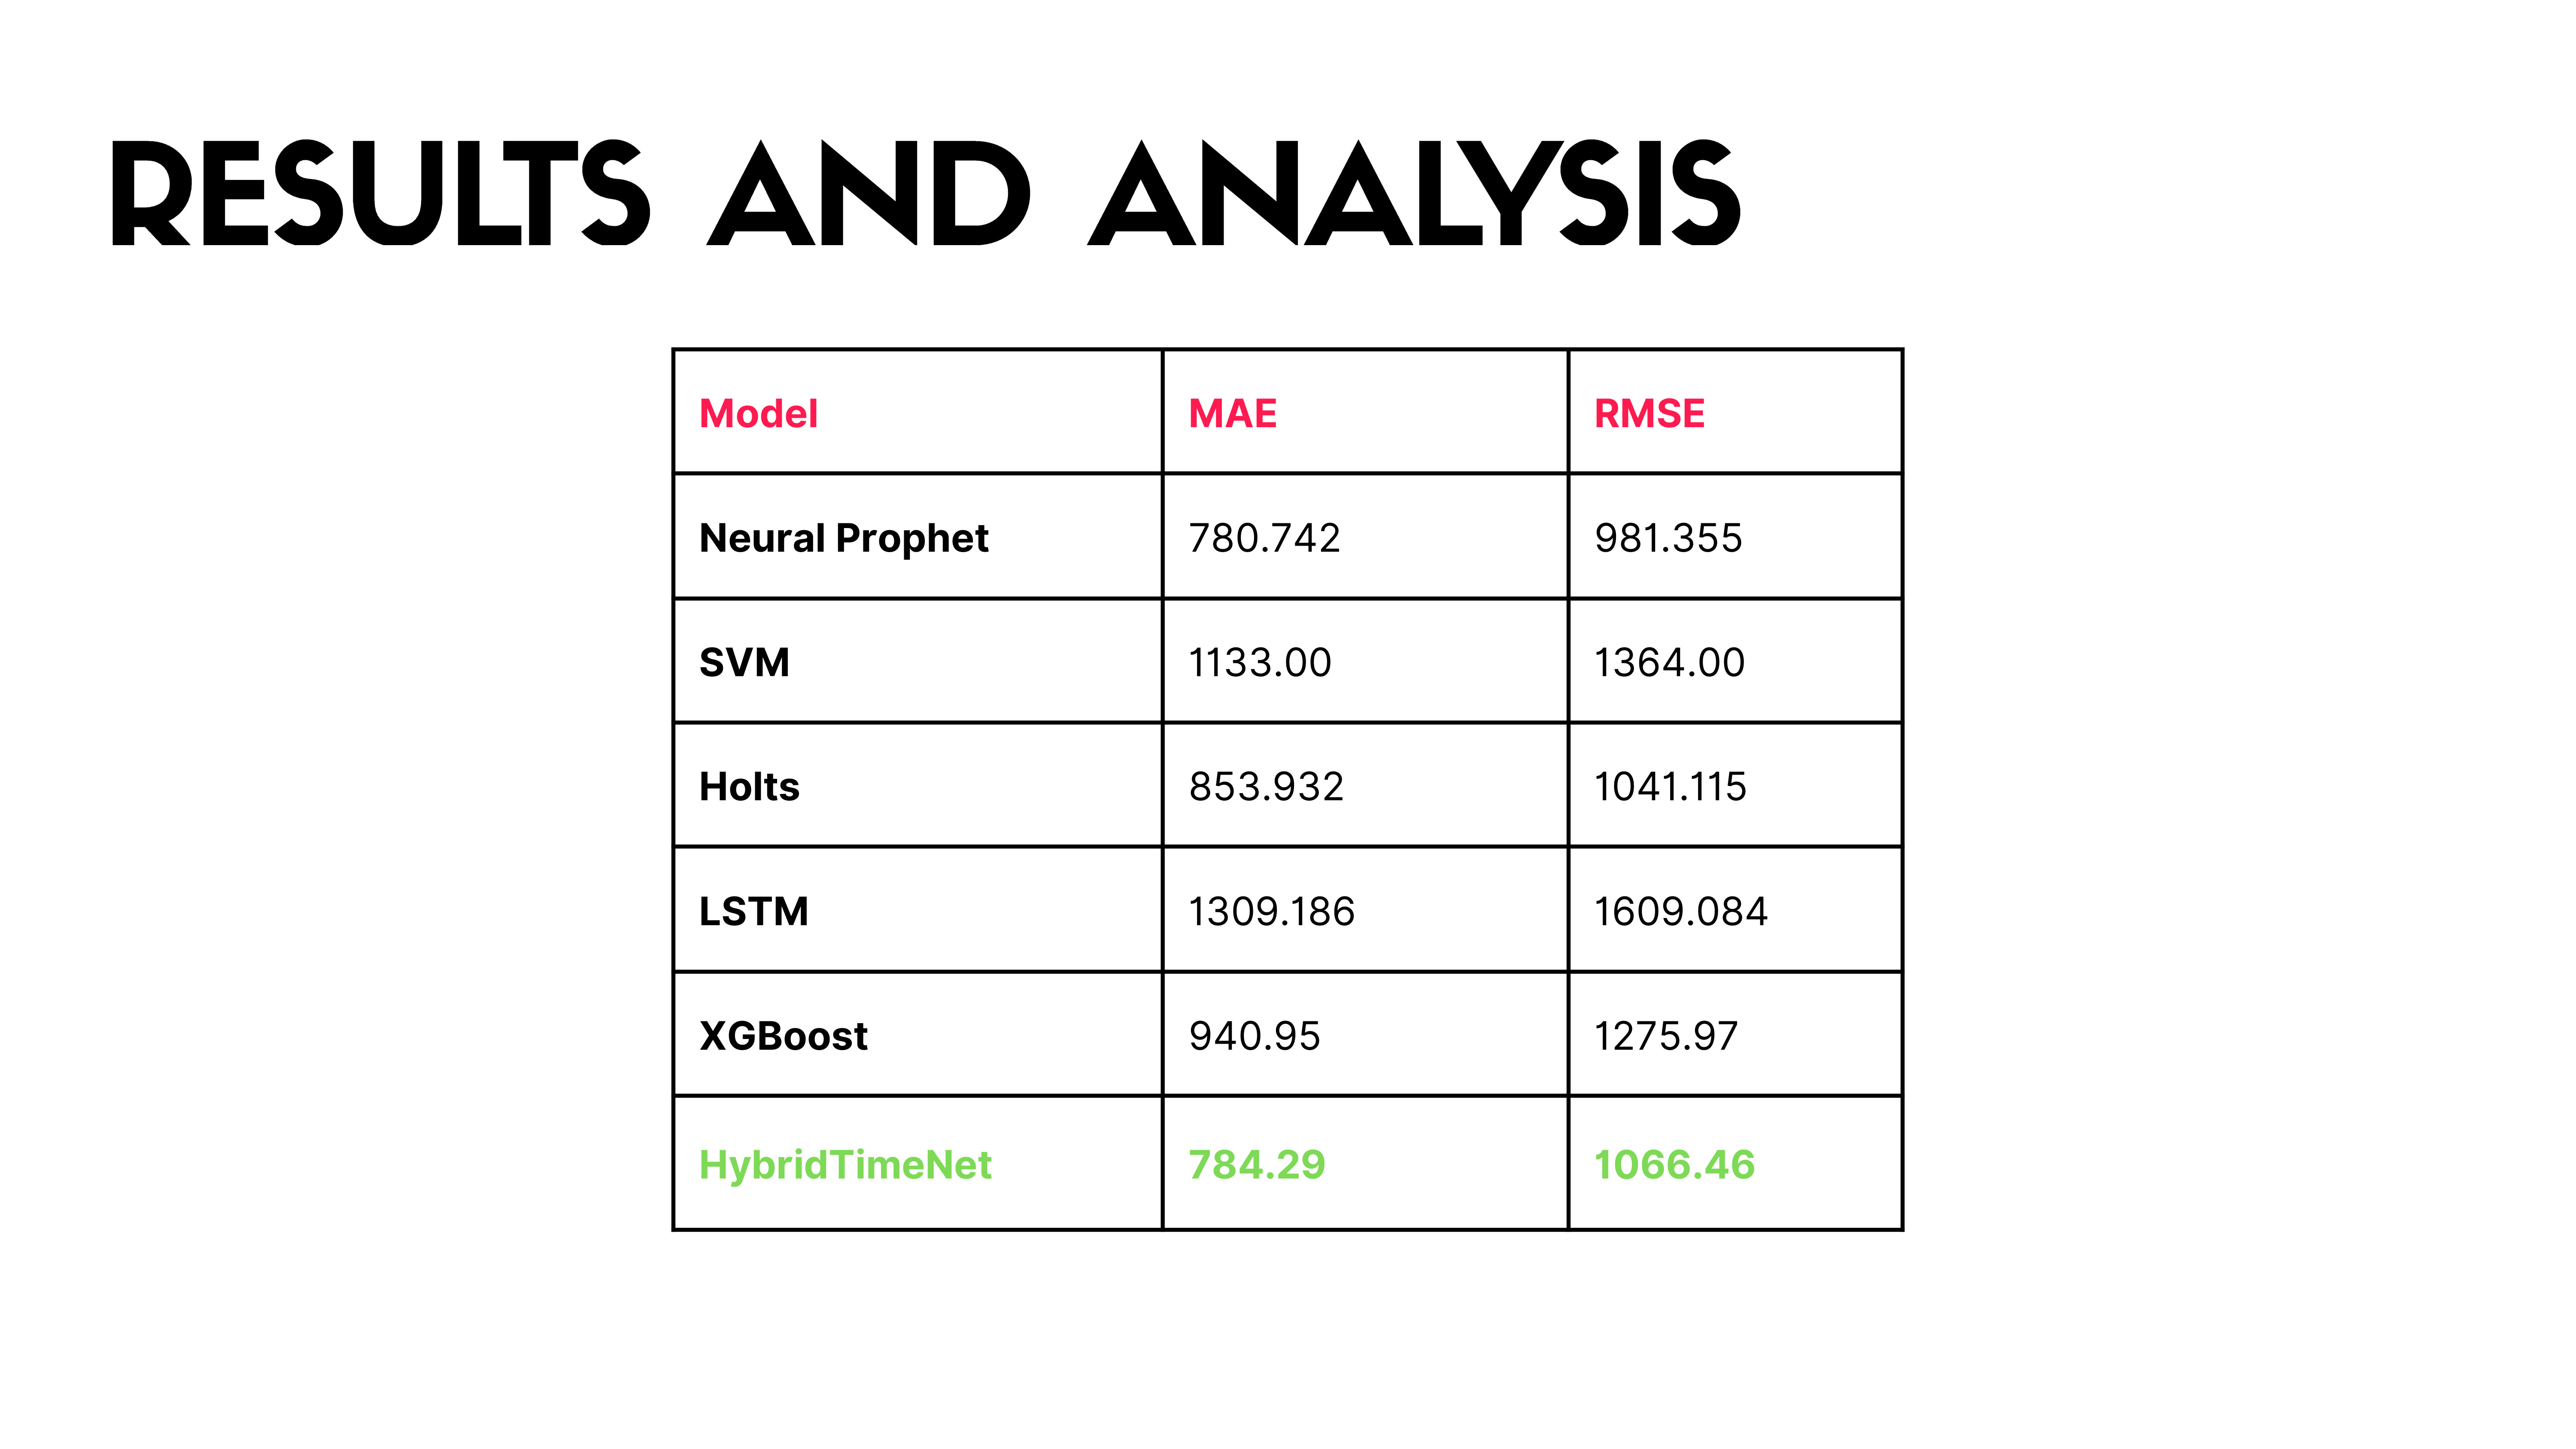 |
These are the final results of time series prediction by different individual models, including Neural Prophet, SVM, Holt's, LSTM, and XGBoost, as well as the HybridTimeNet model.
|
|
ICACT20250232 Slide.10
[Big slide for presentation]
|
Chrome Text-to-Speach Click!! |
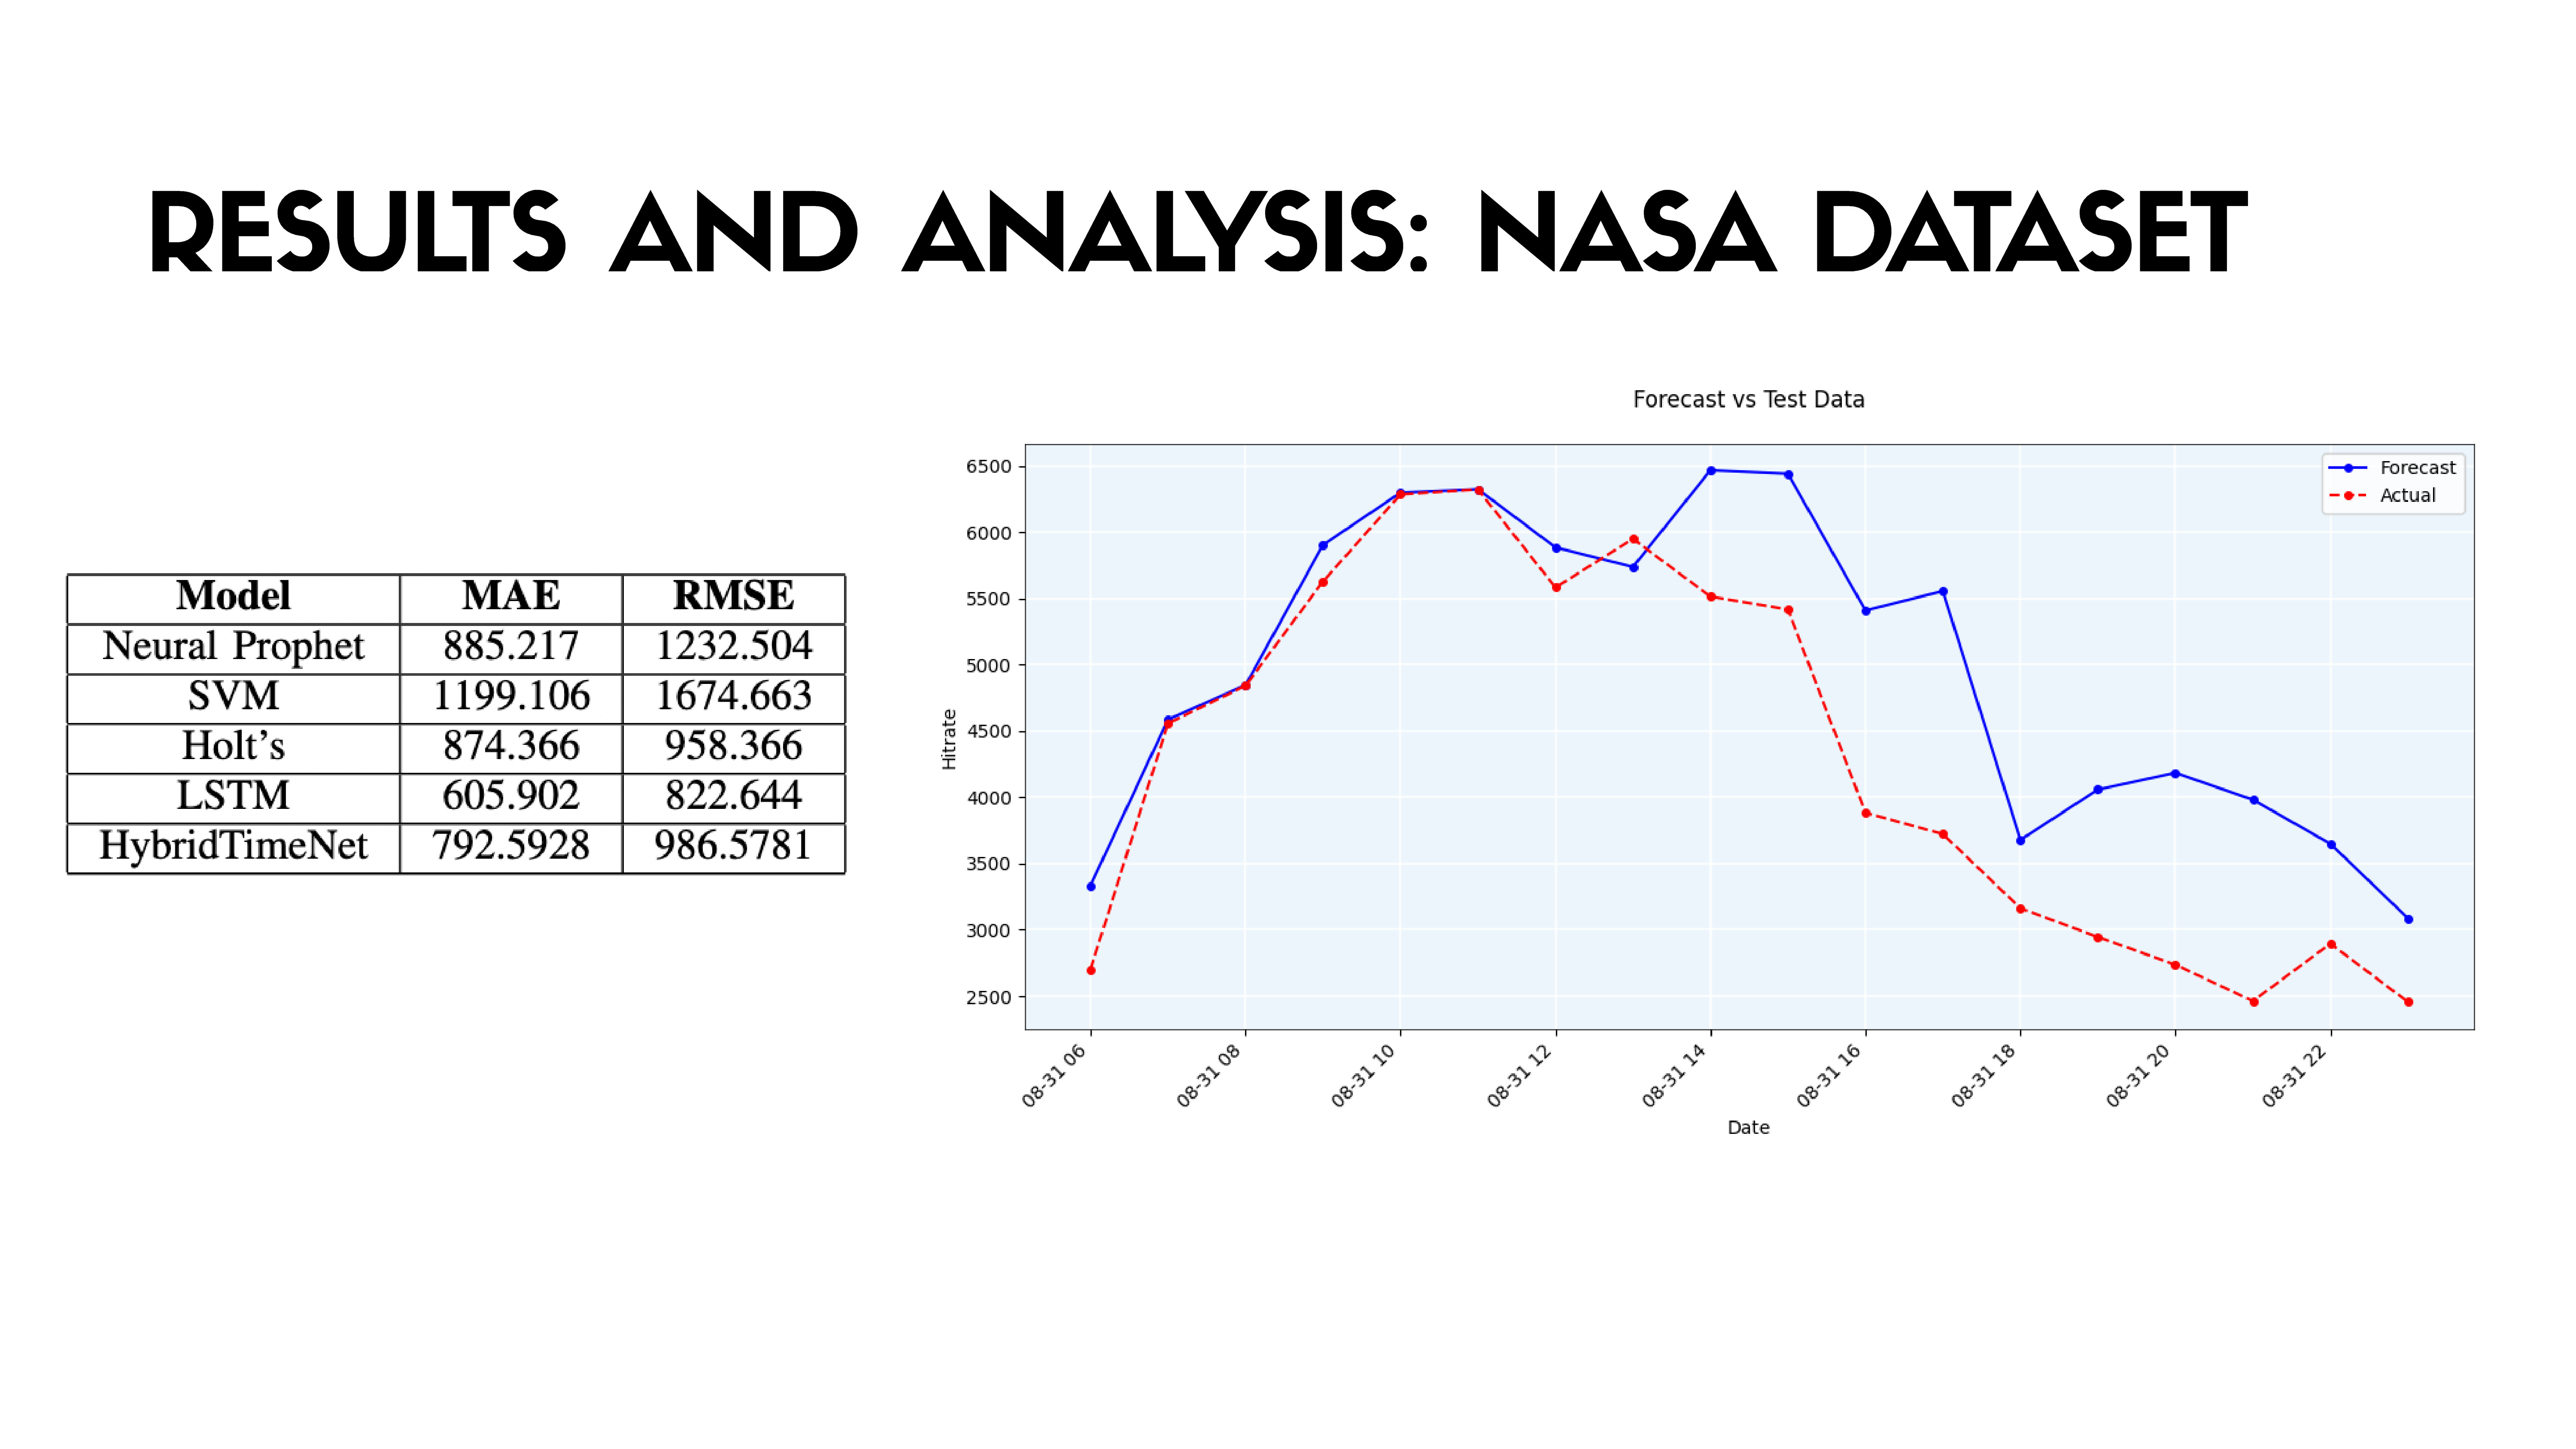 |
The same trend can be observed when the model is tested on the Nasa dataset
|
|
ICACT20250232 Slide.09
[Big slide for presentation]
|
Chrome Text-to-Speach Click!! |
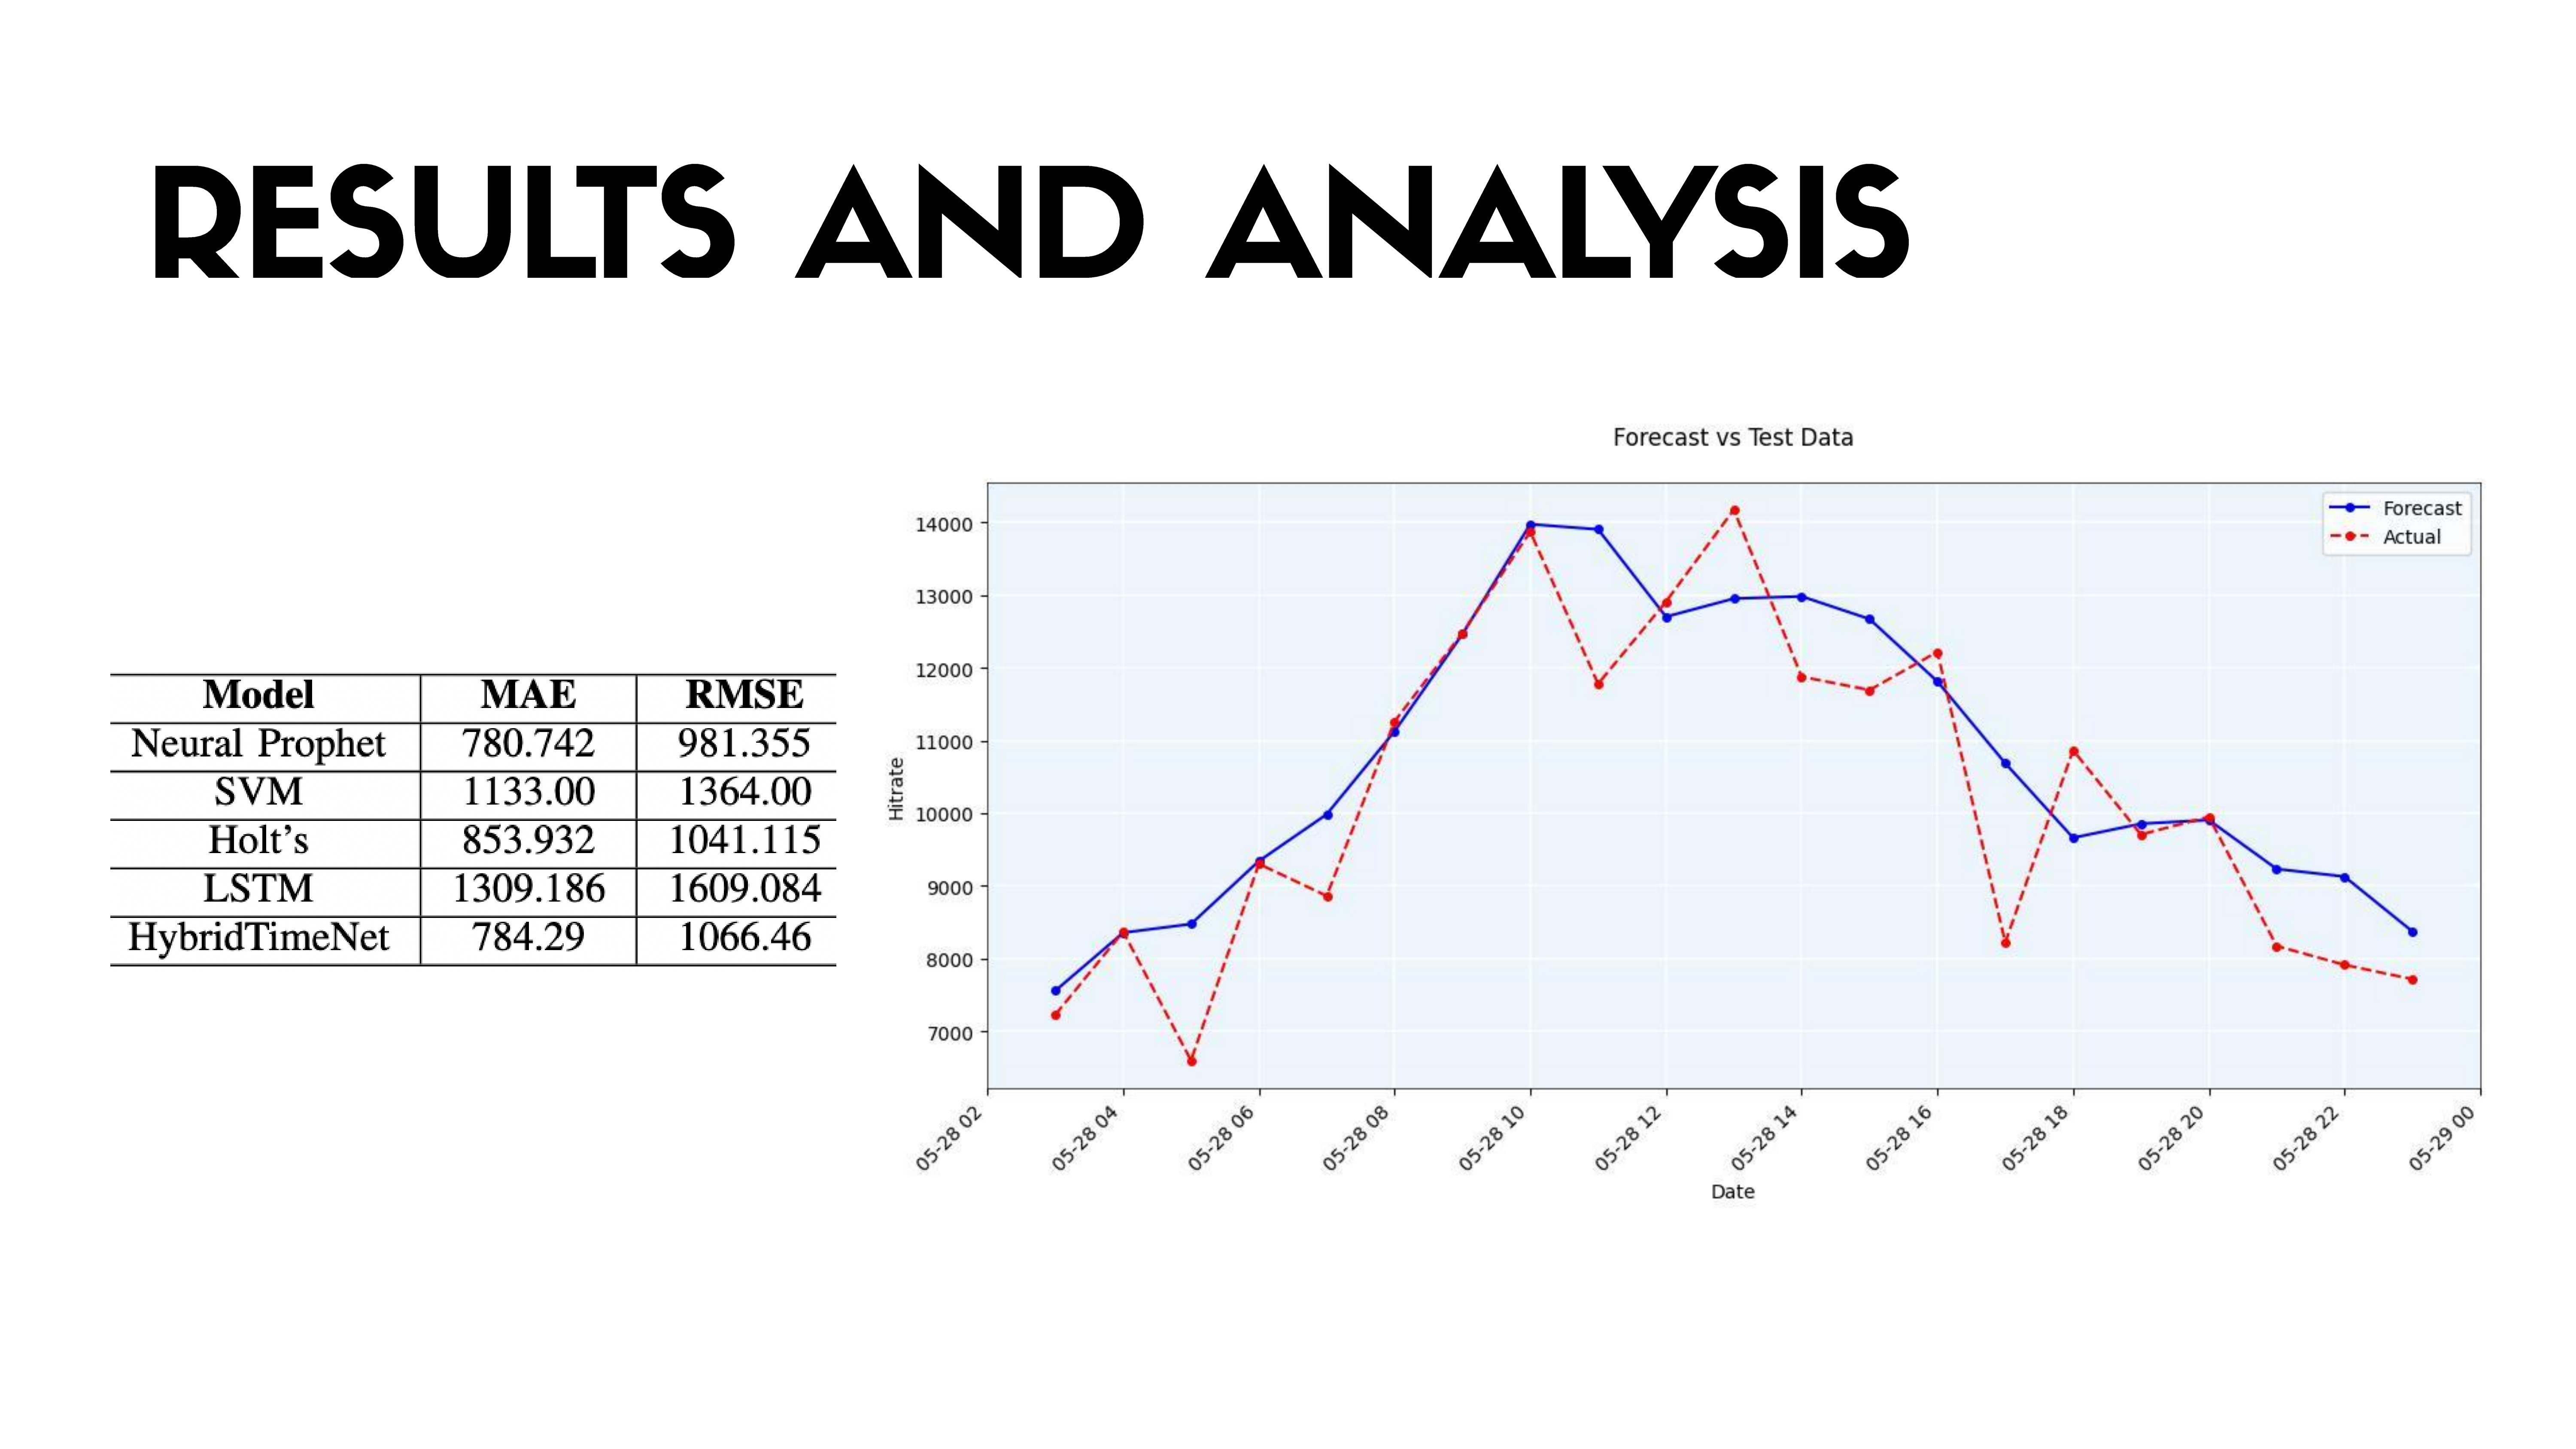 |
The slide presents the performance evaluation of different models. The models evaluated include Neural Prophet, SVM, Holt's, LSTM, and HybridTimeNet. The performance of these models is assessed using Mean Absolute Error (MAE) and Root Mean Squared Error (RMSE). The HybridTimeNet model achieved the lowest MAE and RMSE values among all the models with Neural Prophet being a close exception. Additionally, the graph is included to visually compare forecasted values with actual test data.
|
|
ICACT20250232 Slide.08
[Big slide for presentation]
|
Chrome Text-to-Speach Click!! |
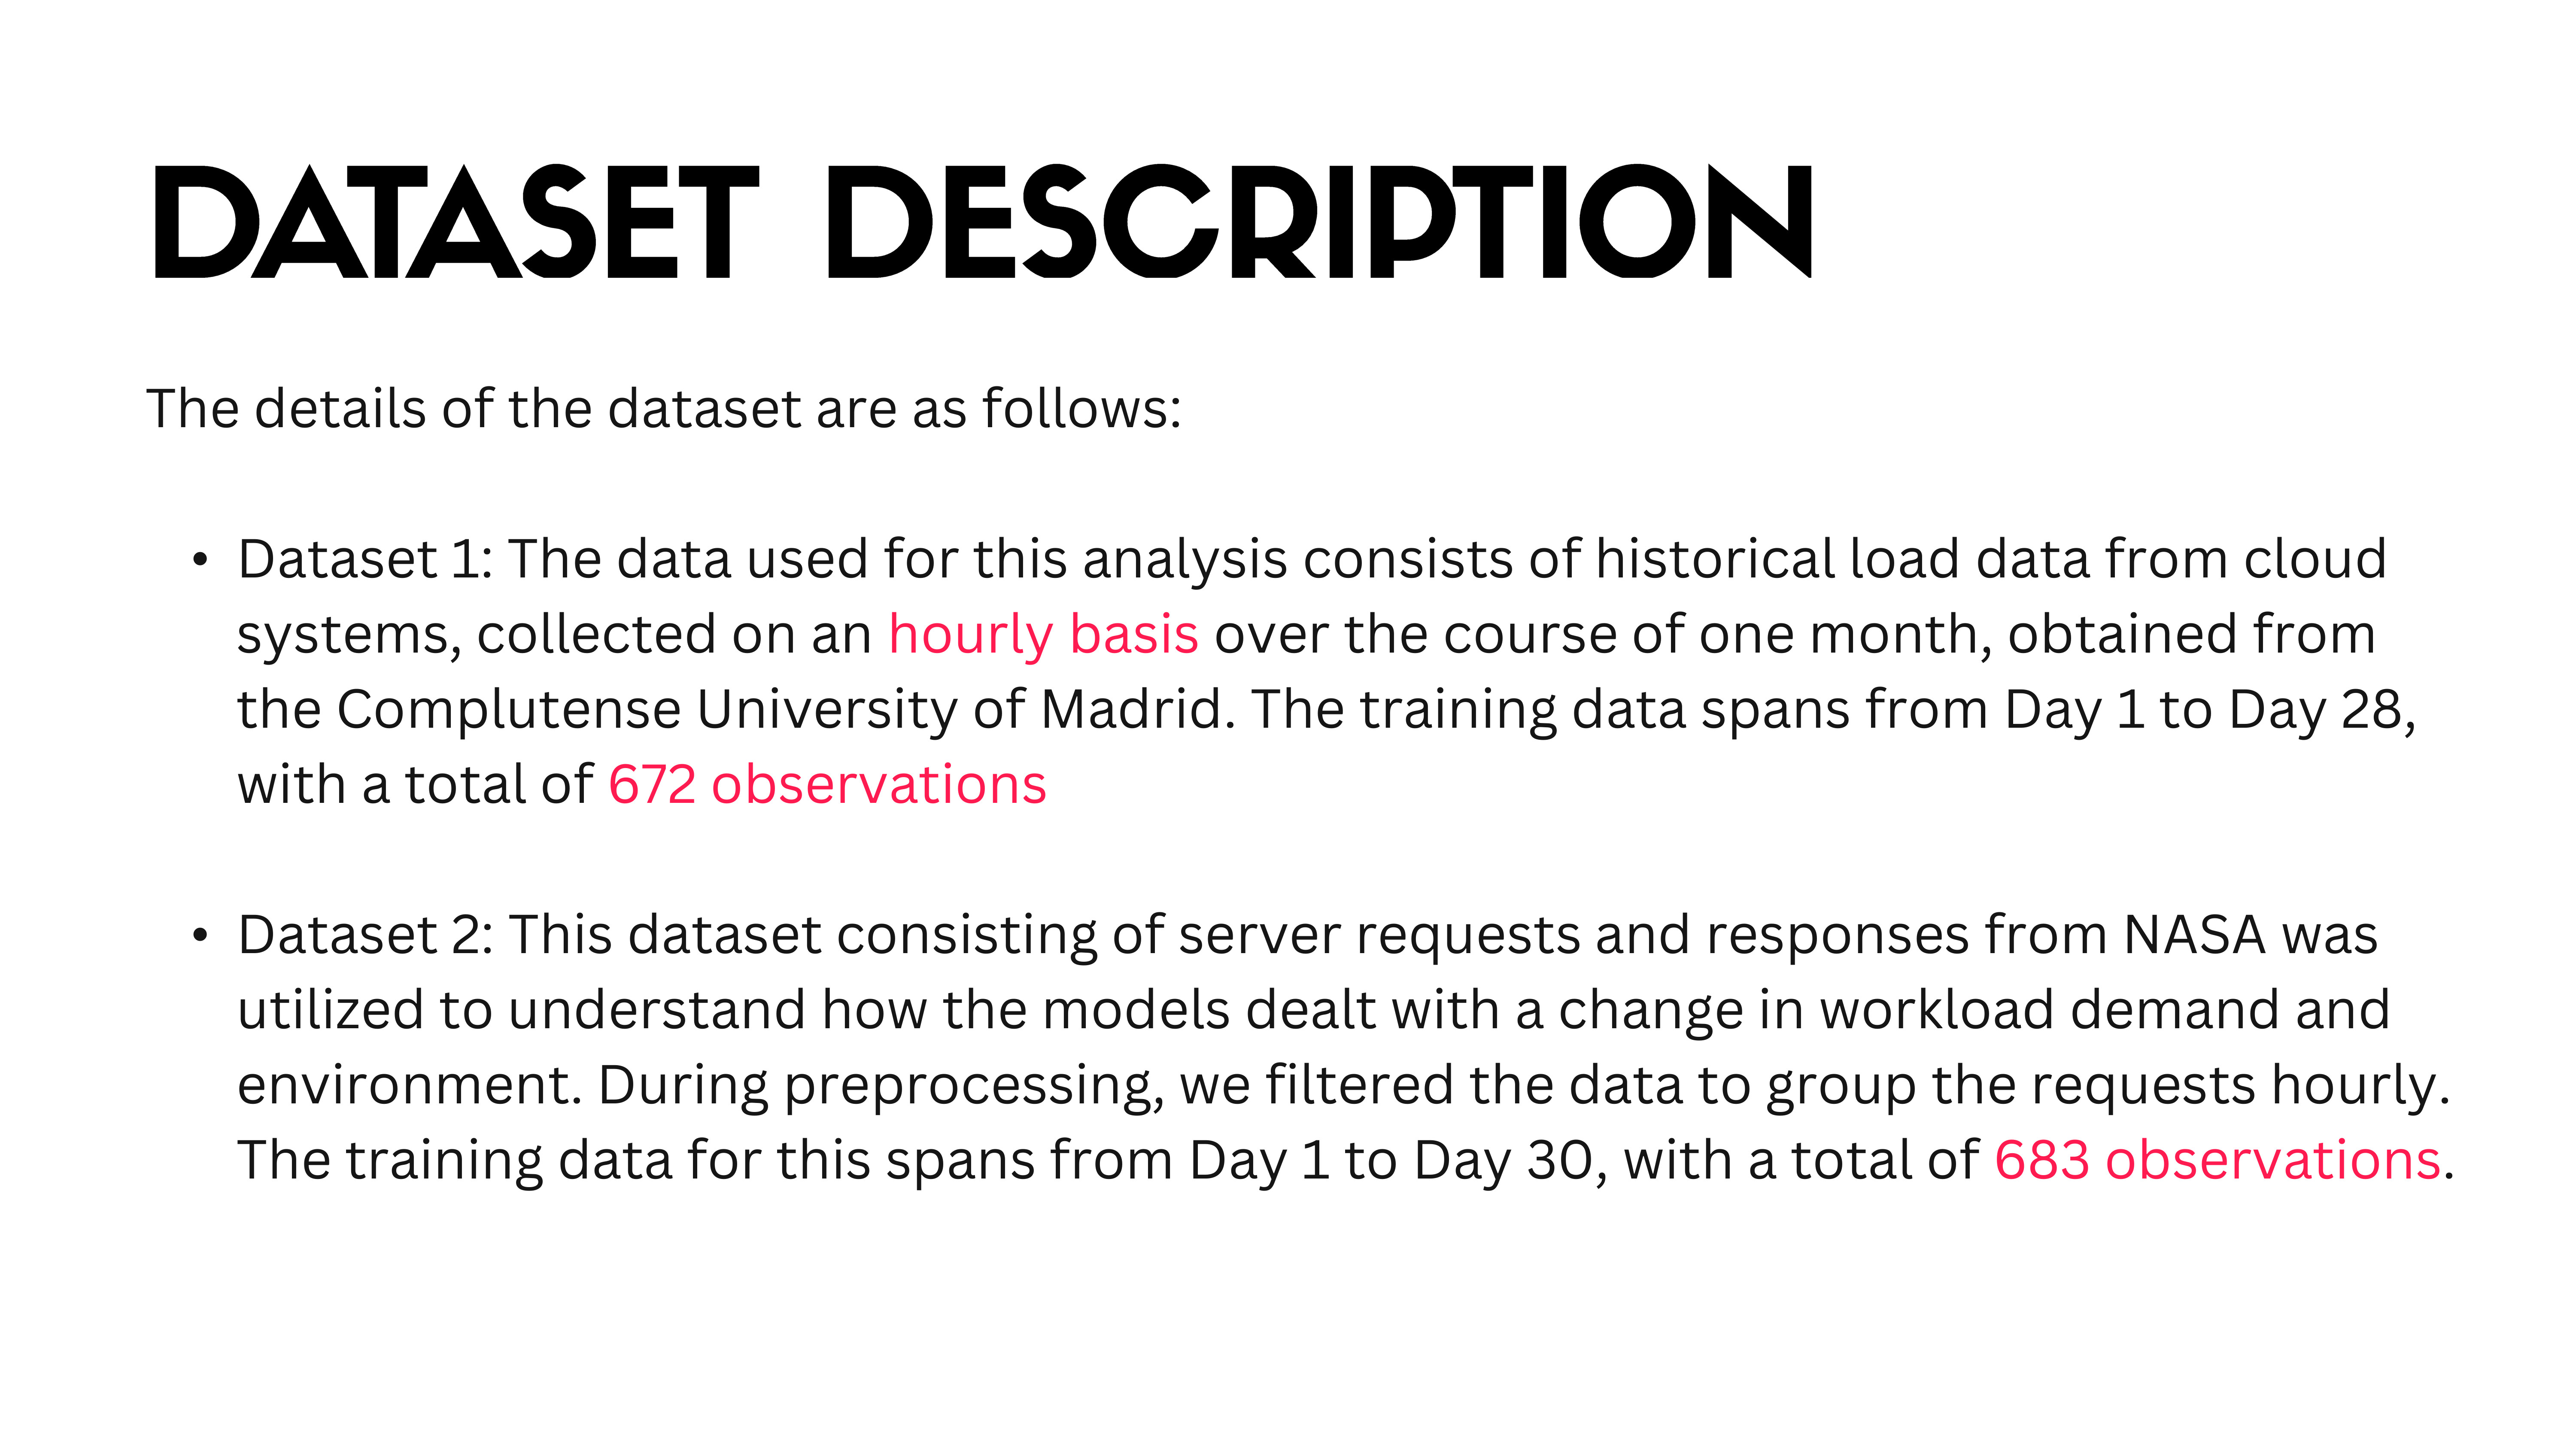 |
DATASET DESCRIPTION:
The details of the dataset are as follows:
Dataset 1: The data used for this analysis consists of historical load data from cloud systems, collected on an hourly basis over the course of one month, obtained from the Complutense University of Madrid. The training data spans from Day 1 to Day 28, with a total of 672 observations.
Dataset 2: This dataset consisting of server requests and responses from NASA was utilized to understand how the models dealt with a change in workload demand and environment. During preprocessing, we filtered the data to group the requests hourly. The training data for this spans from Day 1 to Day 30, with a total of 683 observations.
|
|
ICACT20250232 Slide.07
[Big slide for presentation]
|
Chrome Text-to-Speach Click!! |
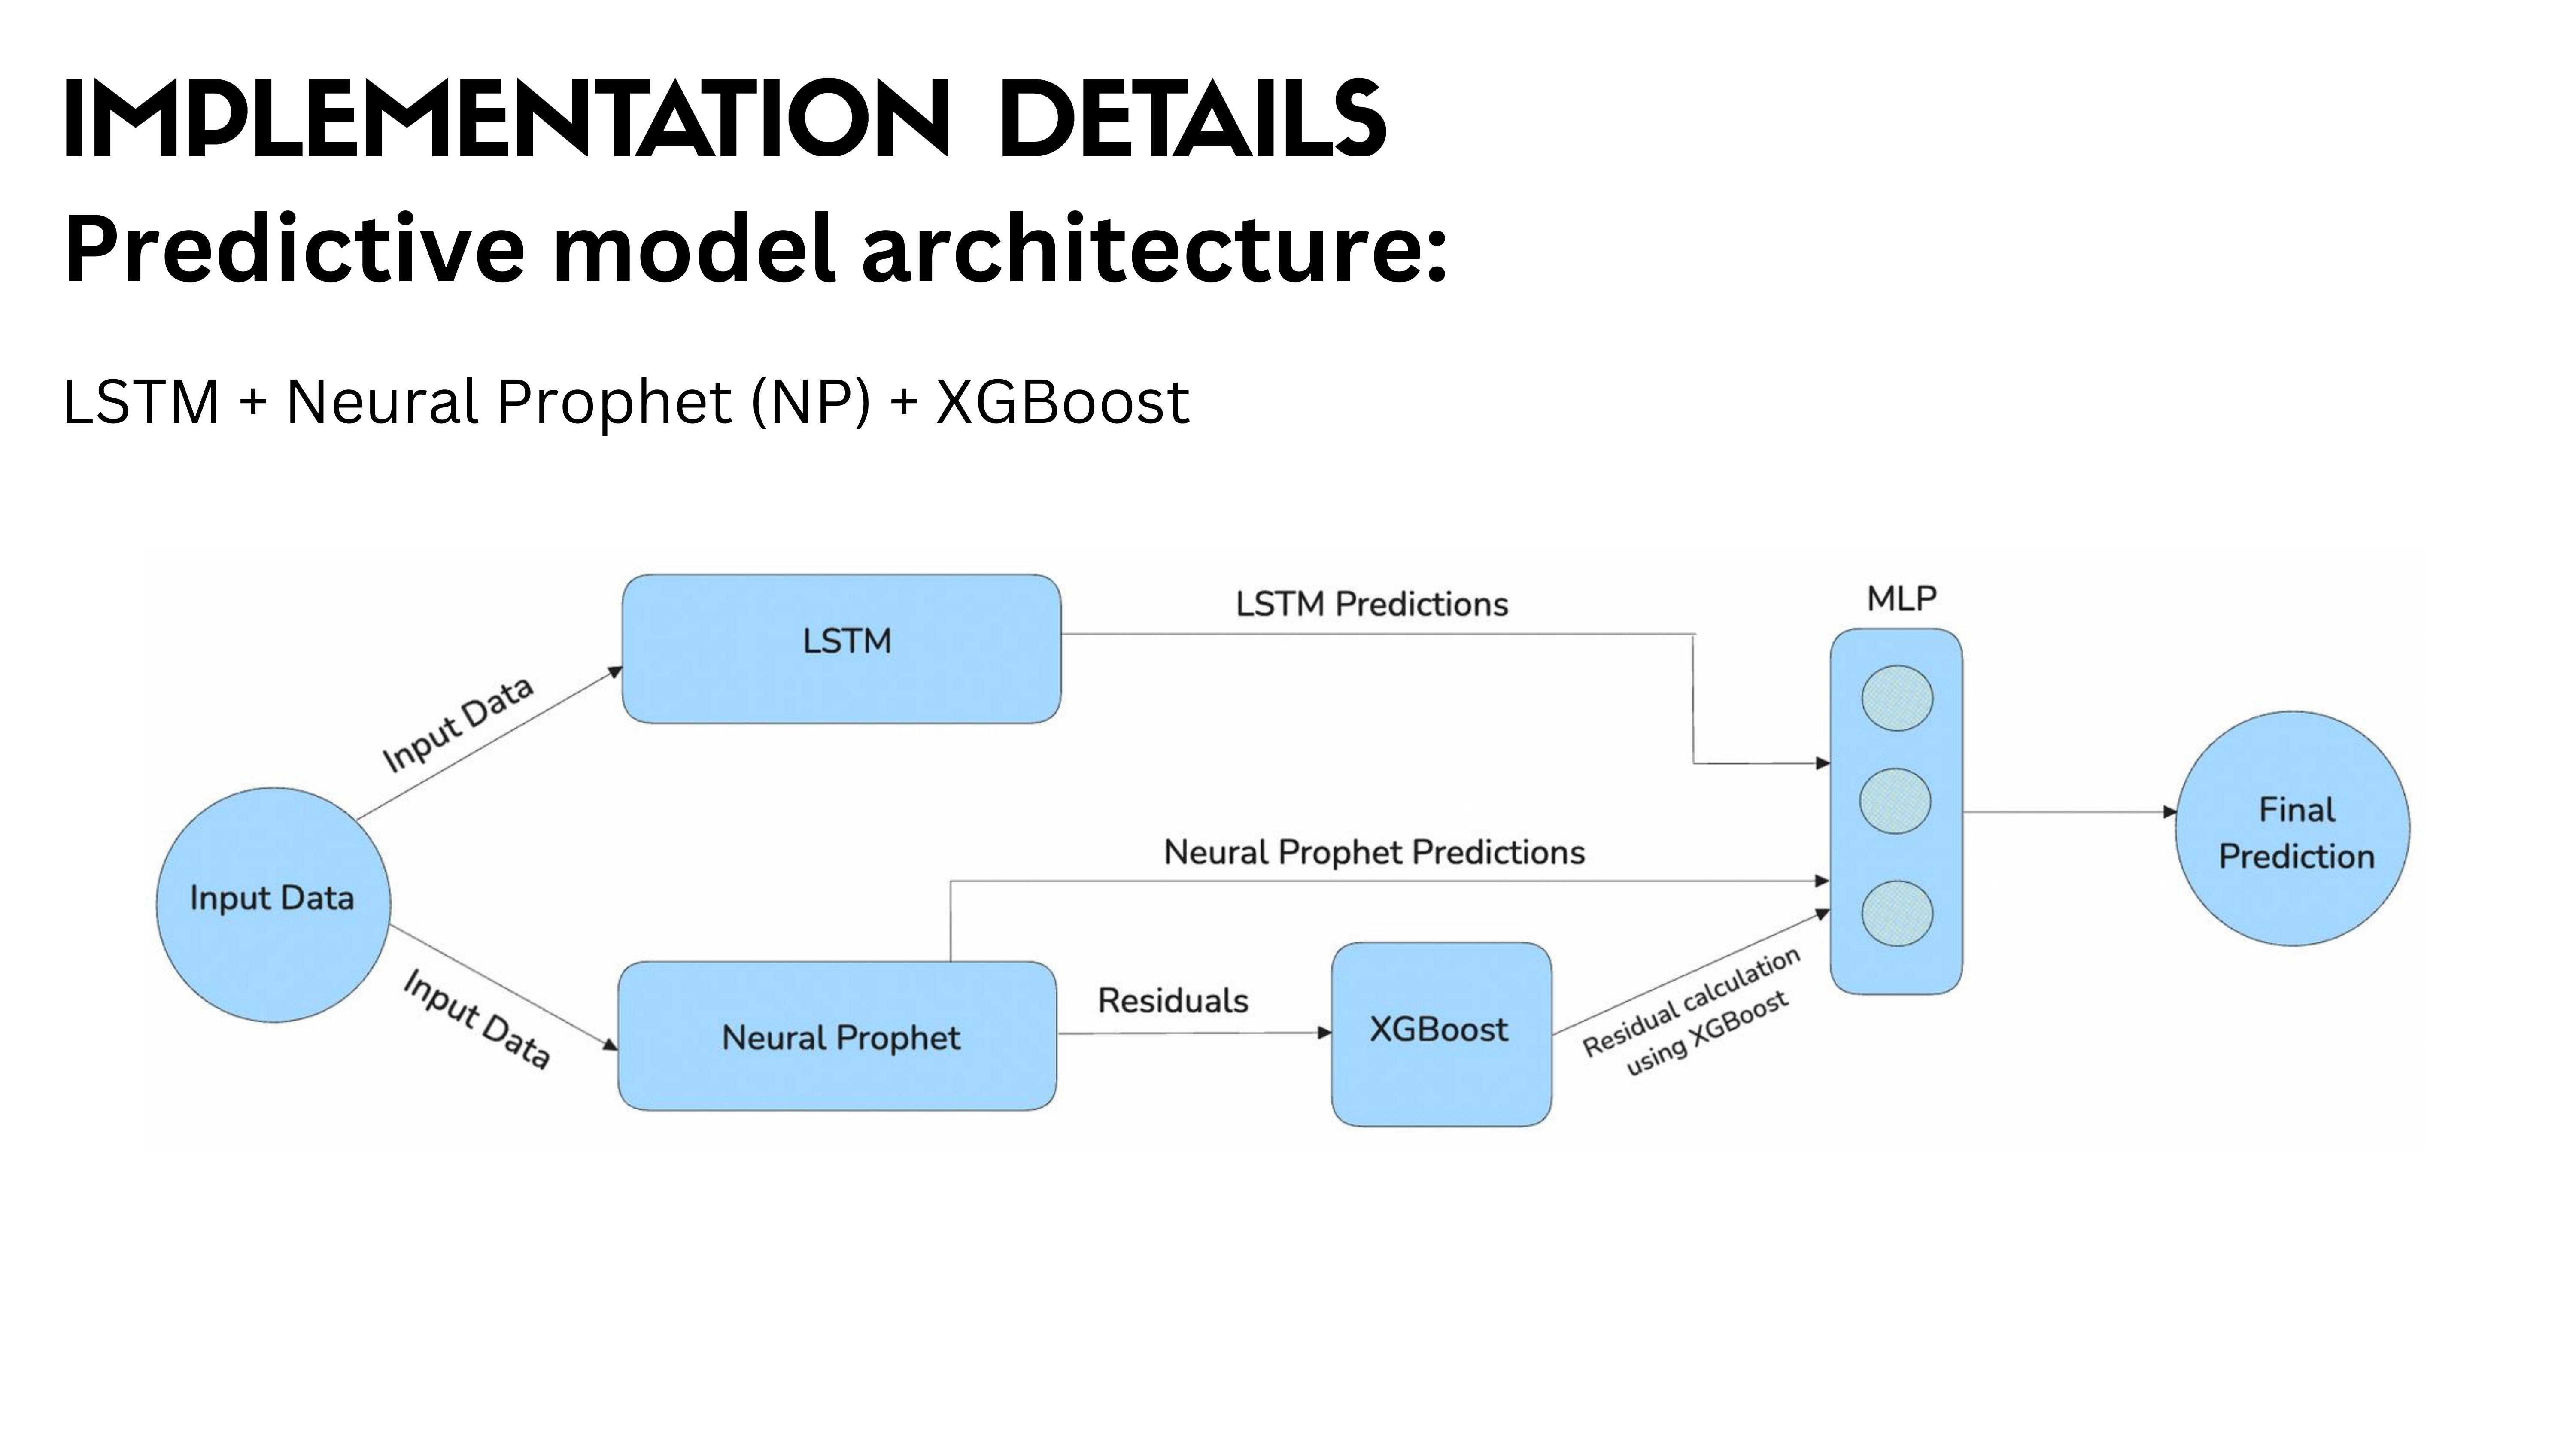 |
Recognizing the unique advantages of each model, we propose a hybrid architecture that synergistically combines LSTM, Neural Prophet, and XGBoost for improved predictive performance.
|
|
ICACT20250232 Slide.06
[Big slide for presentation]
|
Chrome Text-to-Speach Click!! |
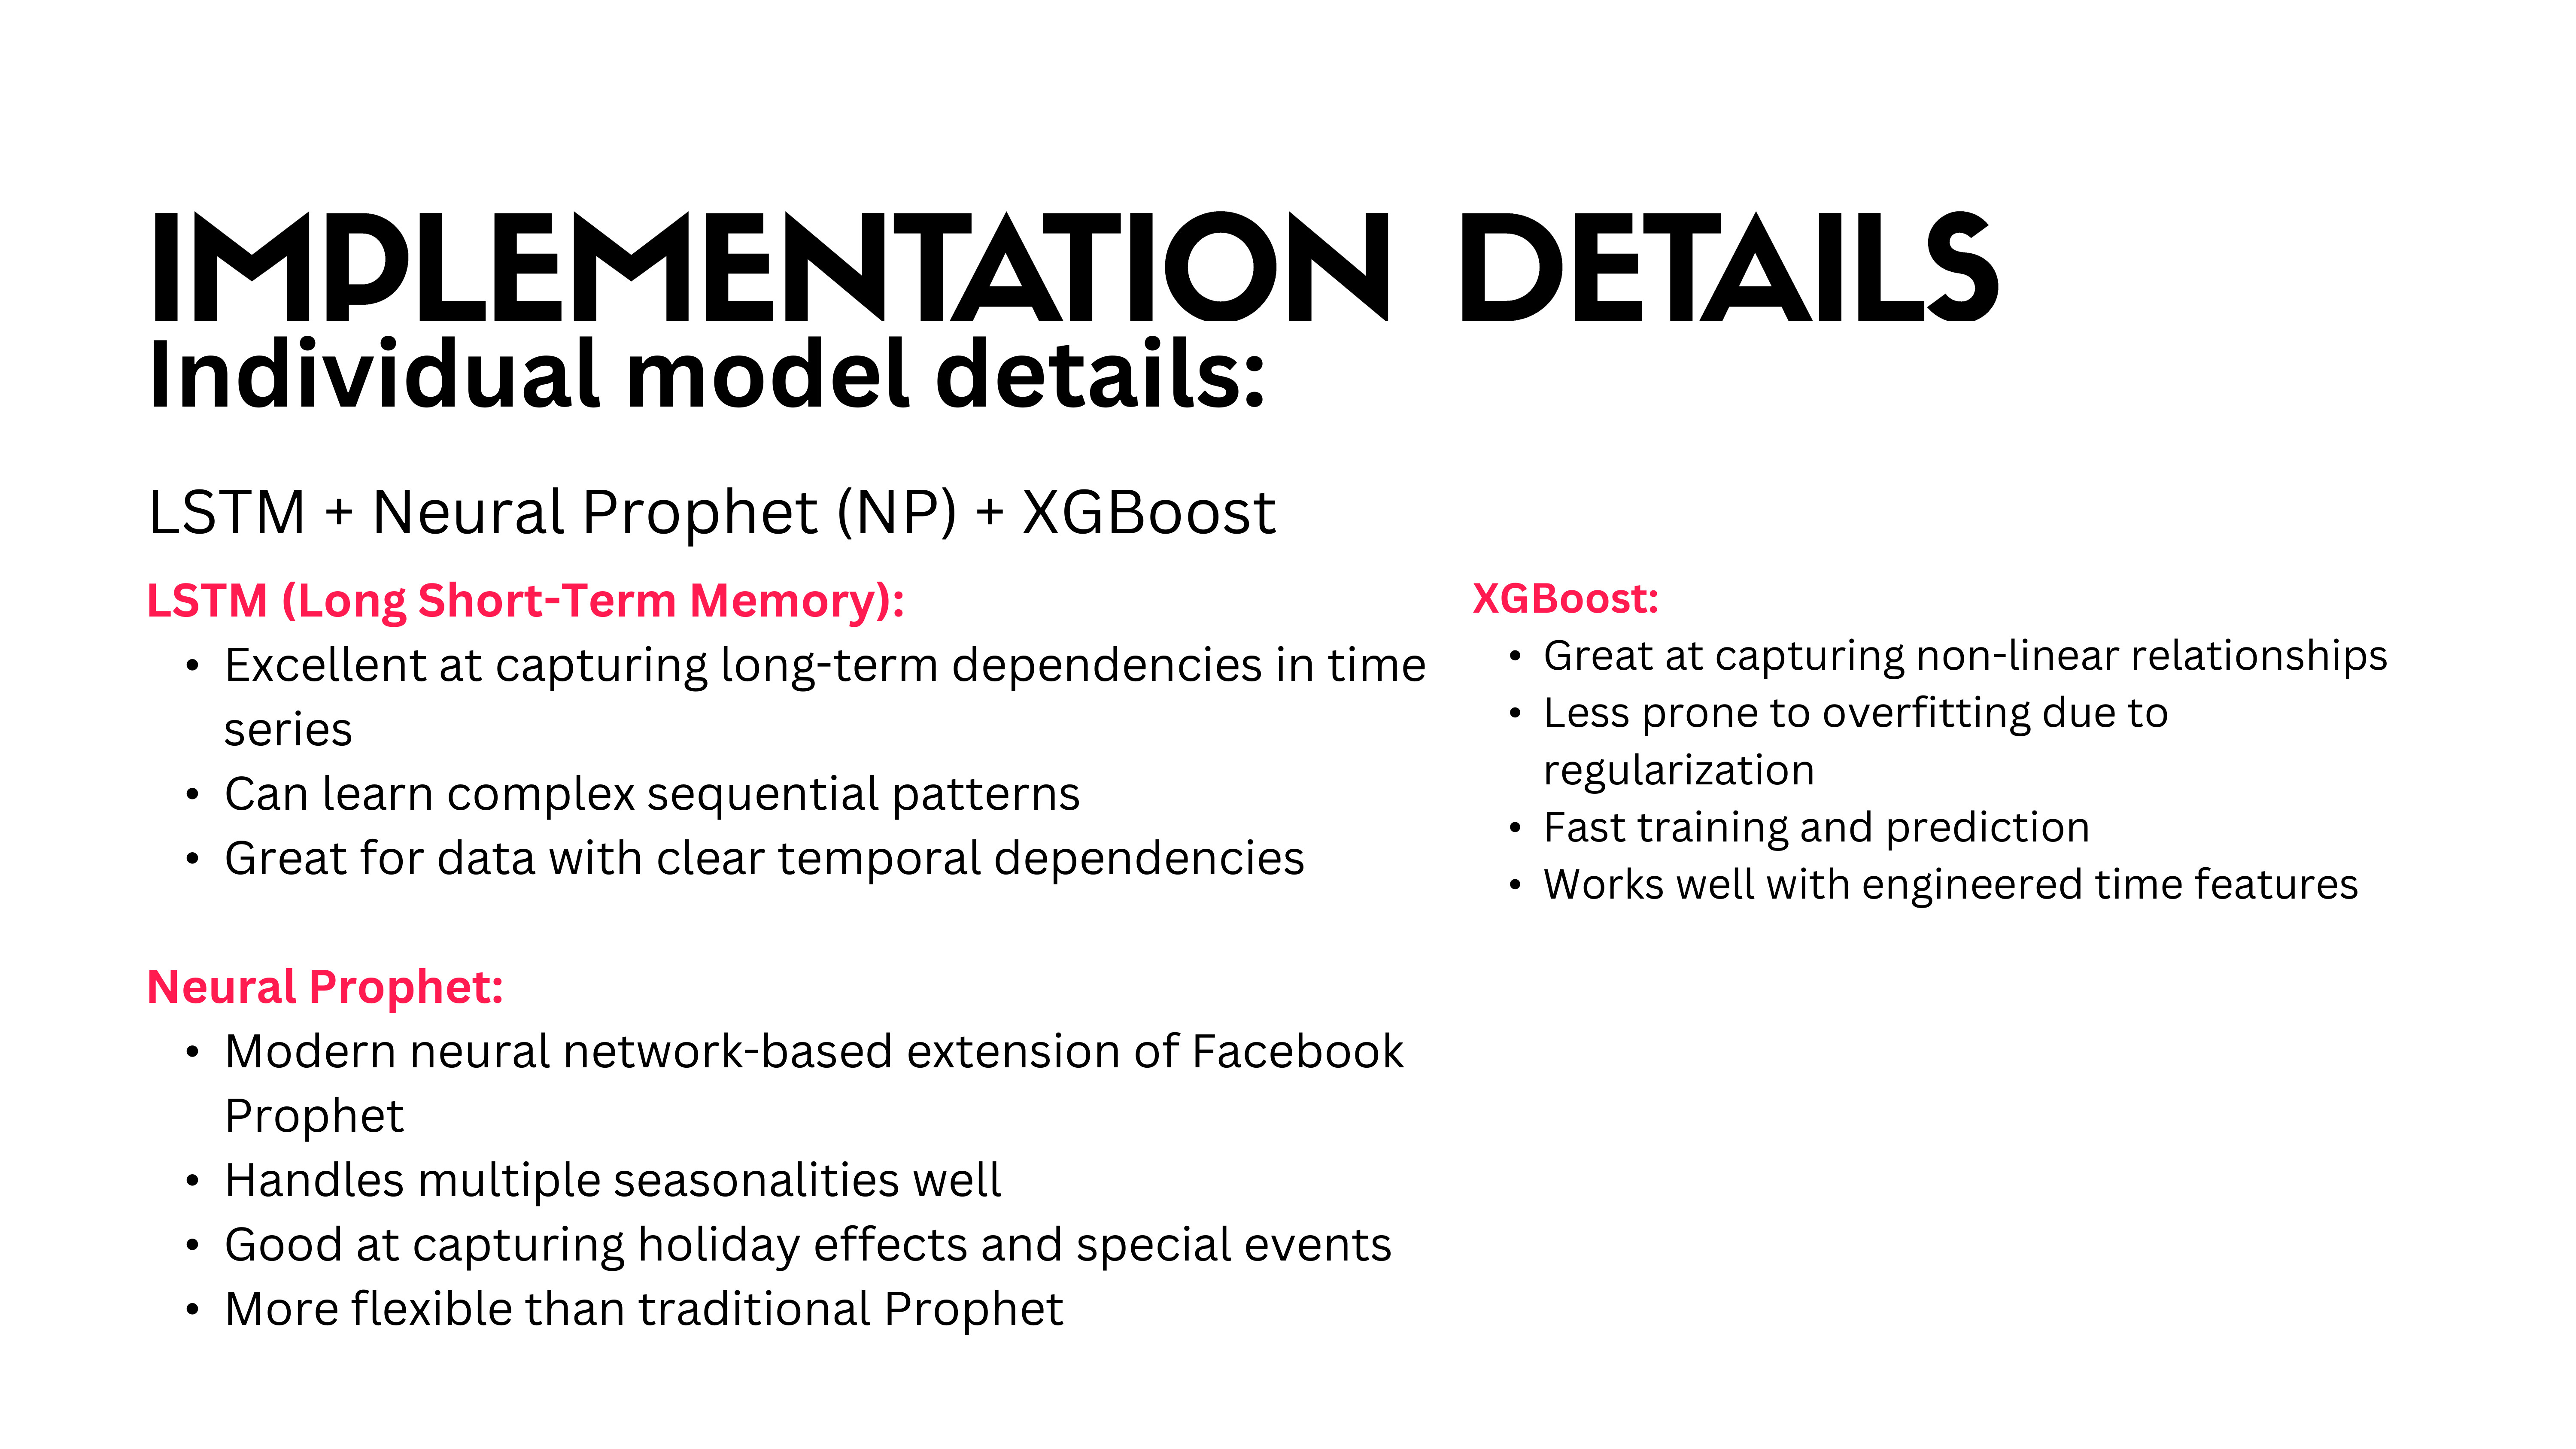 |
mplementation DetailsL
Individual model details:
LSTM, or Long Short-Term Memory, excels at capturing long-term dependencies in time series data. LSTMs can learn complex sequential patterns and are particularly well-suited for data with clear temporal dependencies.
Next, Neural Prophet, a modern neural network-based extension of the popular Prophet model, was incorporated. Neural Prophet handles multiple seasonalities effectively and is adept at capturing the impact of holidays and special events. It offers greater flexibility compared to the traditional Prophet model.
Finally, XGBoost, an ensemble learning method, was included. XGBoost is known for its ability to capture non-linear relationships in data. It is less prone to overfitting due to its regularization techniques. XGBoost also boasts fast training and prediction times and works well with engineered time features.
|
|
ICACT20250232 Slide.05
[Big slide for presentation]
|
Chrome Text-to-Speach Click!! |
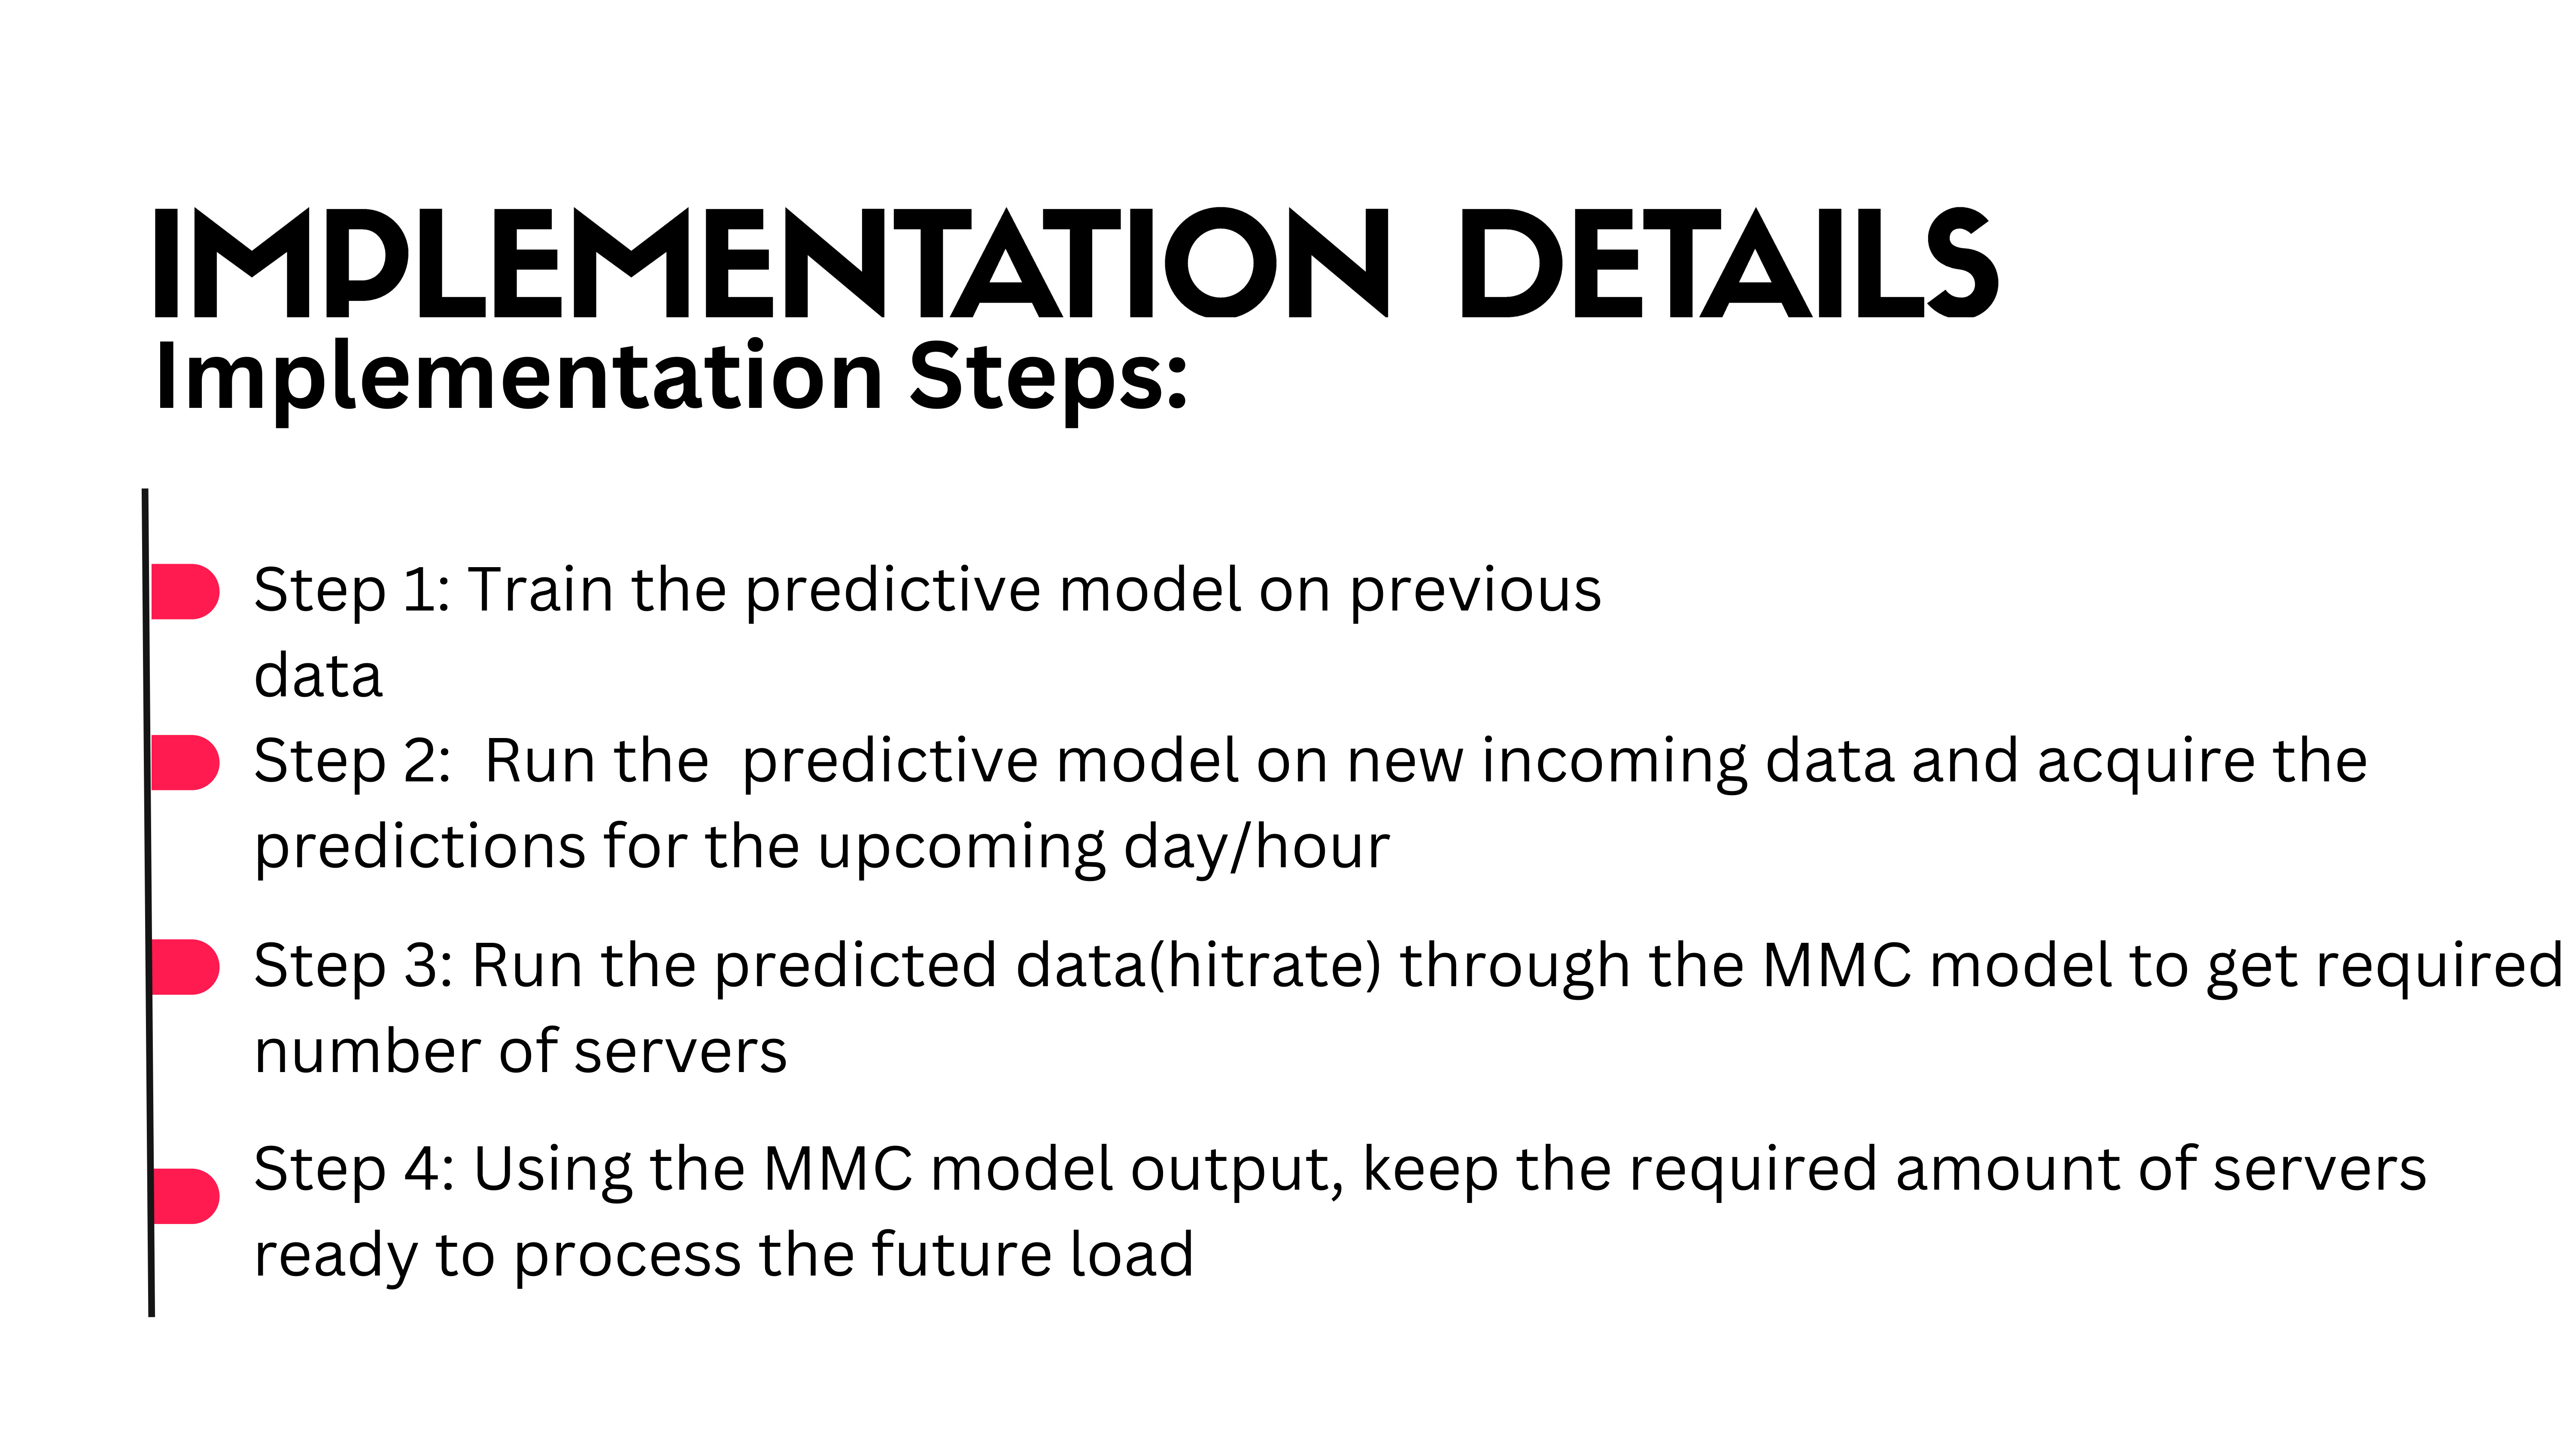 |
IMPLEMENTATION DETAILS
Implementation Steps:
Step 1: Train the predictive model on previous data
Step 2: Run the predictive model on new incoming data and acquire the predictions for the upcoming day/hour
Step 3: Run the predicted data (hitrate) through the MMC model to get required number of servers
Step 4: Using the MMC model output, keep the required amount of servers ready to process the future load
|
|
ICACT20250232 Slide.04
[Big slide for presentation]
|
Chrome Text-to-Speach Click!! |
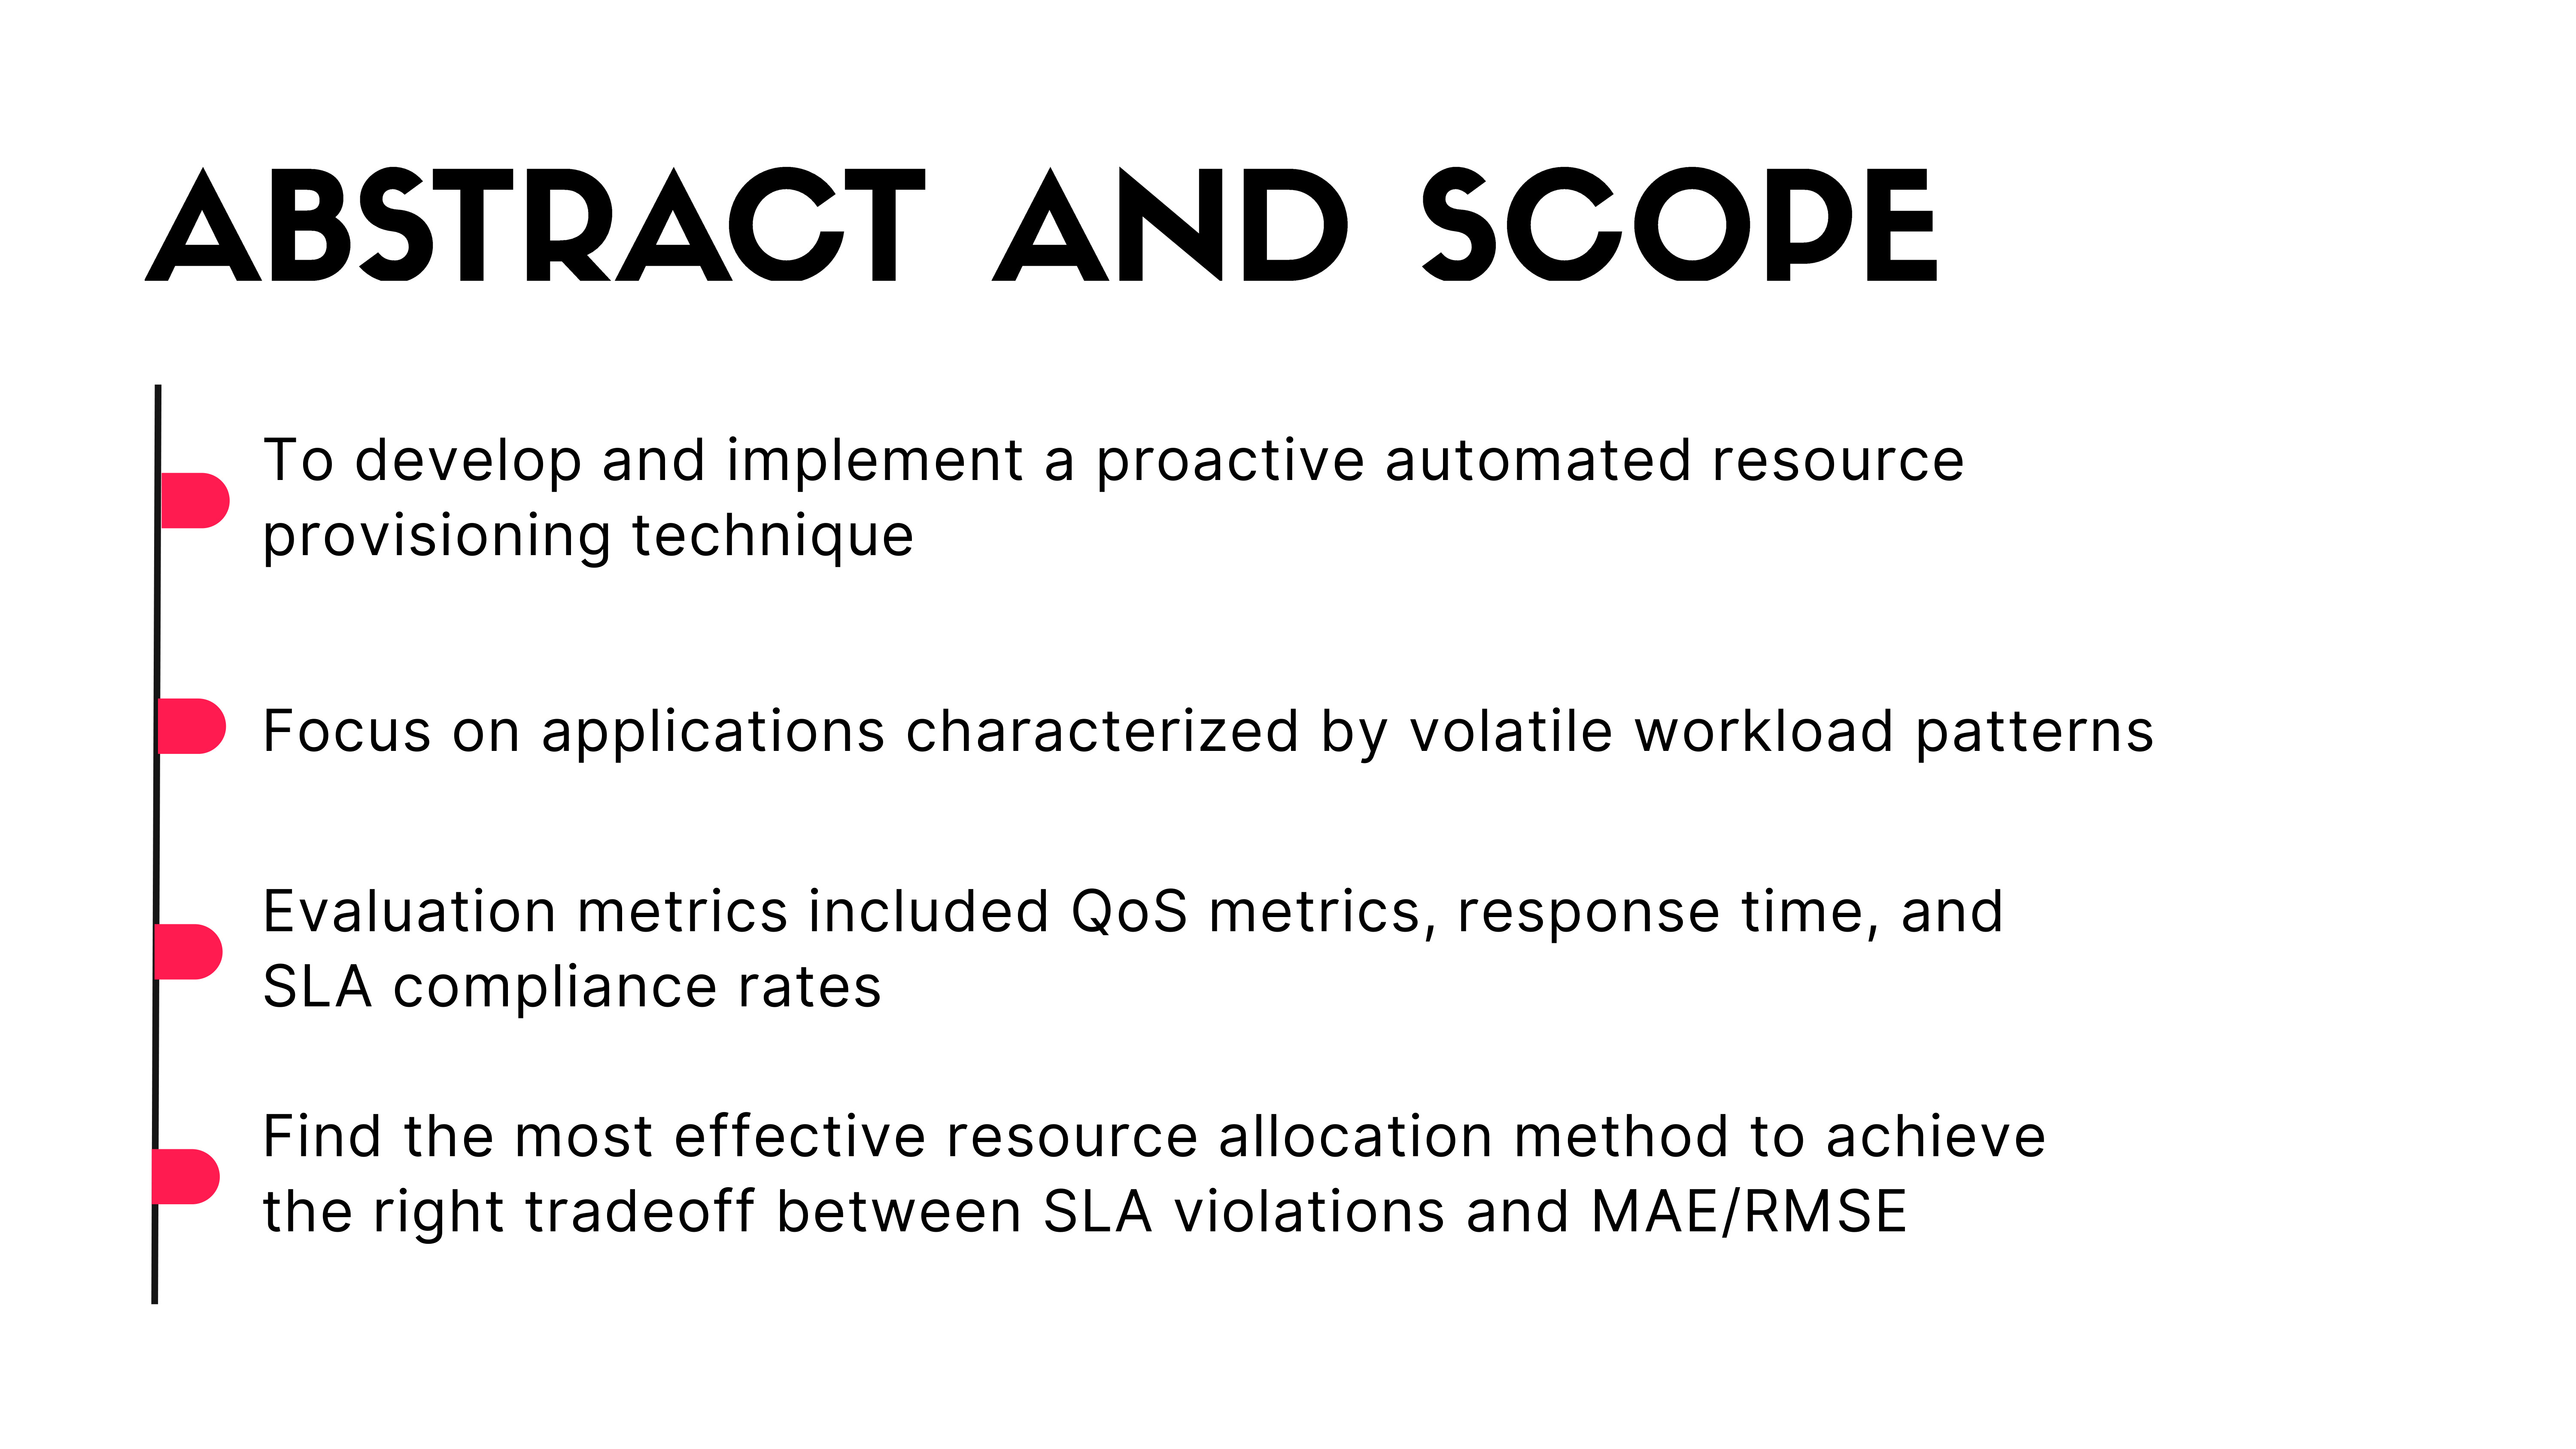 |
ABSTRACT AND SCOPE:
To develop and implement a proactive automated resource provisioning technique
Focus on applications characterized by volatile workload patterns
Evaluation metrics included QoS metrics, response time, and SLA compliance rates
Find the most effective resource allocation method to achieve the right tradeoff between SLA violations and MAE/RMSE
|
|
ICACT20250232 Slide.03
[Big slide for presentation]
|
Chrome Text-to-Speach Click!! |
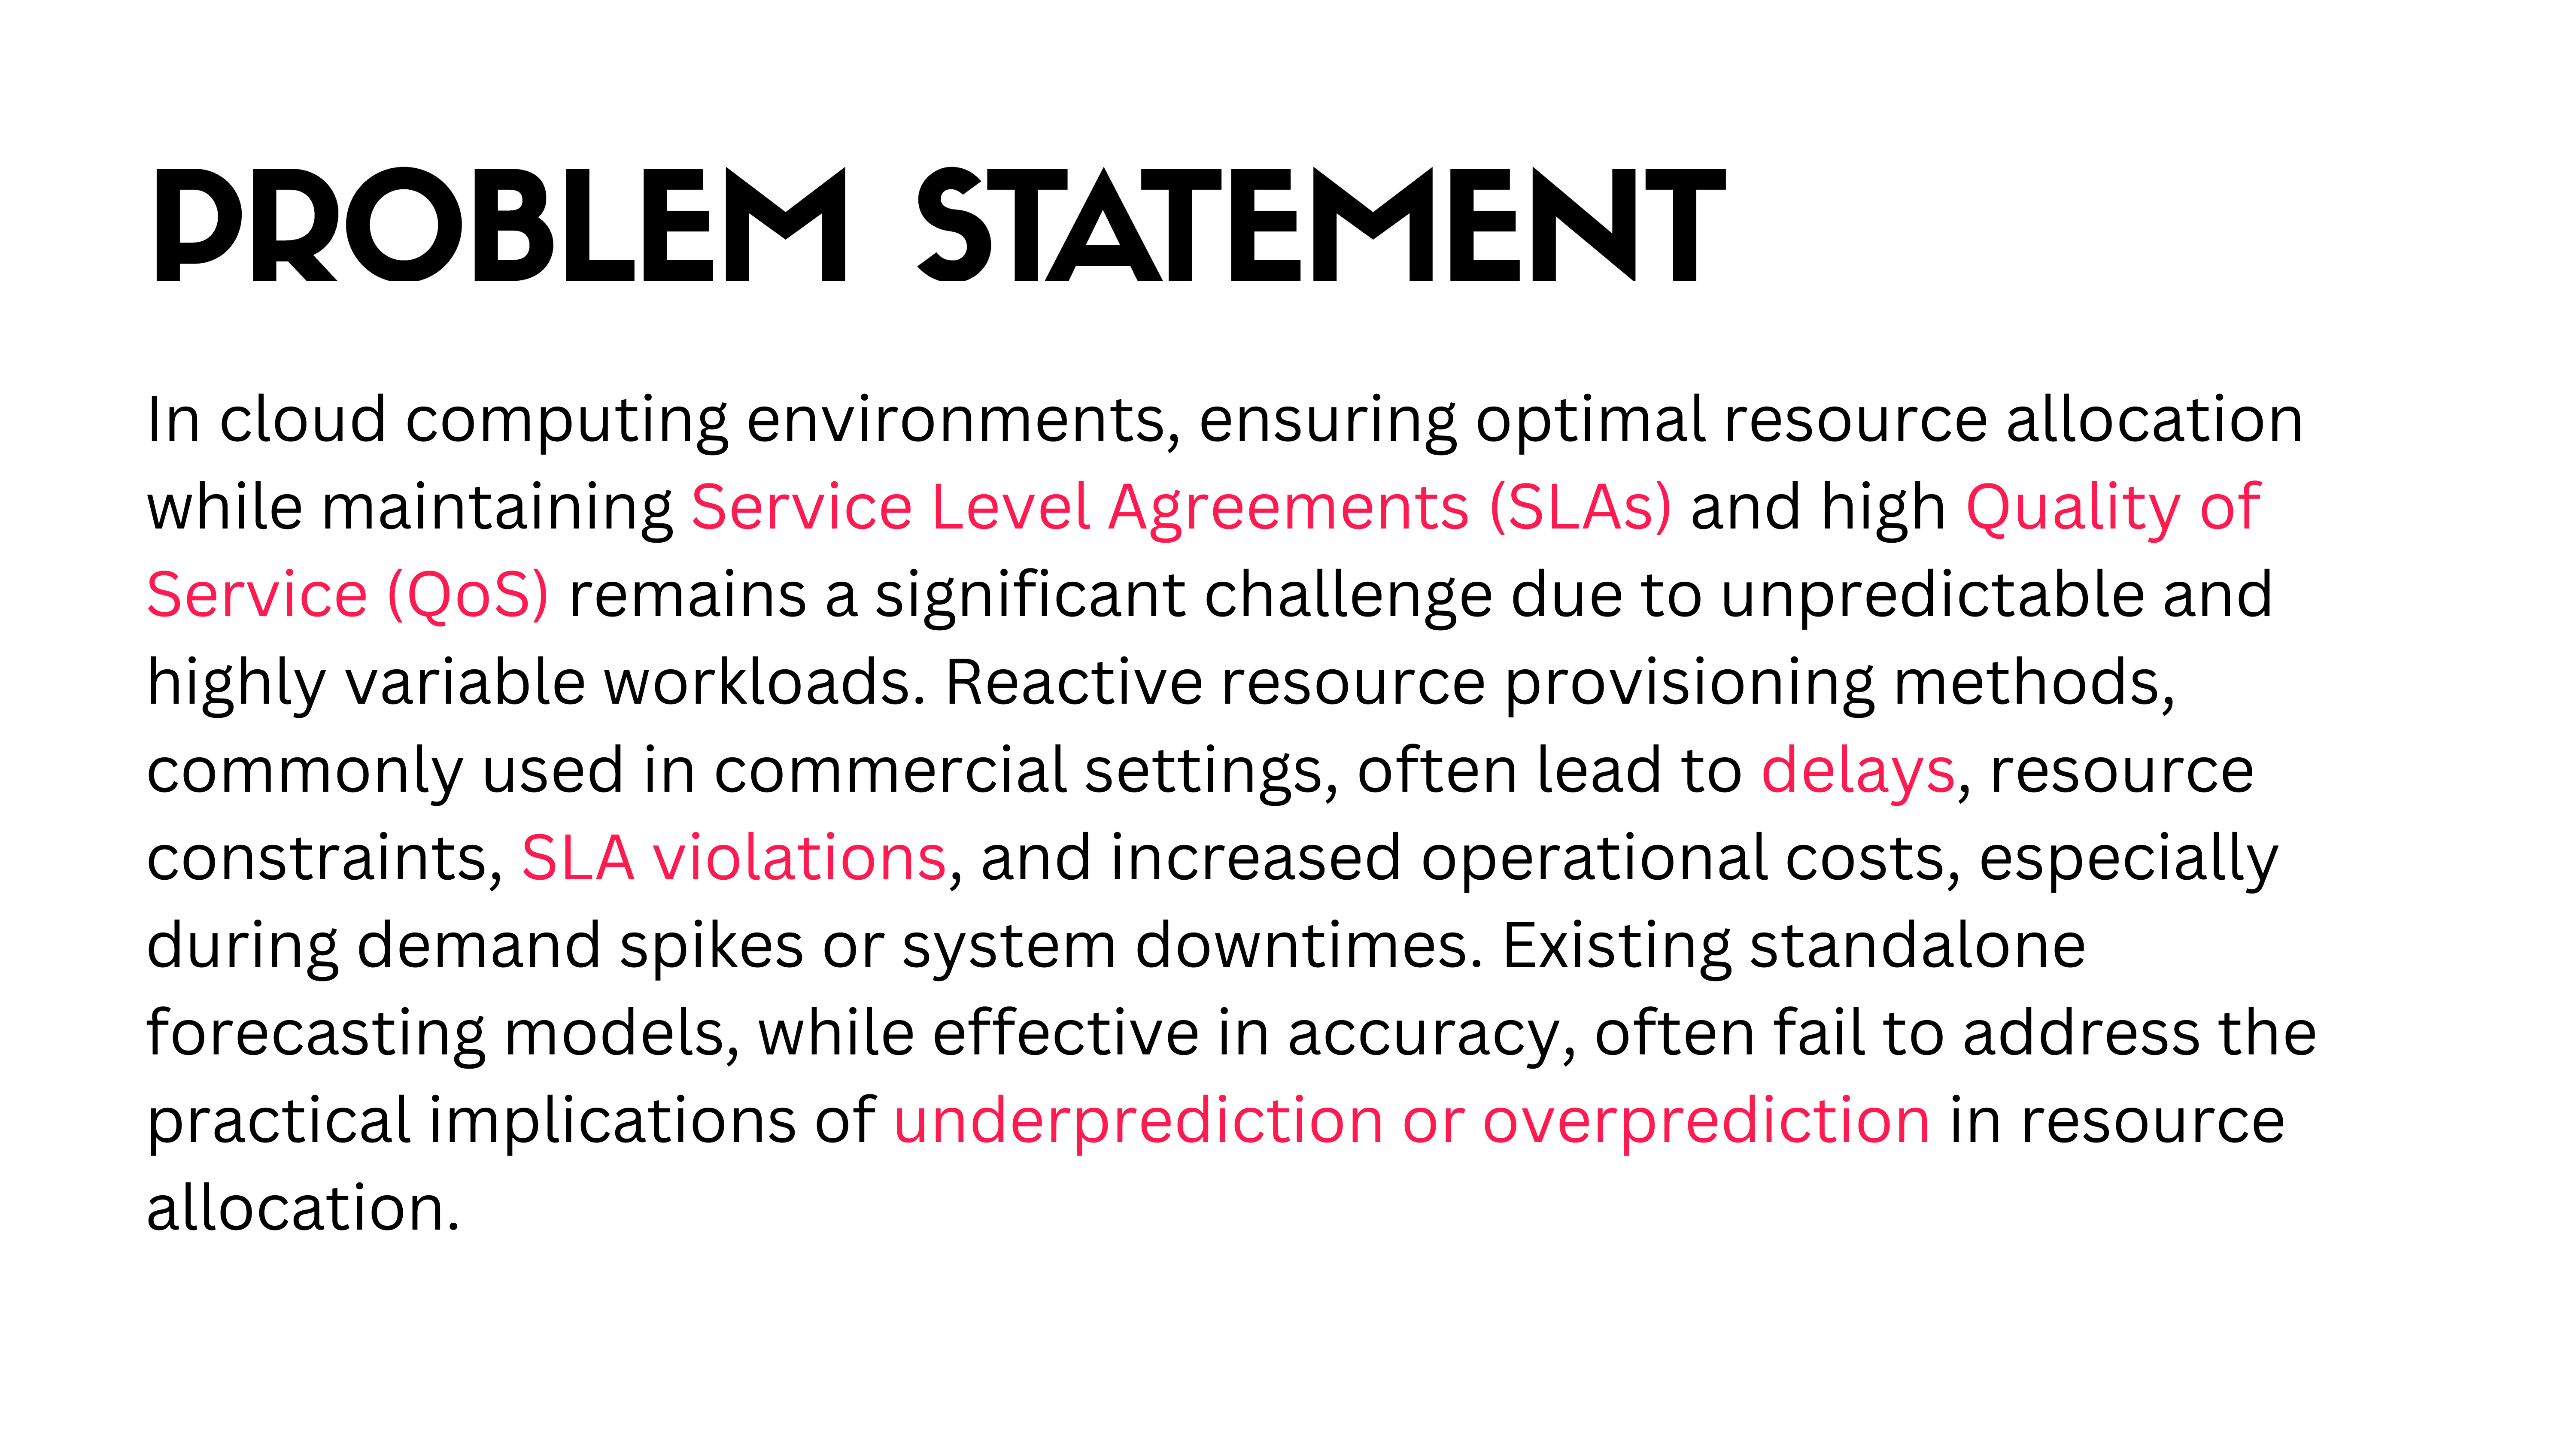 |
Problem Statement:
In cloud computing environments, ensuring optimal resource allocation while maintaining Service Level Agreements (SLAs) and high Quality of Service (QoS) remains a significant challenge due to unpredictable and highly variable workloads. Reactive resource provisioning methods, commonly used in commercial settings, often lead to delays, resource constraints, SLA violations, and increased operational costs, especially during demand spikes or system downtimes. Existing standalone forecasting models, while effective in accuracy, often fail to address the practical implications of under-prediction or over-prediction in resource allocation.
|
|
ICACT20250232 Slide.02
[Big slide for presentation]
|
Chrome Text-to-Speach Click!! |
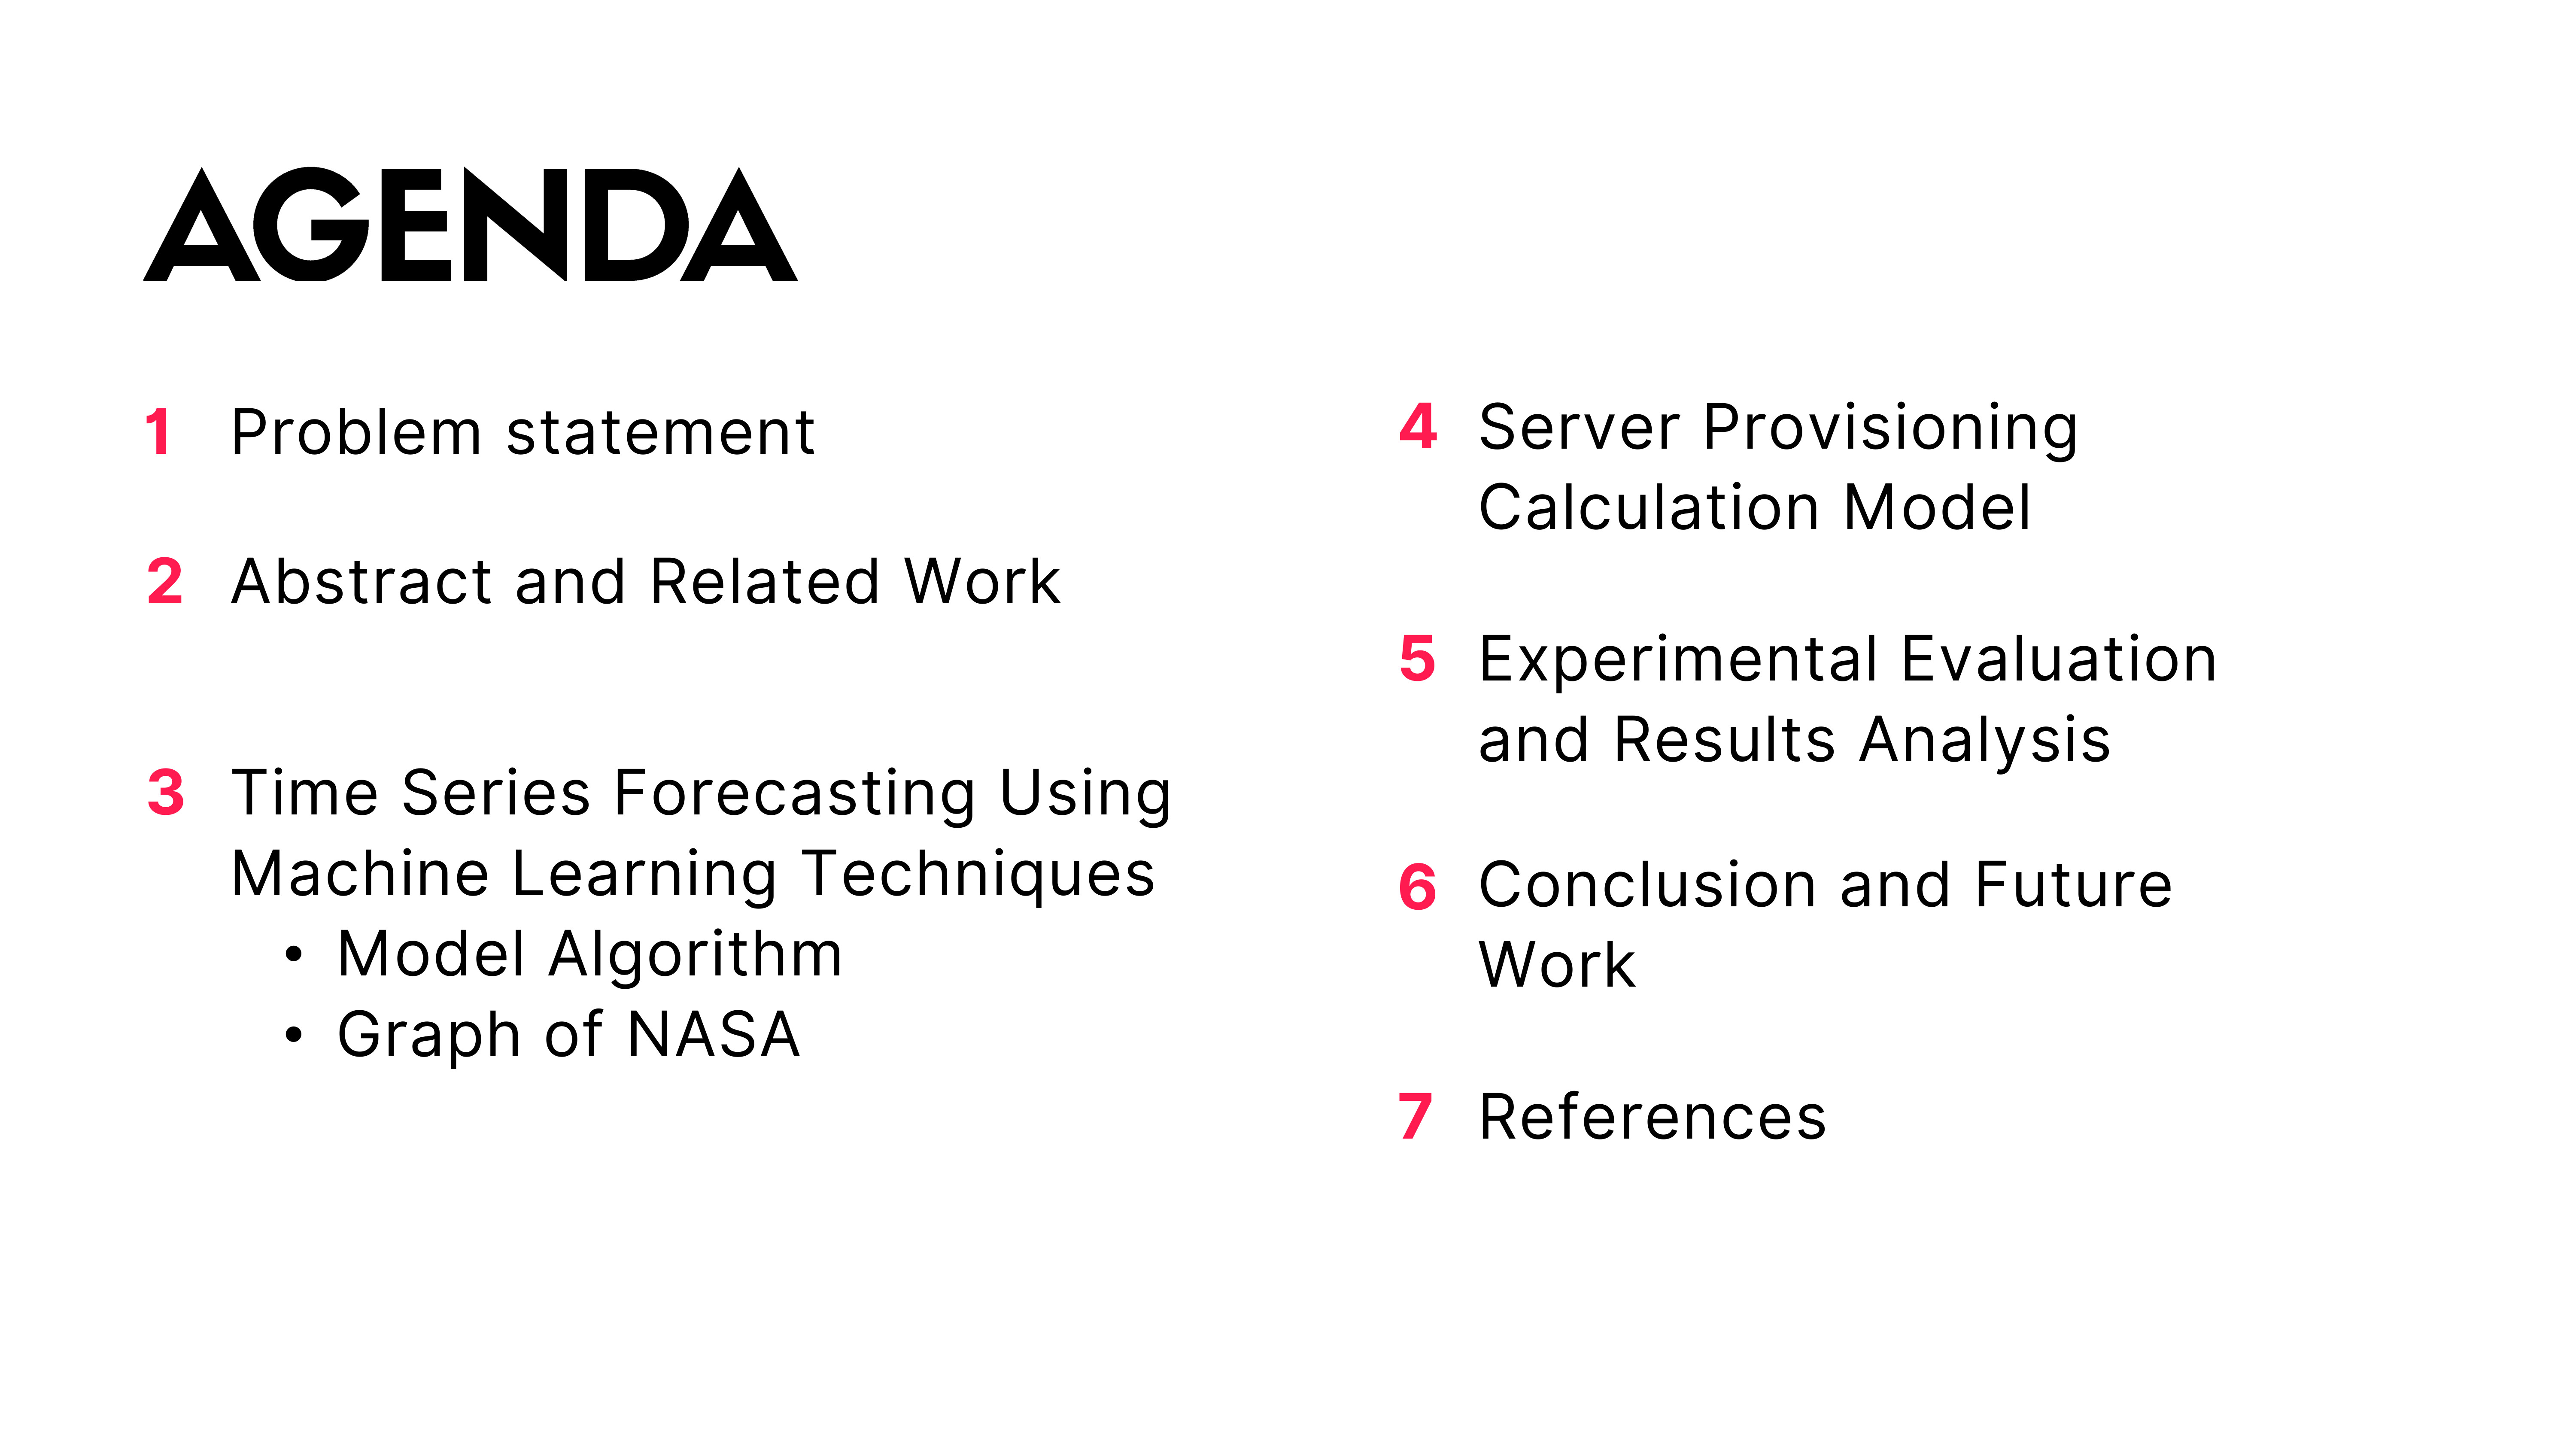 |
AGENDA:
1. Problem statement
2. Abstract and Related Work
3. Time Series Forecasting Using Machine Learning Techniques
3.a Model Algorithm
3.b Graph of NASA
4. Server Provisioning Calculation Model
5. Experimental Evaluation and Results Analysis
6. Conclusion and Future Work
7. References
|
|
ICACT20250232 Slide.01
[Big slide for presentation]
|
Chrome Text-to-Speach Click!! |
 |
This presentation discusses an approach to proactive load forecasting in a cloud environment
|
















