 ICACT20230066 Slide.20
[Big slide for presentation]
[YouTube] |
Chrome Text-to-Speach Click!! |
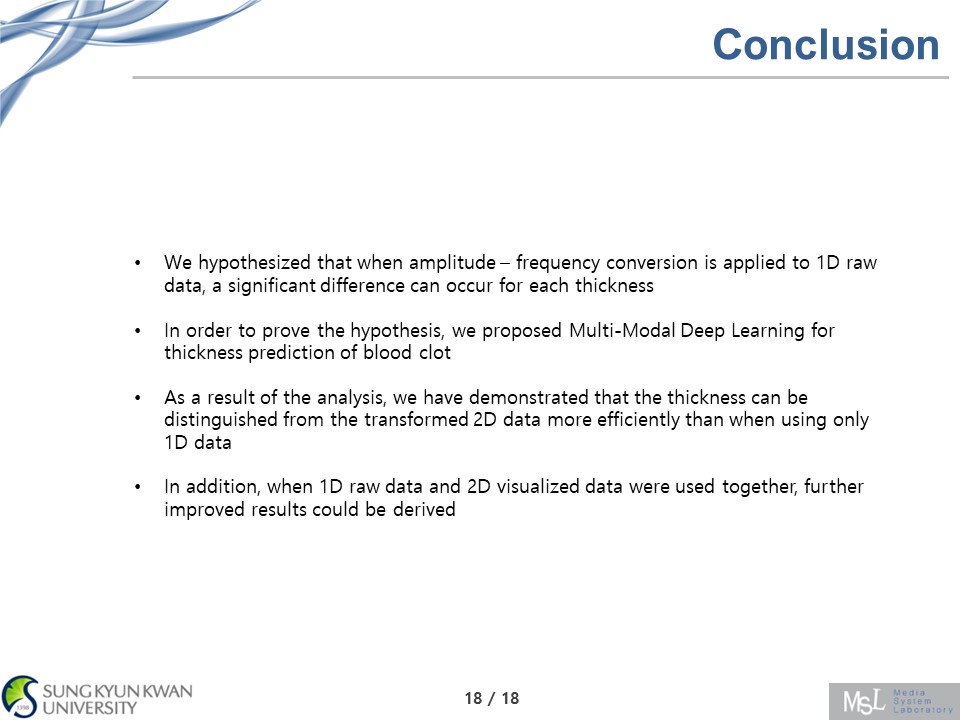 |
However, since the above experiment was conducted based on self-produced data, additional research will be needed on whether clinically significant results can be derived.
|
|
ICACT20230066 Slide.19
[Big slide for presentation]
[YouTube] |
Chrome Text-to-Speach Click!! |
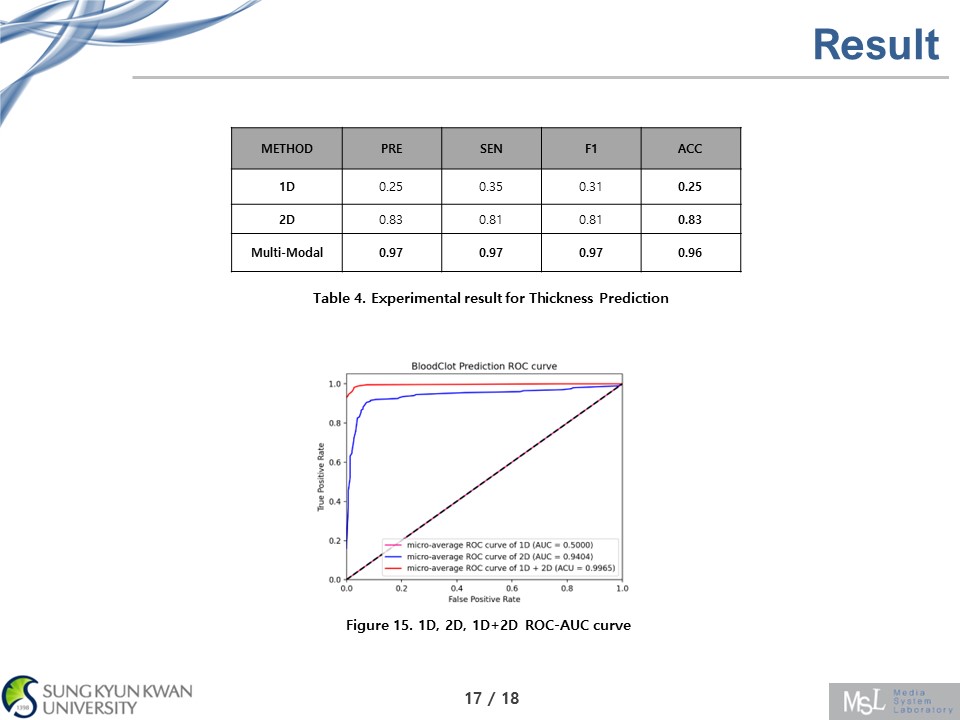 |
The following is a comparison of the three experimental results.
This experiment shows that using two types of data can make a more accurate thrombus thickness determination.
|
|
ICACT20230066 Slide.18
[Big slide for presentation]
[YouTube] |
Chrome Text-to-Speach Click!! |
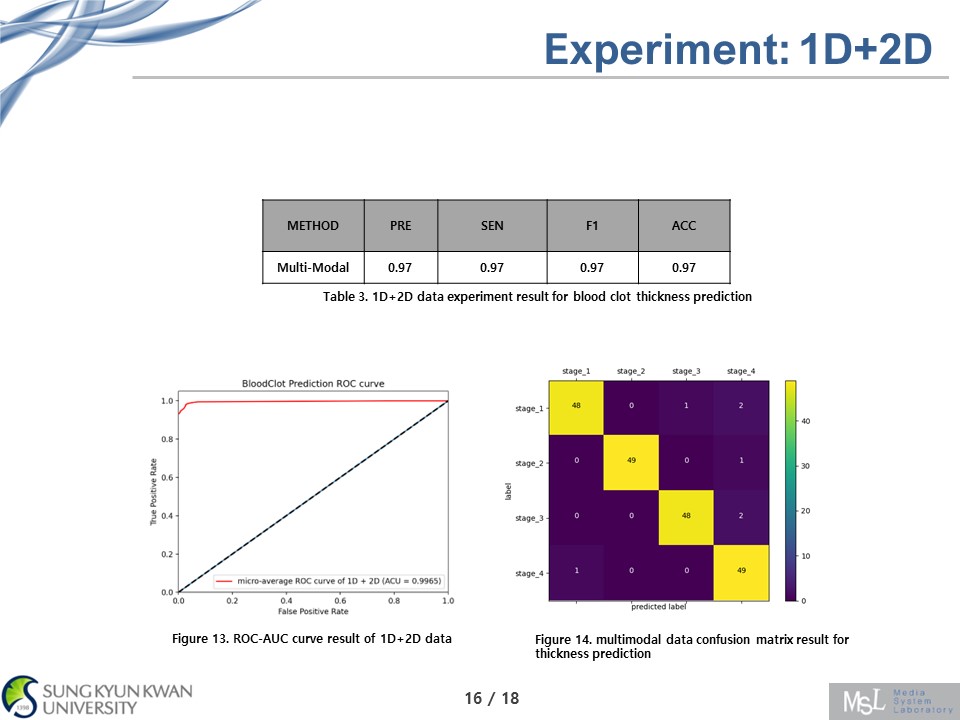 |
The result when using the two data together is as follows. It shows good overall performance and the Roc-AUC cuve is also close to 1, and it is indicating more accurate thickness prediction compared to the previous experiment. And figure 13 shows very accurate result about 4 stage thickness prediction
|
|
ICACT20230066 Slide.17
[Big slide for presentation]
[YouTube] |
Chrome Text-to-Speach Click!! |
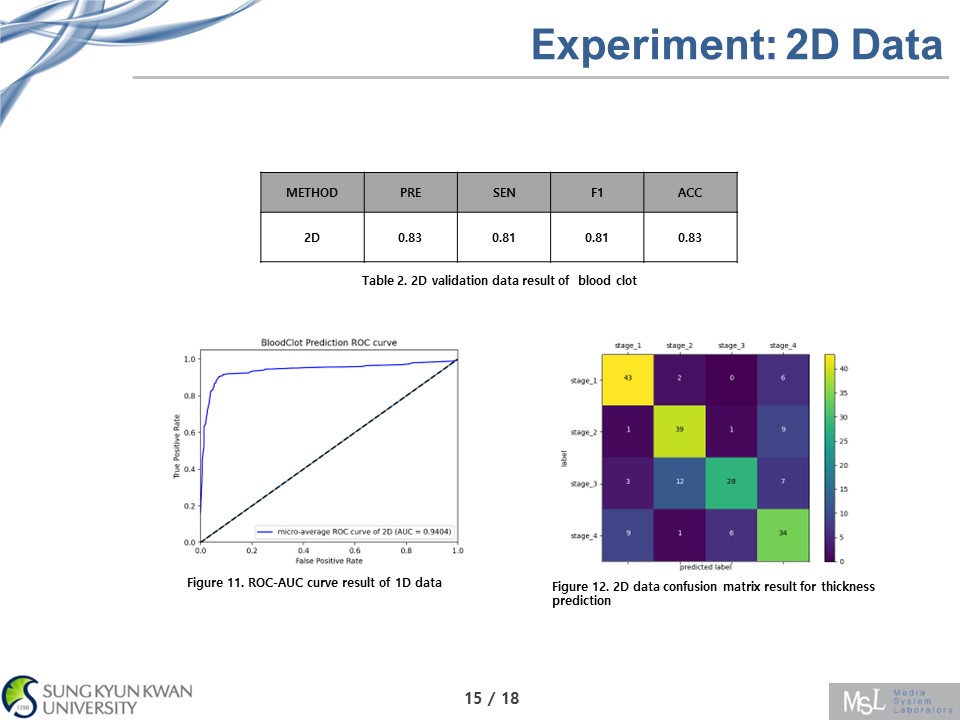 |
This is when the blood clot thickness is predicted using only 2D data. We used 2D convolution and the results are in Table 2. Overall, it shows an improvement over 1D results, but it is not a good performance yet. And also, figure 12 shows better results than 1D confusion matrix, but still shows inaccurate result.
|
|
ICACT20230066 Slide.16
[Big slide for presentation]
[YouTube] |
Chrome Text-to-Speach Click!! |
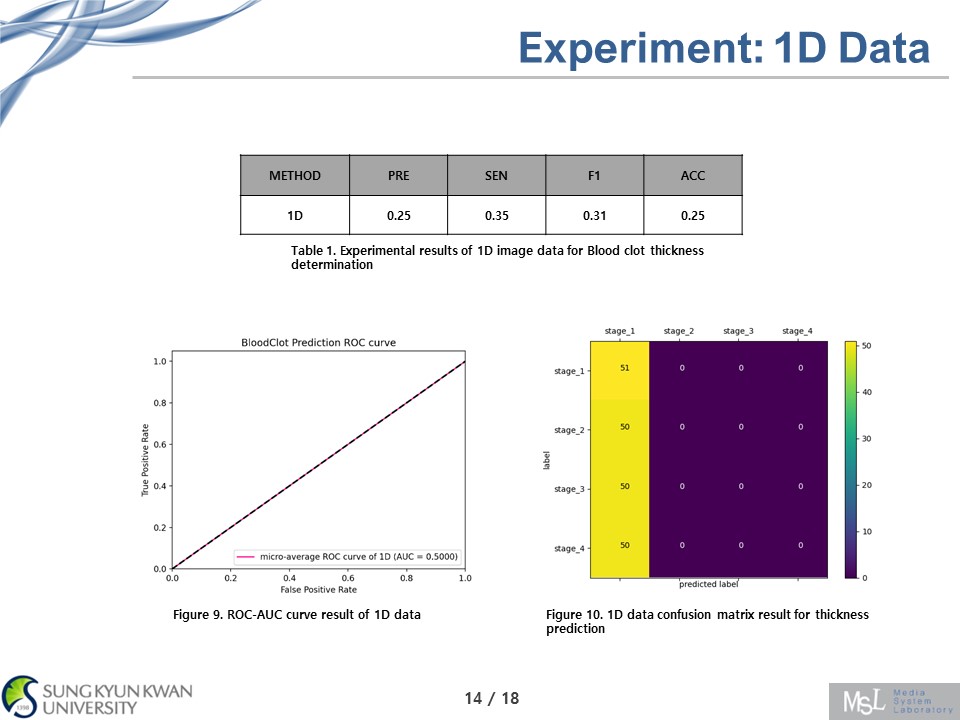 |
This result is when the blood clot thickness is predicted using only 1D data. We used 1D convolution and the results are in Table 1. Four performance evaluation indicators were used. We tried not only to measure accuracy, but also to measure Precision, Sensitivity, and F1 score to show whether this experiment is really accurate.
Overall, it shows low performance in thickness prediction and low performance in ROC-AUC curve. ROC-AUC curve indicates better performance as the curve close to 1.
Figure 10 is 1D data confusion matrix result for thickness prediction. In here, prediction value is almost stage 1. so, only using 1D data shows inaccurate prediction.
|
|
ICACT20230066 Slide.15
[Big slide for presentation]
[YouTube] |
Chrome Text-to-Speach Click!! |
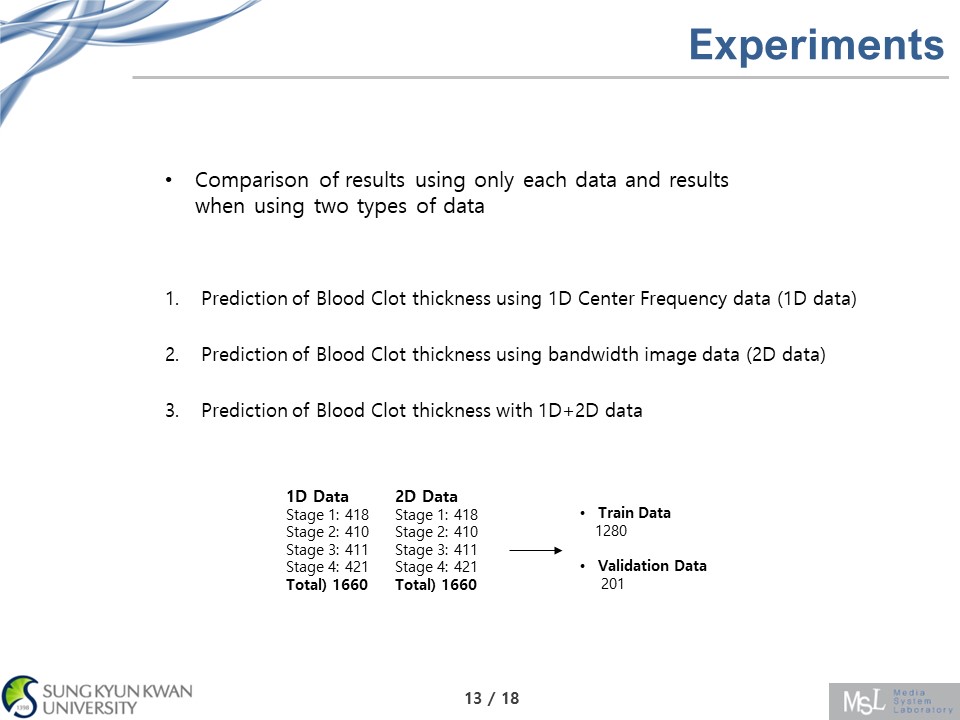 |
In order to prove whether the two types of data are effective in blood clot thickness prediction, 1D data and 2D data were first tested, and then the two types of data were used together,
So we conducted three experiments.
|
|
ICACT20230066 Slide.14
[Big slide for presentation]
[YouTube] |
Chrome Text-to-Speach Click!! |
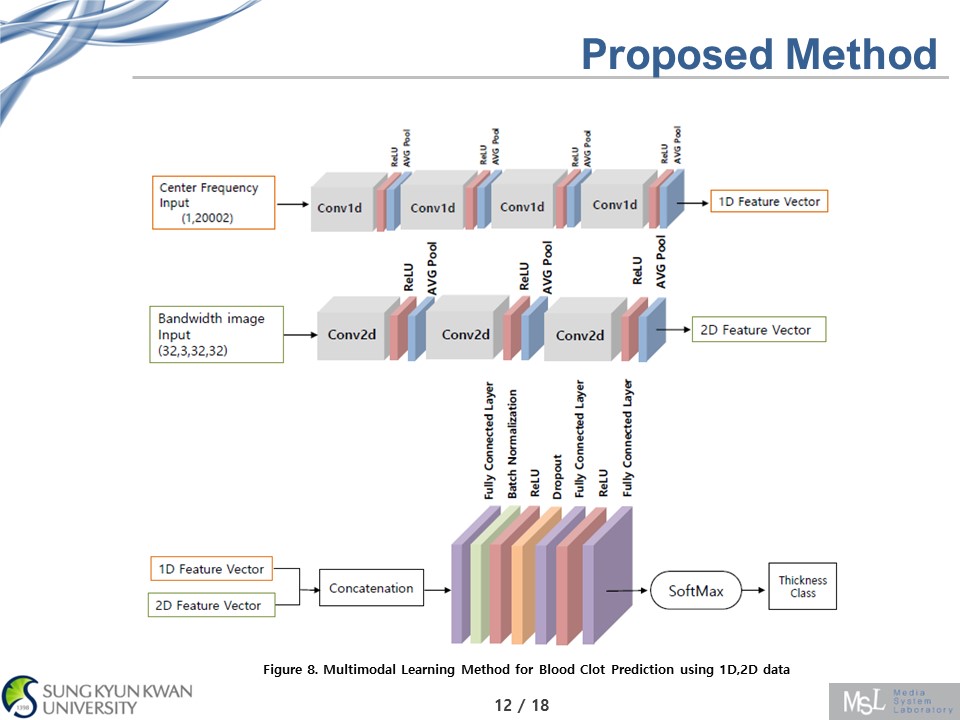 |
In figure 8, Overfitting is solved by applying dropout and deleting 30% of neurons in the hidden layer while learning
And By applying Batch Normalization, the problem of falling into the local minimum is prevented, and the learning result is improved and faster.
|
|
ICACT20230066 Slide.13
[Big slide for presentation]
[YouTube] |
Chrome Text-to-Speach Click!! |
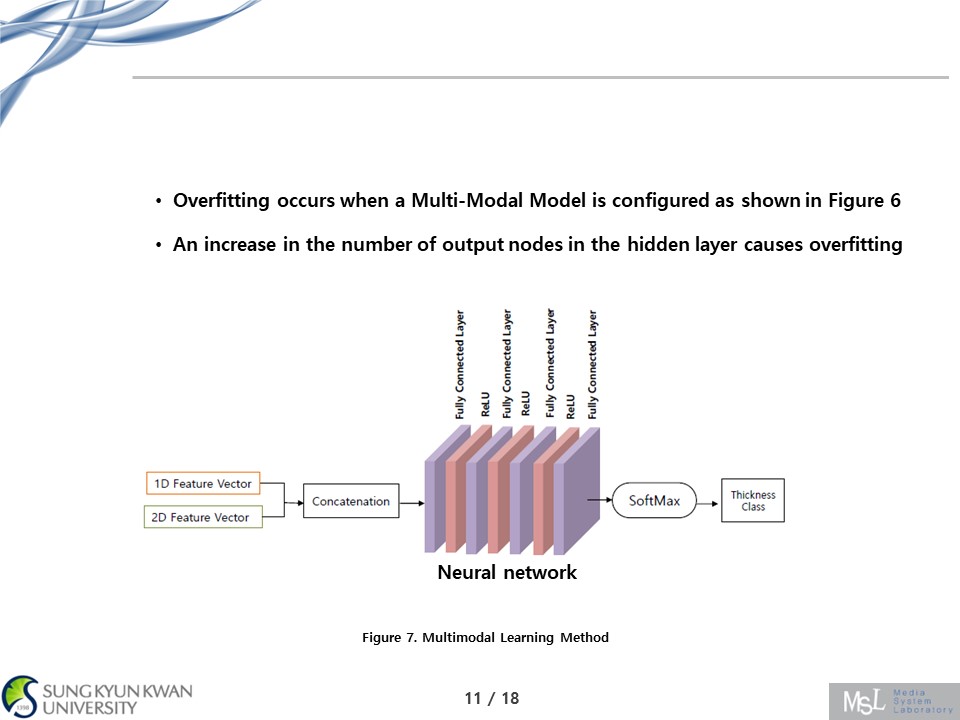 |
At this time, if fully connected layer is configured as shown in Fig. 7, overfitting problem occurs
Because increase in the number of output nodes in the hidden layer causes overfitting
|
|
ICACT20230066 Slide.12
[Big slide for presentation]
[YouTube] |
Chrome Text-to-Speach Click!! |
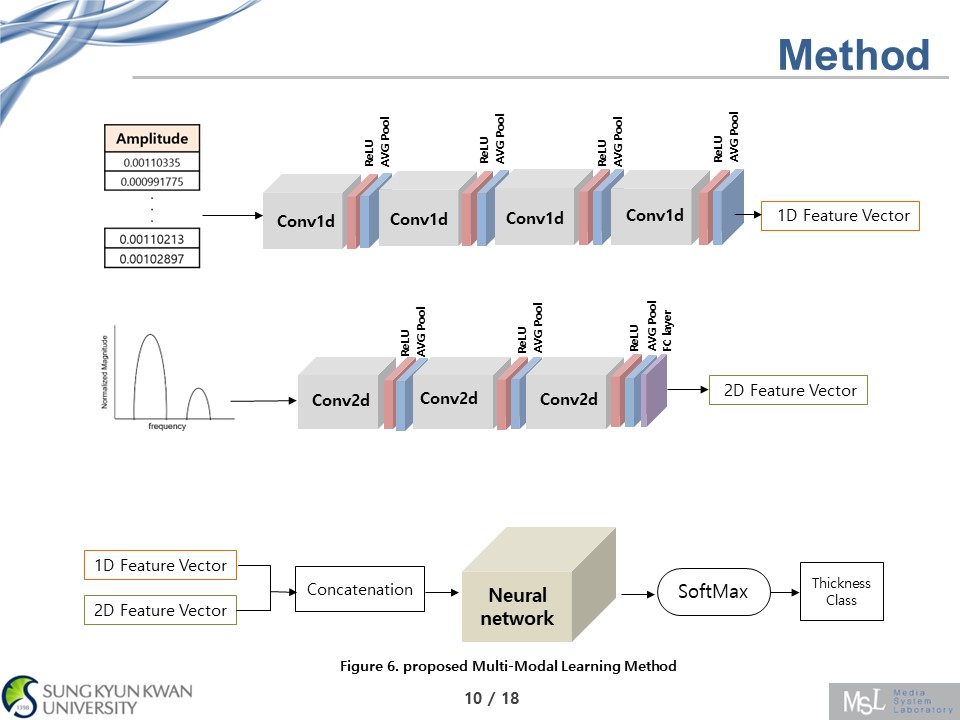 |
The multimodal method is as follows. First, 1D features are extracted using 1D convolution, 2D features are extracted using 2D convolution, and feature vectors from each network are combined through simple feature concatenation. Then, by adding a fully connected layer, the multimodal method is performed by learning all parameters using a loss function.
|
|
ICACT20230066 Slide.11
[Big slide for presentation]
[YouTube] |
Chrome Text-to-Speach Click!! |
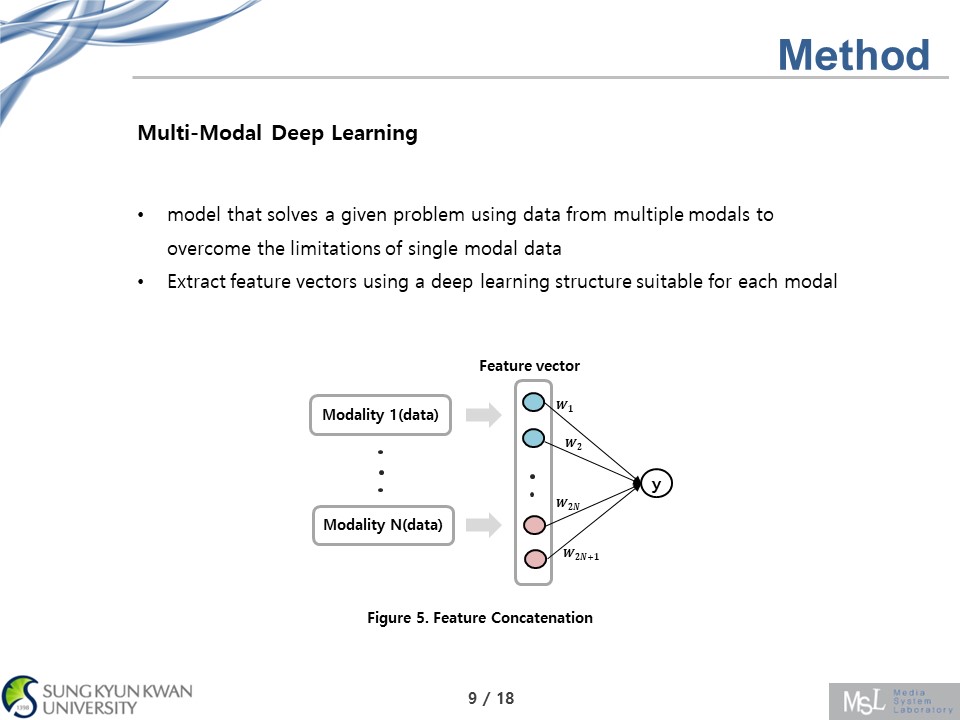 |
Before showing the multimodal results, let me briefly introduce multimodal learning. Multimodal learning is a model that solves a given problem using data from multiple modals to overcome the limitations of single modal data.
For proposed method, we choose the methods of extracting feature vectors
|
|
ICACT20230066 Slide.10
[Big slide for presentation]
[YouTube] |
Chrome Text-to-Speach Click!! |
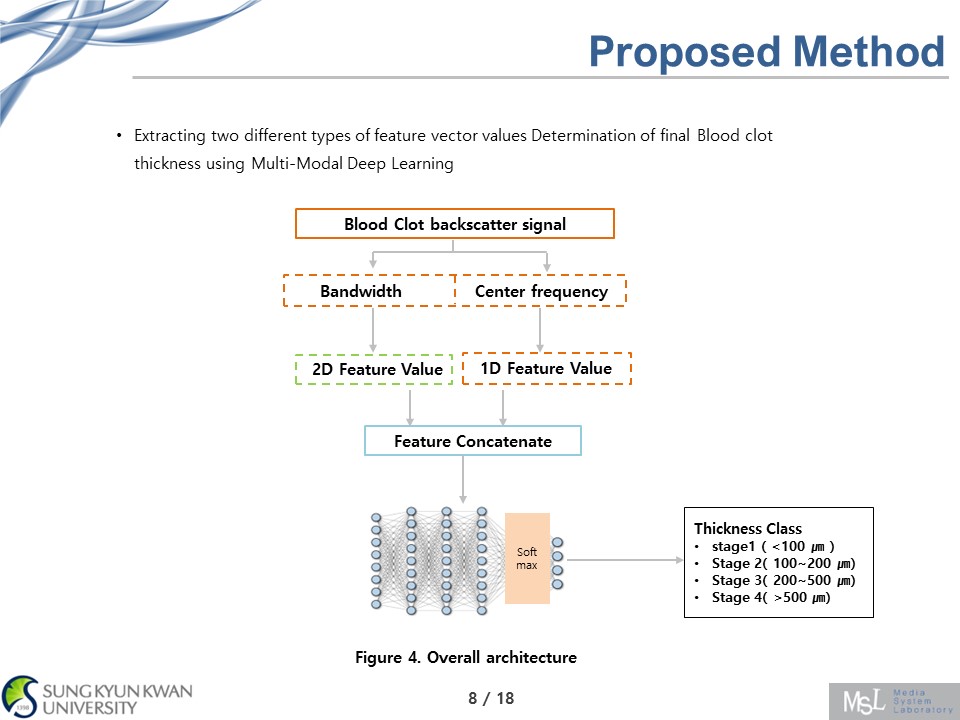 |
The overall structure is here.
First, the 1D feature vector value is extracted using the Center Frequency information of the blood clot backscatter signal. Also, from image data , 2D feature vector is extracted
And then, two type of feature vector go through the feature concatenation process.
thickness value of the Blood clot can be inferred through multimodal learning from two types of feature vectors.
|
|
ICACT20230066 Slide.09
[Big slide for presentation]
[YouTube] |
Chrome Text-to-Speach Click!! |
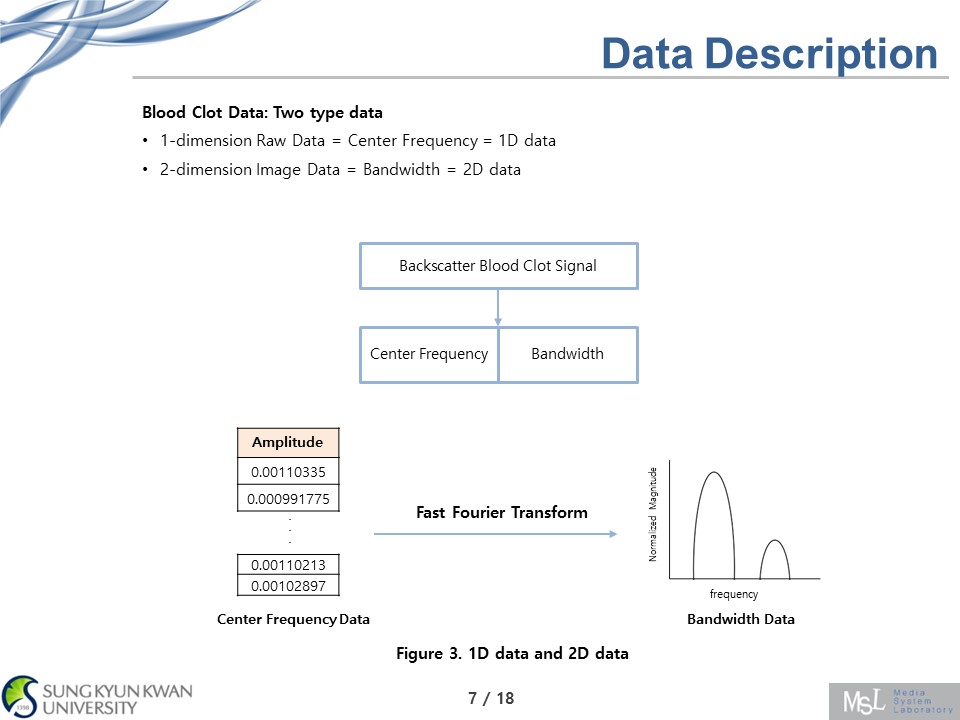 |
We can get this two type of data , so I'll call it a 1D and 2D in here, for convenience
Band width and center frequency can be obtained from the blood clot backscatter signal, and 2D data is created by applying a Fourier transform to 1D data.
Both are 1660 pieces of data, and each stage consists of 400 pieces of data
|
|
ICACT20230066 Slide.08
[Big slide for presentation]
[YouTube] |
Chrome Text-to-Speach Click!! |
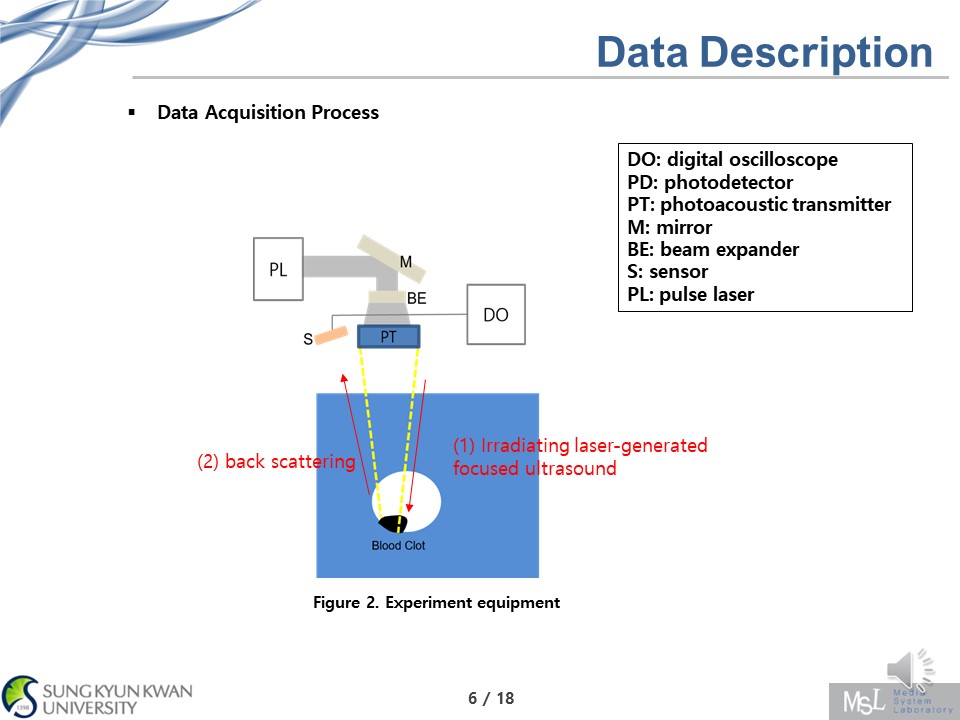 |
This is the blood clot data acquisition process. Figure 2 shows the experimental equipment for obtaining blood clot thickness data.
A blood clot is detected by Irradiating the laser-generated focused ultrasound on the blood clot model.
Furthermore, the strong acoustic pressure of the LGFU enables the measurement of backscattered signal although the signal became weak due to the considerable scattering on the acoustic path in the phantom.
|
|
ICACT20230066 Slide.07
[Big slide for presentation]
[YouTube] |
Chrome Text-to-Speach Click!! |
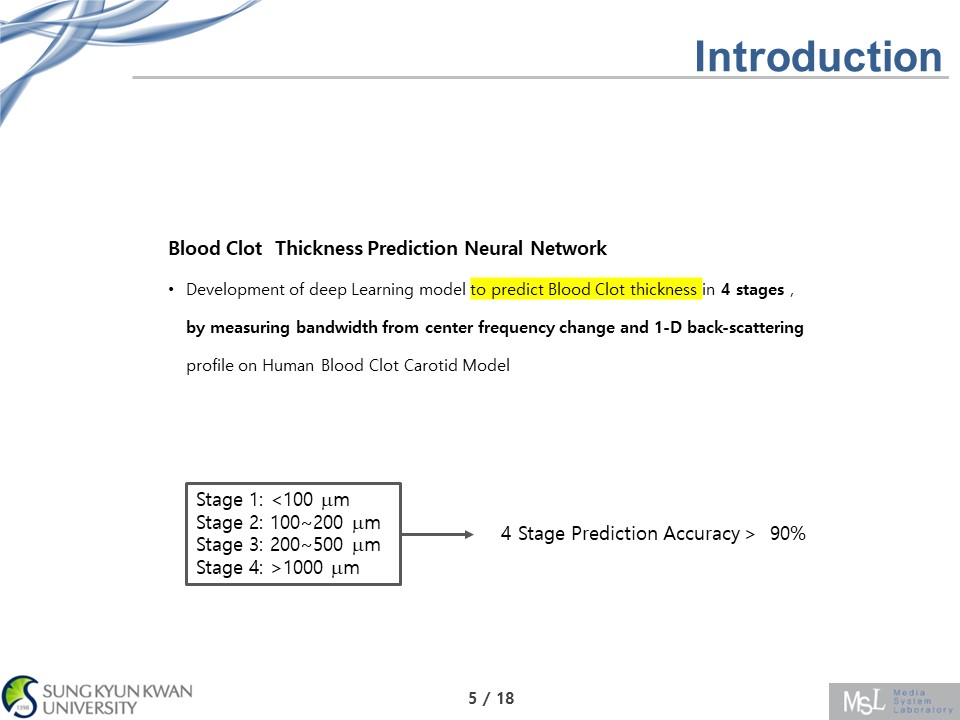 |
So we proposed Blood Clot Thickness Prediction Neural Network, it is Development of deep Learning model to predict Blood Clot thickness in 4 stages , by measuring bandwidth from center frequency change and 1-D back-scattering profile on Human Blood Clot Carotid Model
|
|
ICACT20230066 Slide.06
[Big slide for presentation]
[YouTube] |
Chrome Text-to-Speach Click!! |
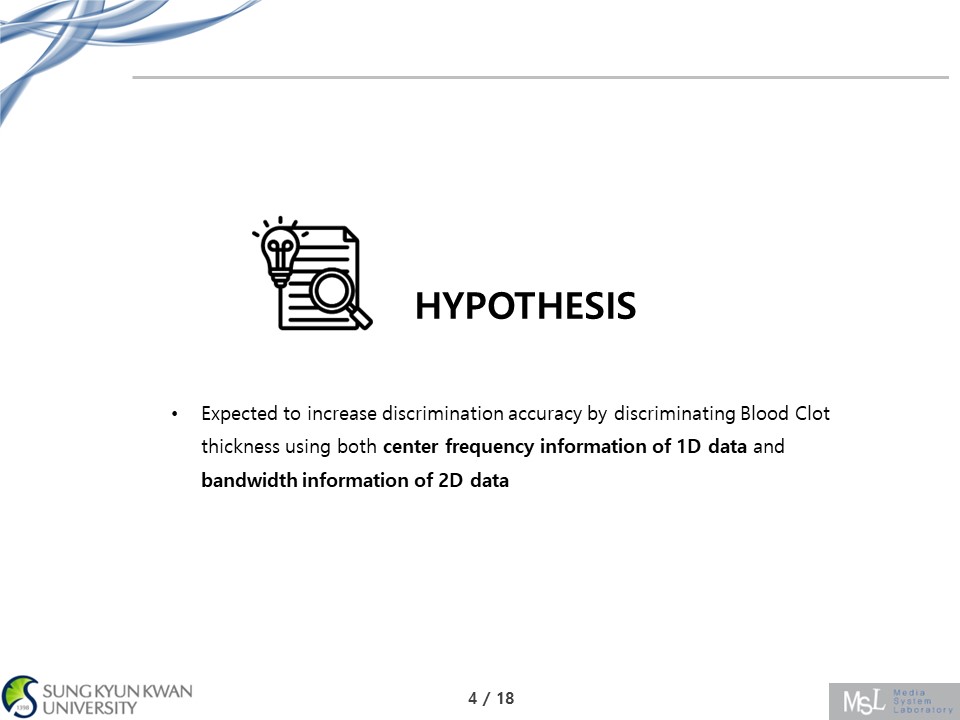 |
so we expected to increase discrimination accuracy by discriminating thrombus thickness using both center frequency information of 1D data and bandwidth information of 2D data.
And we hypothesized that the thickness of blood clots can be distinguished from 1D raw ultrasound signal data and the 2D transformed data by applying amplitude-frequency conversion to 1D raw ultrasound signal data.
|
|
ICACT20230066 Slide.05
[Big slide for presentation]
[YouTube] |
Chrome Text-to-Speach Click!! |
 |
Recently, Deep Learning studies have shown high performance for ultrasound medical data
|
|
ICACT20230066 Slide.04
[Big slide for presentation]
[YouTube] |
Chrome Text-to-Speach Click!! |
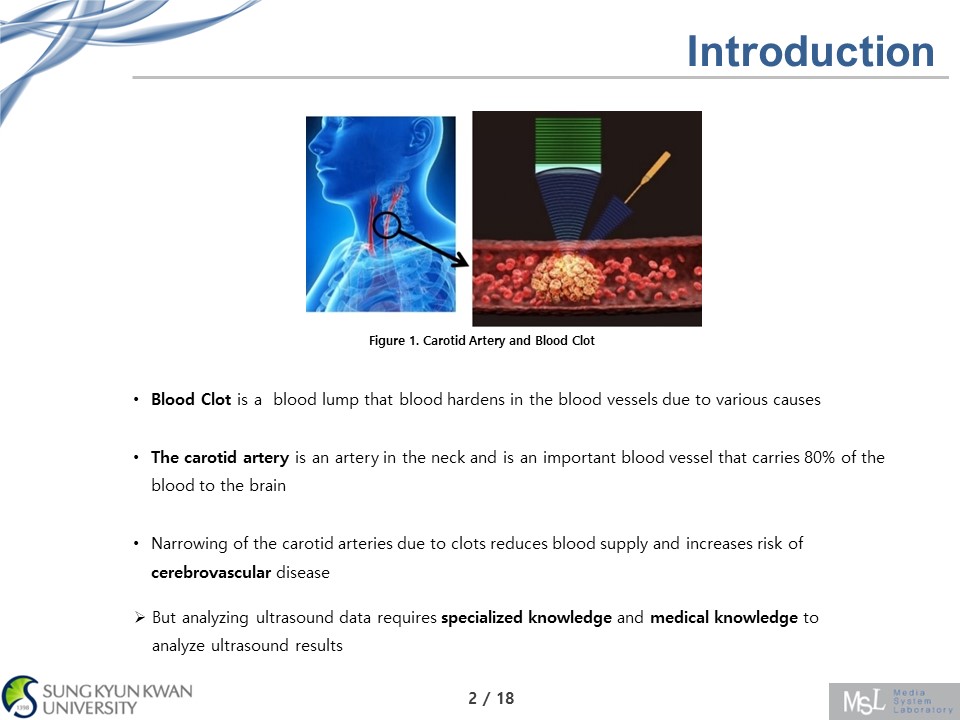 |
I will start with a brief explanation of blood clots.
Blood Clot is a blood lump that blood hardens in the blood vessels due to various causes.
The carotid artery is an artery in the neck and is an important blood vessel that carries 80% of the blood to the brain.
Narrowing of the carotid arteries due to clots reduces blood supply and increases risk of cerebrovascular disease.
But analyzing ultrasound data requires specialized knowledge and medical knowledge to analyze ultrasound results.
|
|
ICACT20230066 Slide.03
[Big slide for presentation]
[YouTube] |
Chrome Text-to-Speach Click!! |
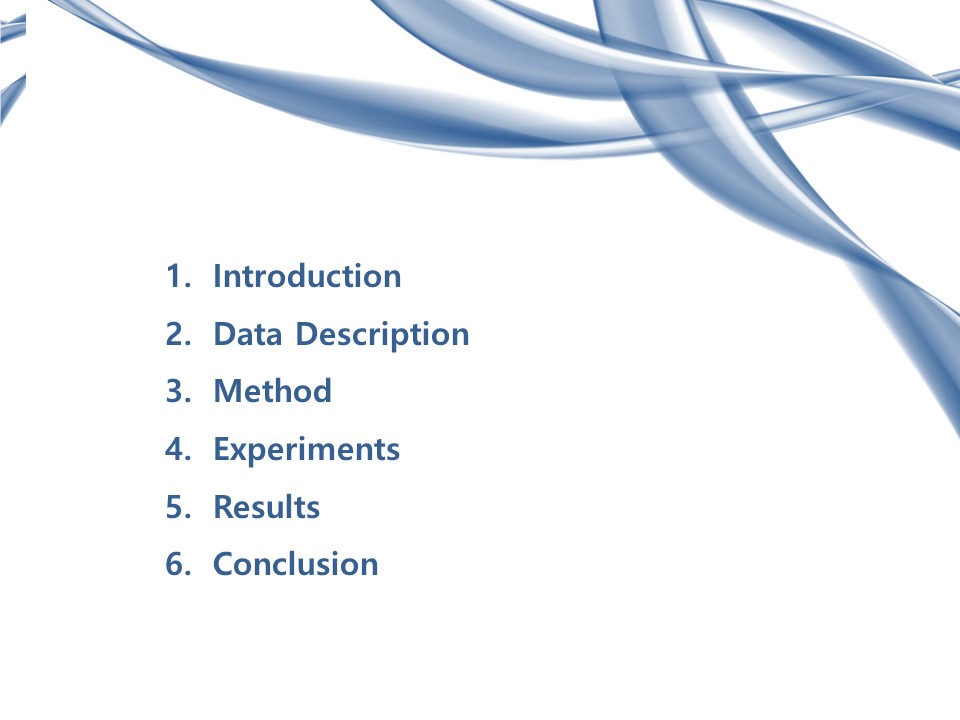 |
I'll tell you in this order.
|
|
ICACT20230066 Slide.02
[Big slide for presentation]
[YouTube] |
Chrome Text-to-Speach Click!! |
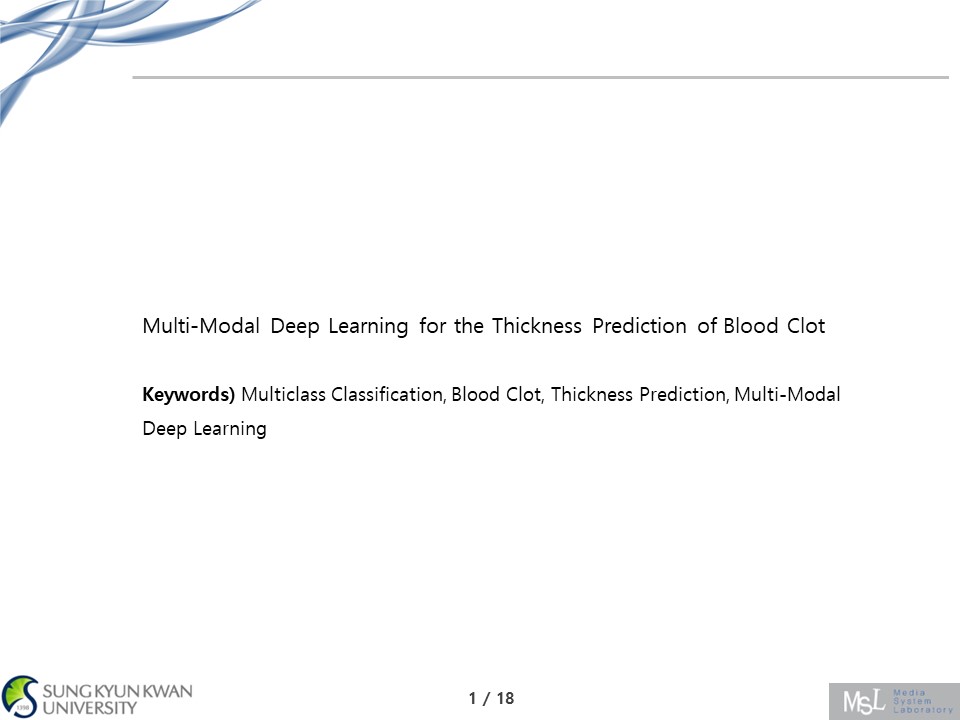 |
The research title is multi modal deeo learning for the thickness prediction of blood clot. It is about multiclass classification, blood clot, thickness prediction and multi-modal deep learning.
|
|
ICACT20230066 Slide.01
[Big slide for presentation]
[YouTube] |
Chrome Text-to-Speach Click!! |
 |
hi I'm jiseon moon. Currently I'm doing master course in department of Electrical and Computer Engineering, Sungkyunkwan University.
Now, I will introduce my research Multi-Modal Deep Learning for the thickness prediction of Blood clot.
|
















